Analysis of Observations of the 2015 Sep. 28 Total Lunar Eclipse
Helio C. Vital
Unfavorable
Weather Conditions for Most Brazilian Observers
Unfortunately, a huge
storm system caused 90% of the potential Brazilian observers,
mostly located in São Paulo, Rio de Janeiro and Florianópolis,
to be clouded out during the eclipse. However, we were still able to gather 8 Danjon estimates (L) and 2 series (curves) of L. We also
got an extensive sequence of contact timings made in Belo Horizonte by the CEAMIG/REA team in
addition to many photos of the totally eclipsed moon. Based on such data, we
were able to determine how dark the eclipse was as well as how large the
contribution of Earth`s atmosphere to the umbra currently is.
How Dark Was the Eclipse?
The total lunar eclipse
of September 27-28, 2015 was moderately dark as we had already predicted in our
Observation Project. It was not very dark as many observers claimed, even
though the brightness of the eclipsed Moon was found to be dimmer by approximately
50 thousand times at mid-totality in comparison with the Full Moon.
Danjon Number Estimates
A
very easy way to estimate the brightness of an eclipse is to find the
prevailing coloration of the Moon. This very simple and practical method was
proposed by Danjon and, although it is not as accurate
as direct estimates of magnitude, it is also informative.
Danjon Estimates (L) Made Easier
When considering how we could help beginners make Danjon estimates, we elaborated the following procedures,
also suggesting that extreme values (like L=0) should be avoided:
Alex`s
Danjonmeter
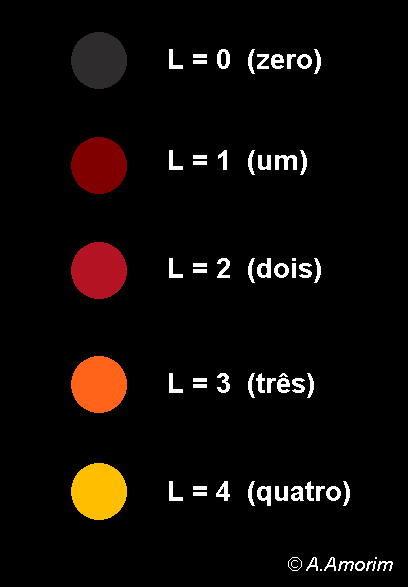
Alexandre Amorim, an astronomer with
large observational experience, had a very creative idea before the eclipse: the
observer would download, to his cell phone, a color scale Alex called Danjonmeter.
During totality, he would hold up his phone in order to position the color
scale next to the Moon in order to compare the color of the Moon with those on
the scale. He would then assign a value of L according to the prevailing color
he saw.
Helio`s 3-Band Danjonmetry
Helio C.
Vital proposes another simple procedure to
estimate the Danjon Number. His idea is to split the
disc of the Moon in three parts or bands and assign a value of L to each of
them. The approximate percentage of each part relatively to the whole disc must
also be estimated. Note that they must add up to 100%. Then a simple weighed sum
will yield a good figure for the Danjon Number. As an
example, by inspecting some photographs of totality posted on SpaceWeather, he could create a mean mental image of the
Moon at mid-totality. It was structured as follows: there was a yellowish
bright band to the Southeast covering some 25% of the disc and he assigned L=3
to it. Next to it, he could see a central reddish band spreading across roughly
45% of the disc and he gave L=2 to it. Finally, to the Northeast he could
notice a dark band spanning about 30% of the disc and he estimated it had L=1.
Then his Danjon Estimate for the entire disc of the
Moon would be: L= 0.25 x 3 + 0.45 x 2 + 0.30 x 1 = 1.95 (bull`s eye, see Table
1).
Estimates
of the Danjon Number
Estimates of the Danjon Number (L) gathered from 10 Brazilian observers are
listed in Table 1. Two of them* were calculated for mid-eclipse from parabolic fitting
to series of estimates.
|
Table 1 |
|||||
|
Observer`s Name |
City |
Danjon Number (L) |
Observer`s Name |
City |
Danjon Number (L) |
|
Alba
Evangelista Ramos |
Brasília |
2.2 |
José Carlos Diniz |
Friburgo |
1.9 |
|
Antonio Rosa Campos |
Belo Horizonte |
1.5* |
Saulo Machado Filho |
Sobral |
1.5 |
|
Dino Nascimento |
São Paulo |
2.0 |
Tasso Augusto Napoleão |
São Paulo |
2.0 |
|
Edvaldo Trevisan |
São Paulo |
2.5 |
Tiago Rusin* |
Brasília |
1.9 |
|
Felipe
E. Hodar Luengo |
São Paulo |
1.8 |
Willian Souza |
São Paulo |
2.0 |
|
Mean Estimate of the Danjon Number:
1.93±0.30 |
|||||
Observers who would have
made Danjon estimates but reported negative
observations due to cloudy skies were: Alexandre Amorim (and several
members of NEOA-JBS in Santa Catarina),
Antonio Padilla Filho, Márcio
Mendes and Helio C. Vital.
In our project of
observation for the 2015 September 27-28 total lunar eclipse we had predicted a
Danjon Number of L=2.2±0.4 (1σ) at mid-eclipse,
already accounting for a probable darkening effect due to lingering
stratospheric aerosols from eruptions of Calbuco (VEI=4)
on April 22-23, 2015.
Indirect Estimates of the Visual Magnitude of the Moon
at Mid-Eclipse
Unfortunately, due to
bad weather, direct estimates of the visual magnitude of the Moon using the
perfected version of the reversed binoculars method were not made. However, we
can use our correlation that relates the Moon`s visual magnitude to Danjon Number. Thus, entering our mean estimate for the Danjon Number:
m =
4.2 – 3 L + (L/2)2 = 4.2 – 3 (1.93) + (1.93/2)2 = -0.7±0.6
Determining the Magnitude of the Totally Eclipsed Moon
from Photos
Analyses of several wide
angles photos of the eclipse, contributed by Cristóvão
Jacques (CEAMIG/REA), led us to conclude that the Moon was shining
approximately 2 magnitudes brighter than Alpha Piscis
Austrini (m=1.17), after properly accounting for the
different color of the star. The estimated magnitude of the Moon based on the
photos was m =
-1.1±0.5.
A mean of both estimates
yields a final figure with a smaller associated error:
m= -0.9±0.4
Such value is also consistent
with a finding made by Willian Souza that he could
not see the Moon at mid-totality through his reversed binoculars, known to dim
the image by 4.8 magnitudes. Willian knew that his magnitude
limit was around 4.0±0.5. So he concluded that the Moon could not be brighter
than -1.3.
How Dark Was Earth`s Atmosphere?
The observed magnitude
agreed very well with our
predictions (-1.2±0.8) accounting for the most
likely darkening effects due to Calbuco aerosols that
we had forecast to cause +1.3 magnitude drop. An aerosol-free condition for the
stratosphere would have produced a moderately bright eclipse as the Moon would
be shining at m=-2.5 at mid-totality. The dimming of 1.6 mag found would also typically correspond to the darkening
effect due to an eruption of Volcanic Explosivity Index equal to 4,
that would peak some 5-7 months later, such as the one that happened to Calbuco on
April 22-23 (five
months prior to the eclipse). Then we had a moderately dark, not a very dark one,
as many observers claimed. The explanation for that false impression could
possibly be the fact that many of those observers over the last decade could
watch bright eclipses only. And they were brighter because they were not
significantly darkened by volcanic dust, besides having low umbral
magnitudes.
At mid-eclipse, the
total drop in the Moon`s brightness reached 11.8 magnitudes, corresponding to a
dimming of 50 thousand times. An observer standing on the Moon`s surface would then
see a bright ring surrounding Earth`s dark silhouette. That narrow mostly red
ring produced by Earth`s atmosphere would be shining at m≈ -15, some 8
times brighter than the Full Moon. Moving from the extreme North of the lunar
disc to its South, the observer would see that ring brighten, turning from rust
red into orange as he approached the center of the disc. Finally it would brighten
further, becoming mostly yellow by the time he got to the Southern part of the
Moon as he also approached the border of the umbra.
How Thick Was the
Shadow-Casting Layer of Earth`s Atmosphere?
That
analysis requires contact timings. Fortunately, Antonio
Rosa Campos and his CEAMIG/REA team had clear skies
during the entire eclipse and they obtained a fine data
set that included 43 selected limb and mid-crater timings.
Let us then see what those numbers have in store for us, in spite of the fact
that hundreds of contacts, contributed by many observers, would be the ideal
data set to work with in order to get very good statistics. Table 2 lists the mid-crater
and limb contact times observed by Campos and the corresponding percentage increase
in Earth`s radius (or in the Moon`s parallax) due to Earth`s atmosphere.
Table 2 – Contact Times (UTC) Observed
by Campos and Corresponding Increase in the Moon`s Parallax (or Earth`s Radius)
due to Earth`s Atmosphere
|
Lunar
Feature |
Contact
Time |
Increase
(%) |
Lunar
Feature |
Contact
Time |
Increase
(%) |
|
Immersions |
Emersions |
||||
|
Riccioli |
01:08:26 |
2.12 |
Riccioli |
03:30:58 |
1.19 |
|
Reiner |
01:11:46 |
1.45 |
Grimaldi |
03:31:36 |
1.43 |
|
Aristarchus |
01:14:04 |
1.58 |
Billy |
03:33:22 |
1.07 |
|
Euler |
01:21:33 |
0.71 |
Campanus |
03:37:44 |
1.58 |
|
Laplace |
01:24:47 |
0.67 |
Kepler |
03:43:09 |
1.02 |
|
Timocharis |
01:27:54 |
1.11 |
Aristarchus |
03:43:44 |
0.22 |
|
Plato |
01:30:29 |
0.75 |
Nicolai |
03:49:58 |
1.32 |
|
Autolycus |
01:34:29 |
0.81 |
Euler |
03:50:22 |
0.66 |
|
Aristoteles |
01:38:26 |
1.12 |
Copernicus |
03:51:51 |
1.95 |
|
Menelaus |
01:41:12 |
2.17 |
Bulialdus |
03:53:26 |
1.61 |
|
Tycho |
01:43:49 |
0.97 |
Pytheas |
03:53:42 |
1.31 |
|
Dionysius |
01:45:42 |
0.71 |
Laplace |
03:57:06 |
0.43 |
|
Plinius |
01:46:57 |
0.34 |
Timocharis |
03:58:01 |
1.07 |
|
Abulfeda |
01:47:06 |
0.91 |
Abulfeda |
03:58:26 |
0.95 |
|
Censorinus |
01:51:37 |
2.43 |
Stevinus |
04:02:45 |
1.23 |
|
Mare Crisium |
01:58:38 |
1.96 |
Pico |
04:03:47 |
1.66 |
|
Goclenius |
01:58:39 |
2.22 |
Menelaus |
04:08:15 |
0.97 |
|
Langrenus |
02:04:20 |
1.58 |
Censorinus |
04:11:23 |
1.39 |
|
U2(Total Starts) |
02:11:44 |
0.89 |
Plinius |
04:11:44 |
1.37 |
|
Mean of
Immersions: (1.29±0.15)% Mean of
Emersions: (1.26±0.09)% Mean of
Contacts: (1.27±0.08)% |
Eudoxus |
04:11:59 |
1.55 |
||
|
Goclenius |
03:37:44 |
1.81 |
|||
|
Proclus |
04:20:42 |
1.80 |
|||
|
Mare Crisium |
04:23:16 |
1.20 |
|||
The value found for the
contribution of Earth`s atmosphere, 1.27±0.08 %, is approximately halfway
between its 1.20% minimum (apparently reached last year) and its all-time
average (1.35%). It is also in good agreement with our prediction, extrapolated
from figures of the April 15, 2014 (1.20%) and April 4, 2015 (1.22%) eclipses.
Note that our contact times for this eclipse had been calculated by using increments
of 1.27% for immersions and 1.23% for emersions as informed in our Observation Project for the 2015 September 27-28 Total Lunar Eclipse.
The increase of 1.27% in Earth`s radius found for this eclipse would correspond
to a mesopausic height of 81±5 km and it would be
produced by a thin atmospheric light ring only 47 arcseconds thick if observed from the
Moon.
Photos and Videos of the Eclipse
The
CEAMIG/REA
observers` team (in Belo Horizonte) posted
nice photos, videos and an advanced report on their Sky and Observers Pages.
Final Considerations on Lunar Eclipse Predictions
Improving predictions of
lunar eclipses demands a great deal of observational data (contact timings and
estimates of the Moon`s magnitude, mostly). However, visual observers of such
events are now very rare in spite of the fact that the science of lunar
eclipses is essentially observational. Thus in order to predict the
circumstances of these events better, it is fundamental to further understand
the several mechanisms that play a significant role in the complex movie of our
upper atmosphere that is projected onto the sensitive lunar screen. Up to now, the major official sources of information
on lunar eclipses have failed to fully acknowledge and widely inform that the intricate
dynamics of Earth`s upper atmosphere severely limits the accuracy of their
predictions. Not to mention the fact that they still rely on the same model for
calculation of Earth`s umbra that Danjon used more
than a century ago. However as ironic as it may seem and in contrast to what
most people believe, the cause of the “missing totality” of the tetrad on April
4 was not the use of an outdated model. In fact its prediction (mag.=1.0001) was closer to the observed figure (mag.=0.9996) than the one (mag=1.0020) calculated with a sophisticated
model used by Sinnott-Herald
and myself. The villain that ruined most
predictions on that day was Earth`s atmosphere, that had almost shrunken to its
minimum size. Consequently, when the onset of totality required a minimum 1.25%
increase of Earth`s radius on that day, it could only provide 1.22%.