THE STANDARD PENETRATION TESTAND ITS USE IN GEOTECHNICAL ENGINEERINGIntroduction
The Standard Penetration Test (SPT) is
a well-established and unsophisticated method, which was developed in the
United States around 1927. It
is the
most widely used in-situ soil characterization test. It provides
a measure of the resistance of the soil to penetration through the blow
count "N", and a disturbed but representative soil sample
that can be used for classification and index tests. SPT has since undergone refinements with respect to
equipment and testing procedure. The testing procedure varies in different
parts of the world. Therefore,
standardization of SPT was essential in order to facilitate the comparison
of results from different investigations. The method has been standardized
as ASTM D 1586 since 1958 with periodic revisions to date [1].
The reliability of the method and
the accuracy of the result depend largely on the experience and care of
the engineer on site. The report presents standardization of methodology in
conducting the SPT. The report also contains various developed correlations between the Standard Penetration Test N-values and soil strength, soil compressibility, foundation bearing capacity, foundation settlement, and liquefaction potential. In each case it is made clear what corrections should be applied to the measured N-values. MethodologyThere are various methods available for advancing boreholes. During the advancement of the boreholes, soil samples are collected at various depths for further analysis. One of the methods used is the wash boring method shown in Figure 1 below.
The
Standard Penetration Tests is standardized through ASTM D 1586.
The sampling method being used in conducting SPT is the standard
split-spoon (split-barrel) sampling. A diagram of a split-spoon sampler is shown in Figure 2. It consists of a tool-steel driving shoe at the bottom, steel tube (that is split longitudinally into halves) in the middle, and a coupling at the top. The steel tube in the middle has inside and outside diameters of 34 mm (1⅜ in.) and 50.8 mm (2 in.), respectively. Figure 3 shows an unassembled split-spoon sampler. [2]
When the borehole is advanced to a desired depth, the
drilling tools are removed. The
split-spoon sampler is attached to the drilling rod and then lowered to
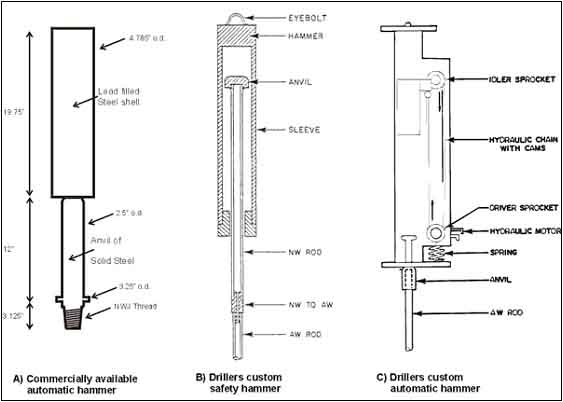
the bottom of the borehole. The
sampler is driven into the soil at the bottom of the borehole by means of
hammer blows. Figure 4 shows
the various schematics of hammer arrangements.
The hammer blows occur at the top of the drilling rod.
The hammer weighs 623 N (140 lb).
For each blow, the hammer drops a distance of 0.762 m (30 in.).
The number of blows required for driving the sampler through three
152.4 mm (6in.) intervals is recorded. The sum of the number of blows
required for driving the last two 152.4 mm (6 in.) intervals is referred
to as the standard penetration number, N.
It is also commonly called the blow count. [2] When the hammer is unable to drive
the sampler the full 18 inches, refusal is reached and the test is halted.
Refusal is reached when
After driving is completed, the sampler is withdrawn and the
shoe and coupling are removed. The
soil sample collected inside the split tube is then removed and
transported to the laboratory in small glass jars.
Determination of the standard penetration number and collection of
split-spoon samples are usually done at 1m intervals for the first 6
meters and subsequently 1.5 m intervals after the 6 meter depth. [2]
Disadvantages of the SPT test are: the
sensitivity to operator techniques, equipment malfunctions and poor boring
practice. It has been proven that operator techniques have a strong
influence on the energy transfer and resulting N-values. Lower transferred
energies will result in higher N-values. (Semi) automatic trip hammers
make more consistent test results. However, there are many types of trip
hammers each with a different design and resulting impact velocities. [6] To overcome the variations in transferred energies a standard N60-value is defined (ASTM D4633). The N60-value is the N value measured in the field (NF) adjusted by calibration to a reference energy Er of 60% (E60) or [6]: N60 x E60 = NF x Emeasured (1)
From investigations of cohesionless soil deposits, it is recognized that measured blowcounts will be affected by the soil depth being sampled. For identical soils, the resistance to penetration at a deep location will be greater than the resistance value developed for a shallow location because of the influences of greater overburden and confining pressure and diferent driving energy losses in the drill rods. [1]
According to the correlation developed by Liao and Whitman (1986) [2], the field blowcounts, NF, can be corrected for the depth effect by applying a correction factor, CN, with
where
U.S. ton = 2,000 lb) for equations (2a) and (2b), respectively.
According to the correlation developed by Skempton (1986) [2],
where
U.S. ton = 2,000 lb) for equations (3a) and (3b), respectively. Therefore
[1],
Table 1 shows
approximate correlations for the standard penetration number Ncor,
and relative density, Dr.
Table 1.
Approximate relationship between Ncor Value and Dr [2]
Cubrinovski and Ishinara (1999) [2] proposed a correlation between NF and the relative density of granular soils (Dr) in the form
where
size through which 50% of soil will pass (mm).
The drained
angle of friction of granular soils, f�, has also been correlated to the standard peneration number.
Peck, Hanson, and Thornburn (1974) gave a correlation between Ncor
and f� in a graphic form, which can be approximated as (Wolff, 1989) [2] f� (deg) = 27.1 + 0.3Ncor � 0.00054Ncor2
(6) Schmertmann
(1975) also provided a correlation for NF versus
(1990), this correlation can be approximated as
where pa
is the atmospheric pressure (same unit as
Table 2. Correlation Between Soil
Conditions and Standard Penetration Test N-Value [3]
Correlations
between the blow count N from the Standard Penetration Test and the angle
of internal friction have been developed.
These correlations are presented in Table 3. Due to the generalized nature of the correlation, any
application of such data to final foundation designs should be made with
caution. Table 3. Approximate Relationship Between
N and f for Cohesionless Soil [3]
Approximate
relationships between values of cohesion and N have been
developed. Values are presented
in Table 4. Due to the
approximate nature of the
values, the data should be applied with caution. Table 4. Approximate
Relationship Between N and Cohesion of Clays [3]
The
unconfined compression strength (qu) of clay soils can
also be approximately correlated to the standard penetration number N.
Table 5 gives the approximate relationship among the standard
penetration number at a given depth, the consistency, nd the unconfined
compression strength of clayey soils. Table 5. Approximate
Correlation of SPT N-Value and Consistency of Clay [2]
It is
important to point out that the correlation between N and qu
given in Table 5 is only approximate. The
sensitivity St of clay soil also plays an important role
in the actual N value obtained in the field.
In any case, for clays of given geology, a reasonable correlation
between N and qu can be obtained, as shown in
Figure 7.
In this
figure, the notation pa is the atmospheric pressure (in
the same unit as qu).
For the data shown in Figure 7, the reported regression is given by (Kulhawy
and Mayne, 1990).
Sand deposits may experience liquefaction during an earthquake or other occurrence that creates seismic shock; liquefaction results in a temporary loss of soils shearing strength. Factors such as the ground acceleration created by shock waves, soil density, and depth are known to have an influence. The susceptibility to liquefaction has been related to the corrected N value (the N value that includes depth and energy ratio corrections). Sites where the N values are less than Ncritical (as calculated from the following expression) are indicating susceptibility to liquefaction [3]:
In this expression, use
intensity
of VIII, and 16 for an earthquake intensity of IX.
The percent clay refers to the material finer than 0.002 mm.
The terms
sand layer under study and to the groundwater table, respectively [3].
Generally,
corrected N values less than 20 are considered to indicate that the
site has a high potential for earthquake damage.
Sites where the considered N values are between 20 and 30 are
classified as having the potential for an intermediate degree damage.
Sites where N values are greater tha 30 are considered
locations where no significant damage from earthquake or seismic shock is
expected [3]. Empirical relationships between the maximum shear modulus, Gmax, for sandy soils
and N-value also exist. Ohta
and Goto (1976) and Seed et al. (1986) gave the relationship [4]
where Gmax and
Imai and Tonouchi (1982) gave [4]
where Gmax is in kips/ft2.
In general, more than one
empirical correlation is available to derive each particular soil
property, and the accuracy of estimations is highly dependent on selection
of the appropriate correlations for the respective material. Use of
available laboratory soil test results, as well as any other available
collateral information to select the right correlation formula for each
soil material can increase significantly the confidence in the estimated
parameters. The
standard penetration number is a useful guideline in soil exploration and
assessment of subsoil condition, provided that the results are interpreted
correctly. Note that all
equations and correlations relating to the standard penetration numbers
are approximate. Because soil
is not homogeneous, a wide variation in the NF value may
be obtained in the field. For
soil deposits that contain large boulders and gravel, the standard
penetration numbers maybe erratic. [1] Bowles, Joseph E.,
Foundation Analysis and Design, 4th edition, 1988. [2] Das, Braja M., Principles
of Geotechnical Engineering, 5th edition, 2002. [3] McCarthy, David F.,
Essentials of Soil Mechanics and Foundation, 5th edition, 1998. [4] Kramer, Steven L., Geotechnical Earthquake Engineering, 1996. [5] Schematic of various SPT
hammer arrangements.htm |
||||||||||||||||||||||||||||||||||||||||||||||||||||||||||||||||||||||||||||||||||||||||||||||||||||||||||||||||||||||||||||||||||||||||||||||||||||||||||||||||||||||