
Licentiate Thesis 1987:06L, Lulea University, Sweden
Figure 1.6 The standard short rod chevron notched core specimen (ISRM). D = Diameter of specimen; w = Length of specimen, w/D = 1.45 +- 0.02; 2q = Chevron angle, 54.6o +- 1.0; ao = Chevron tip position, ao/D = 0.48 +- 0.02; t = Notch width, t/D < 0.03.

Figure 3.2a The specimen cutting scheme.


Figure 3.2 Laboratory coring and post experiment slicing of Kallax gabbro rock block.

Figure 3.4 Test setup and acoustic emission instrumentation, where (1) is the AE transducer, (2) totalizer, (3) distribution analyzer, (4) rock specimen, (5) aluminum alloy end plates, (6) loading steel plates, (7) crack opening gauge.

Figure 3.1 The unloading stages shown on a typical load versus crack mouth opening displacement curve, where (1) "Beginning" of non-linearity; (2) "Middle" of the non-linearity region; (3) "Peak" load; (4) Maximum AE point in the post peak region; and (5) "End" of the complete curve.

Figure 3.3a Setup for crack measurement under ultraviolet light, where the slice stand is on the left and the ultraviolet light lamp is on the right.

Figure 3.3 A marble slice under ultraviolet light.

Figure 3.8 A marble slice under normal light from Spec.3-4.
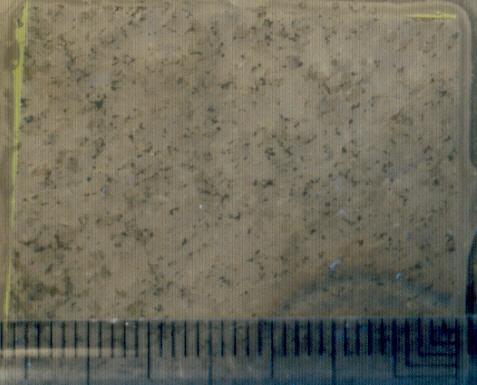
Figure 7-0 Thin section of Kallax gabbro (about 36 mm in length), from bottom surface for Specimen 1-7 of Fig. 13. (Note that the black arch shape in the lower right corner is on the metal stand behind the thin section. This indicates that the thin section is transparent.)

Figure 3.7c Photographs of cracks on all slice surfaces for Specimen 2-1 of Series 2 tests. From top to bottom, the slice surface numbers are 1B, 1A, 2B, 2A, 3B, 3A, 4B, 4A, 5B, 5A. Note that all the B surfaces are flipped upside down so that we are looking at the crack traces from the same direction.

Figure 3.5b Crack front in gabbro specimens of Series 2.
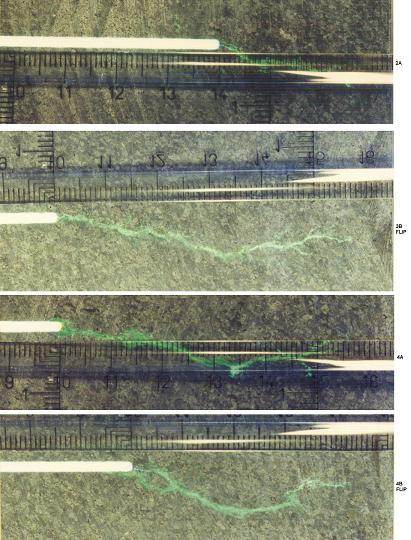
Figure 7-2 Photographs of a few slice surfaces for Specimen 1-7 of Series 1 tests.

Figure 3.7a Center slice of Specimen 1-4 of Series 1 that was photographed under normal light. Note that the right hand portion of the plastic millimeter scale reflected light to appear in white color.

(a)

(b)
Figure 3.6. Measured crack fronts in Bjorka marble specimens, where (a) on rough surfaces and (b) on polished surfaces.
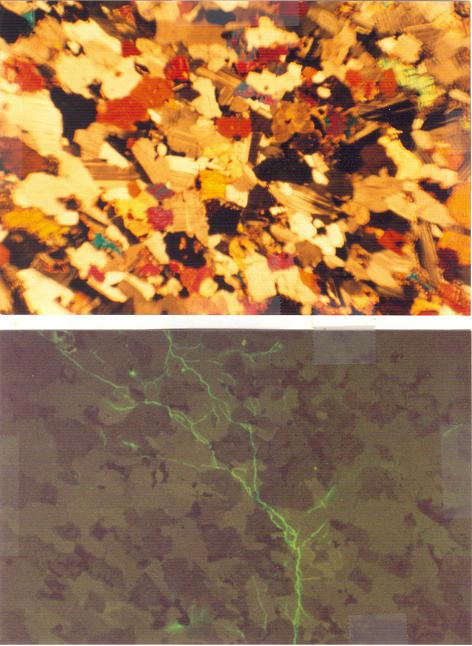
Figure 7-3 The last big bifurcation of the crack, where the top picture was photographed with polarized light and the bottom picture with transmission ultra-violet light, both Mag. 10. Note that the specimen back face is situated in the north of the pictures, and the notch plane is situated to the east of the cracks.
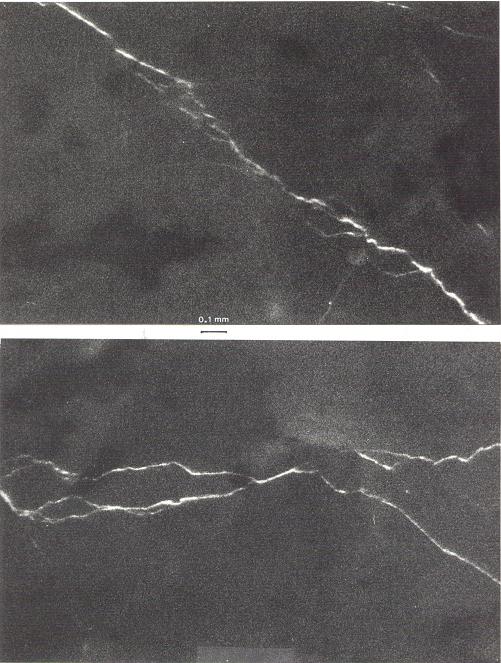
Figure 7-4 Further magnified segments from Fig. 7-3 (bottom photo) with reflected ultra-violet light, where the top picture shows the single crack located below the large loop, and the bottom picture shows the segment at the big bifurcation point; Mag. 70.
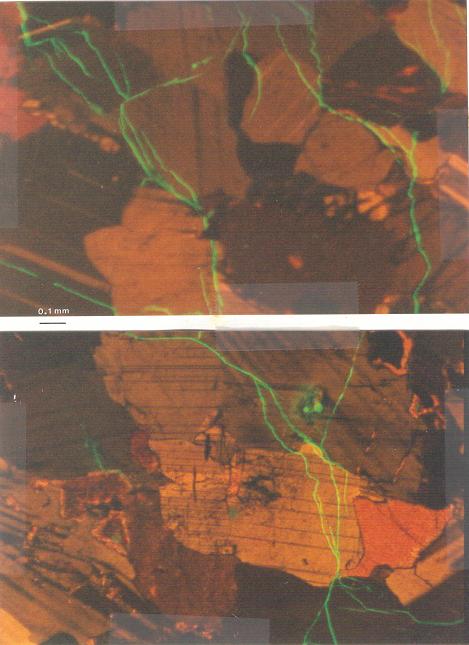
Figure 7-6 Magnified segments of the crack under both polarized and ultra-violet light, where the top picture shows the two major branches immediately after the big bifurcation point in Fig. 17, and the bottom picture shows the loop before the big bifurcation point; Mag. 70.
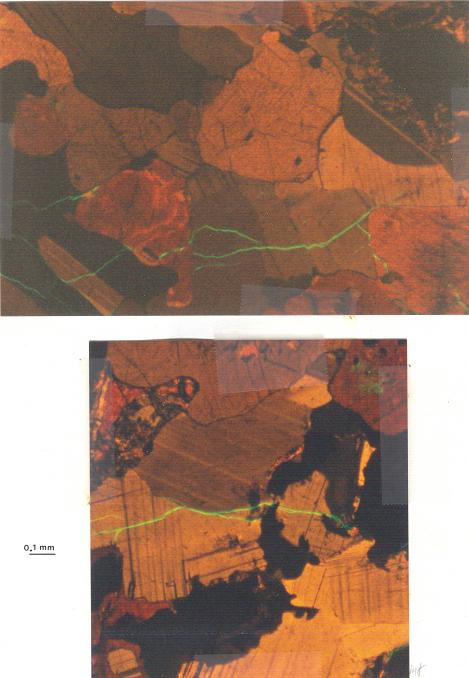
Figure 7-5 The very tips of the two major branches under both polarized and ultra-violet light, where the top picture for the left branch of Fig. 17, and the bottom picture for the right branch; Mag. 70.

Figure 3.10 Load versus CMOD and AE count rate curves for Specimen 2-1 of Series 2 tests.
(a)
(b)
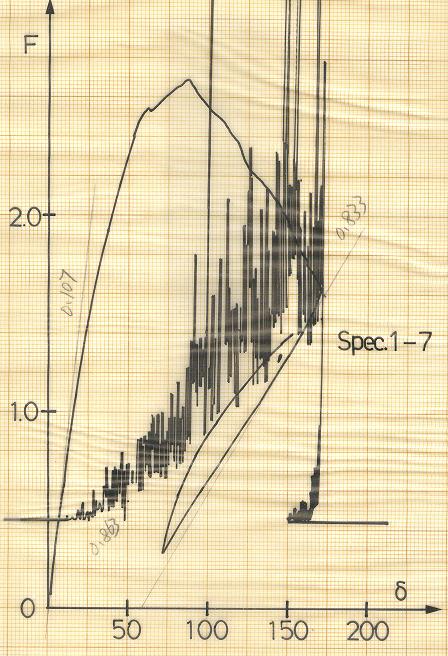
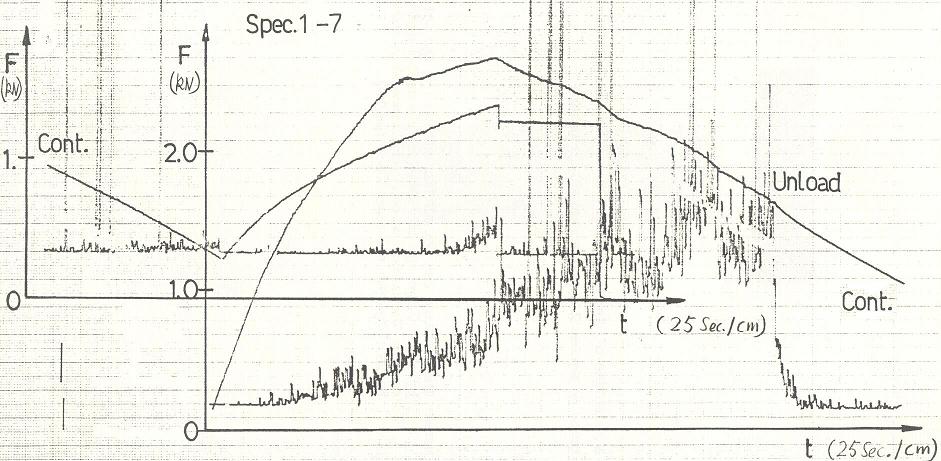
Figure Appendix 4B. Test curves for Specimen 1-7, where (a) shows load versus crack mouth opening displacement, and (b) load versus time. Note in (b) the plotting pen was moved back when it reached the limit.