CAUSE AND EFFECT DIAGRAM
![]()
OVERVIEW
![]()
PURPOSE AND USAGE
To provide a pictorial display of a list in which you identify and organize possible causes of problems, or factors needed to ensure success of some effort.
It is an effective tool that allows people to easily see the relationship between factors to study processes, situations, and for planning.
![]()
The cause-and-effect diagram is also called the Ishikawa diagram (after its creator, Kaoru Ishikawa of Japan), or the fishbone diagram (due to its shape).
It was created so that all possible causes of a result could be listed in such a way as to allow a user to graphically show these possible causes. From this diagram, the user can define the most likely causes of a result.
This diagram was adopted by Dr. W. Edwards Deming as a helpful tool in improving quality. Dr. Deming has taught Total Quality Management in Japan since World War II. He has also helped develop statistical tools to be used for the census and taught the military his methods of quality management. Both Ishikawa and Deming use this diagram as one the first tools in the quality management process.
INSTRUCTIONS FOR CREATING A CAUSE AND EFFECT DIAGRAM
![]()
1. Draw a large arrow horizontally across the page pointing to the name of an effect (such as Late for Work).
2. Draw four or more branches off the large arrow to represent main categories of potential causes.
3. Tertiary causes can be listed on branches off the category branches.
4. Additional causes can be branched off the tertiery causes.
![]()
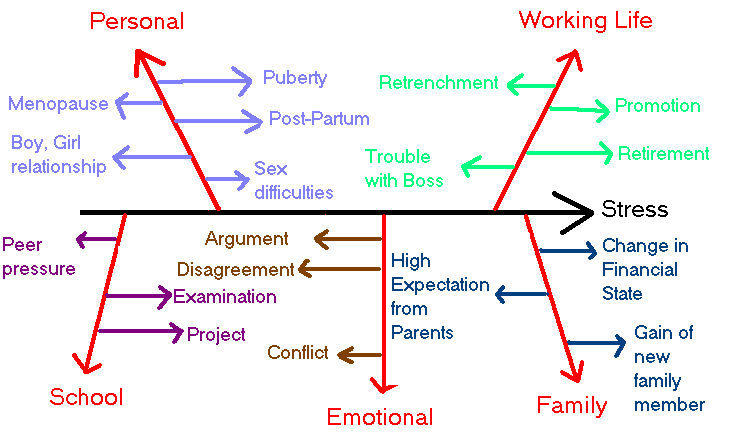
Purpose: To list out the sources of stress
This is an overview of what causes stress. So in this case the effect would be stress. Follow by, five branches which represent main categories of potential causes. They are personal, working life, school, emotional and family issues.