DISTANCE BACK FROM BANK EDGE
Mean of 4 to 5 field samples each,
taken behind a typical beach bank in
the San Juan Islands (at 2-17 cm depth)
(sdev ca +- 8%).
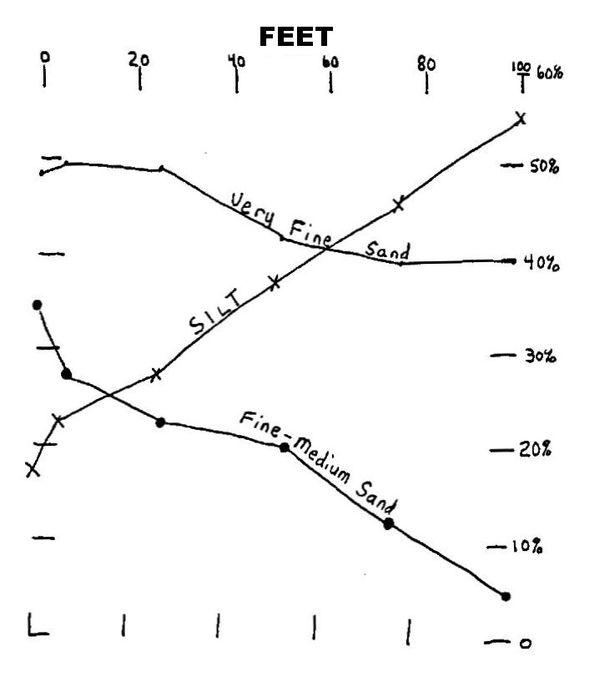
Most archaeological sites on Whidbey and the San Juan Islands are located along the shoreline. The people who once lived here were well adapted to a maritime environment and located themselves close to their livelihood. Most that remains are large quantities of refuse(mostly shell) and scarce noteworthy artifacts. An examination of about 25 exposed bank sites throughout the islands suggests that most shell deposits are no more than 1500-3000 years old. Methods of determining the age of these sites and the surrounding soils are discussed herein,
Silt and sand particles of most near—shoreline soils and archaeological sites are aeolian deposited (air born) from eroding cliffs and/or beaches. Many variables exist in aeolian deposition(e.g.— topography, parent material, large structures and sand traps), and if these variable were reduced, a similar trend in aeolian deposition might be expected. One variable used in the study of site. in the islands was that they be located on terrain of 0-8 % % slope, behind shoreline banks 7 to 12 feet above mean high tide(15-20 feet above mean sea level), and the beach banks consisting of sandy clay to loamy sand glacial till or outwash material. Since sand is aerially transported no more than 8 feet above the land surface, only the sand particles in the eroding bank will be transported over the edge, and few, if any from the beach.
A very important variable in tune with aeolian deposition, is preservation of the deposited particles from further wind erosion. All sites examined were restricted to a grassland or a prairie-forest transition environment. Grass preserves aeolian particles from further wind erosion, and will grow rather quickly over an exposed surface. The soil, resulting from aeolian particles and grass are very rich in organic matter, and thus, very dark brown or black. They are classified with Mollisols(Order) or Umbrepts(Suborder, of Order Incetisols), depending mainly on the thickness of the dark horizon. Most of those examined locally can be assigned to the San Juan Series(Pachic Xerumbrept), arid a few to the Snakelum Series(Typic Xerumbrept), Townsend Series (a Mollisol), or Coveland Series(Xeric Argiaboll, a Mollisol).
An important reason for examining these soil, as a dating tool is the unique similarity of soil type and volume within the shell midden compared to the adjacent soils not disturbed by man. The volume of soil within a shell midden, after the shell has been removed, is nearly equivalent to the volume of the adjacent non-midden soil horizon. Many shell middens have several horizons (e.g.— non-shell to shell) which can be traced up to several hundred feet or to adjacent beaches. The soil volume within a midden can be used as a stratigraphic tool, as it can be traced to similar volumes over large distances. Absolute and relative dating of all sites suggests that a similar deposition rate exists( 1 to 3 cm per century).
A carefully trained eye can estimate fairly accurately the soil accumulation within a shell midden without the need of digging into and destroying the midden. Digging into a midden most often will result in resettling of particles, and thus, erroneous results.
The velocity at which small sized particles settle out of a fluid is proportional to the square of the diameter of the particle(Stokes Law). In other words, if you dump some sand and some clay into a bucket of water, the sand settles to the bottom first because it’s bigger. The same law applies to wind blown particles. Sand is aerially transported no more than 4-8 feet above the land surface, while clays can exist in solution to within a few tens to a few thousand feet.
Given a bank site at least 6 feet above beach level, most of the sand particles to be blown over the bank will be from the bank, and not from the beach. At the banks edge, rising and converging air develops a high pressure area which enables sand particles to be transported over the edge. Once over, they can be carried several feet in suspension and lay where they land, or bounce along the earth's surface, usually within a few feet (known as the saltation process). Objects of air impedance, such as grass blades, brush, or gaps between exposed shell, inhibit further transport, From the beach bank and beyond to within a few hundred feet, sand will separate out first, and the remainder will be silt(see figure 1). The turbulent action of the wind results in fine particles (clay) being carried upward into the atmosphere and hundreds of miles horizontally. They return to the earth only when the wind subsides, and. when precipitation washes them down. This process is believed to account for no more than 40% of the total clay volume in most inland soils. The extent to which aeolian sand and silts are transported inland is mostly limited by by exposure, slope, terrain, and vegetation, which usually limits most of the sand aeolian process to within a few tens to few hundred feet behind the shoreline,
|
DISTANCE BACK FROM BANK EDGE Mean of 4 to 5 field samples each, taken behind a typical beach bank in the San Juan Islands (at 2-17 cm depth) (sdev ca +- 8%). |

|
Soils that have formed under somewhat similar conditions as the aeolian derived grasslands of NW Washington and SW British Columbia are found in Eastern Washington, the North American Plains, and in Eastern Europe/West Russia, The Chernozem soils of Eurasia formed on vast flatlands, and strictly under grass. Typically they contain 25% clay, 65% silt, and 10 % sand throughout the depth of the soil profile, and deposited under aeolian conditions. The climate associated with these soils is continental, and receives 10 to 20” of precipitation annually, long hot and dry summers, and cold winters. The forest/grassland transition receives about 16” precipitation annually, and the grassland/sagebrush transition, 8-10" annually(e.g.-Eastern Washington). These vast grasslands create an open environment which, during high with., allow dust particles of fine sand size and smeller to move parallel to the ground and upwards by means of air suspension.
Over 100 C14 dates have been made on the humus fraction from 35 aeolian derived Chernozem profiles from Eurasia, and reveal an age/depth relationship (1.8 cm per century) nearly the same as those of Whidbey and the San Juan Islands(1.7 cm per Century [away from the banks edge]) (See figure 2) • Very few aeolian grassland soils of North America have been dated, but still reveal a somewhat similar age/ depth relationship. ,
All the sites examined really have 30-60 on dark brown to black soil accumulation over either grey sterile glacial till, outwash, or light brown/yellow brown B horizon, paleosol, or otherwise, Of the 24 sites, three rather distinct volumes were noted: 55+-3 cm(14 sites or 58%), 42+-1.5 cm(6 sites or 25%), and 33+-1.5 (4 sites or 17%). One large site has been dated, and suggests the 55 cm volume is close to 3000 years old.. This coincides with a major climate transition from warm and dry to cold and wet between 1000 end 800 BC. The change was only an increase of about 15% in the amount of (precipitation(see figure 8a), but is well represented in Carbon 14 dated, sites associated with major flooding of Western Washington rivers and. the Fraser River(figure 8c), and a major increase in lake sedimentation rates of Western Washington and SW British Columbia (figure 8b) • Another site has been dated, and suggests that the 33 cm depth is associated with an age of about 700 AD, and appears to be related to similar flooding, erosion and increased lake sedimentation rates at about 500 AD. A cross correlation of soil volume of midden horizons between all sites yields similar stratigraphic breaks at 22 and 33 cm, and can be associated with the San Juan Phase and subphases(Maritime Subphase ca 500-1200 AD and Late Subphase as 1200 AD to historic times).
The correlations between relative dating and soil volume are plotted, as shown on figure 2.. The transition to an increased accumulation rate about 500 years ago appears to be correlated with increased aeolian deposition as the current beach banks were being exposed and also the last major wet cycle around 140O1600 AD. Also probably involved is the error of not removing all the percent of root mass(low bulk density) in the upper 15 cm of the bank profile.
----------------------------------------------------------------------------
                              TIME
           1500 AD    1000 AD    500 AD     AD / BC    500 BC     1000 BC
 0_____________³__________³__________³__________³__________³__________³
 ³     .
 ³      X       3.48+-.43cm 6 Historic Village Sites abandoned 1830-1880 AD
 ³        .
 ³         X       8.10+-.69cm 7 Sites (tree ring/tree circumference dated)
10--        .                          1700+-50 AD
 ³           .
 ³            .
 ³              .
 ³                .
20--                .
 ³                    X     21.66+-.97cm 13 Sites ARCHAEOLOGICAL TRANSITION
 ³                       .          (Maritime/Late Transition; SJ Islands)
 ³                          .
 ³                             .
30--                              .
 ³                                  X     32.28+-1.45cm 13 Sites
 ³    33.02+-1.27CM Sever Eroision X    .        (Maritime/Late Transition;
 ³       Event - 4 Sites Whidbey/SJI      .      San Juan Island)
 ³       Climate Correlation                 .
40--                                            .
 ³          41.15+-1.52cm 6 Sites Whidbey/SJI      X
 ³          Severe Wind erosion Event (Climate Corr) .
 ³                                                       .
 ³          49.0+-2.8cm One Site San Juan Islands            .   X
50--                C14 date 2545ñ155BP (ca 730 BC)            .
 ³          52.32+-1.18cm 5 Sites San Juan Islands           X     .
 ³                  Base of Shell Mounds                            X
 ³          54.86+-2.79cm 14 Sites Whidbey/San Juan Islands
 ³                  Base of dark colored soil horizon (Climate Correlation)
60--___________³__________³__________³__________³__________³__________³

(NOTE:  Left column is   CENTIMETER ACCUMULATED SOIL DEPTH)
----------------------------------------------------------------------------
An examination of over 25 exposed bank sites throughout the islands suggest that a similar deposition rate exists of 1 to 3 cm per century.
A carefully trained eye can estimate fairly accurately the soil accumulation within a shell midden without the need of digging into and destroying the midden. Digging into a midden most often will result in resettling of particles, and thus, erroneous results.
The soils resulting from grass are very rich in organic matter, and are very dark brown or black. All of the sites examined locally have 30-60 cm dark brown to black soil accumulation over a light brown/yellow brown B Horizon, paleosol, gray sterile glacial till, outwash, or otherwise. Sixty percent of the sites had a volume of 55±3 cm dark soil and 25 percent had 42±1.5 cm accumulation. The 55 cm boundary coincides with a major climate transition from warm and dry (2000 to 1000 BC) to cold and wet (beginning 1000-800 BC). The change was only about 15% in the amount of “century mean” precipitation, but is well represented in Cl4 dated sites associated with severe flooding (Fraser, Skagit, and Hoko rivers, and in King County, and a dramatic increase in Lake Sedimentation rates of the Pacific Northwest.
2.1 Midden Profile Sampling
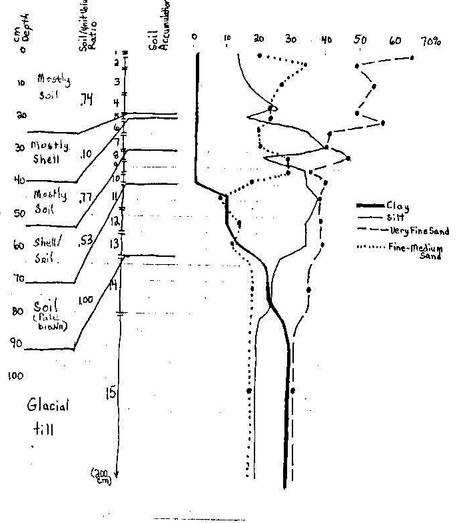
Over 100 soil samples were taken from a typical, well stratified. shell. midden bank in the San Juan Islands, and percentages of soil particles sizes were determined. The results were noted for correlations with shell to non-shell horizons, type fluctuations within a profile, soil volume, etc. The results reveal some obvious, and not so obvious, factors:
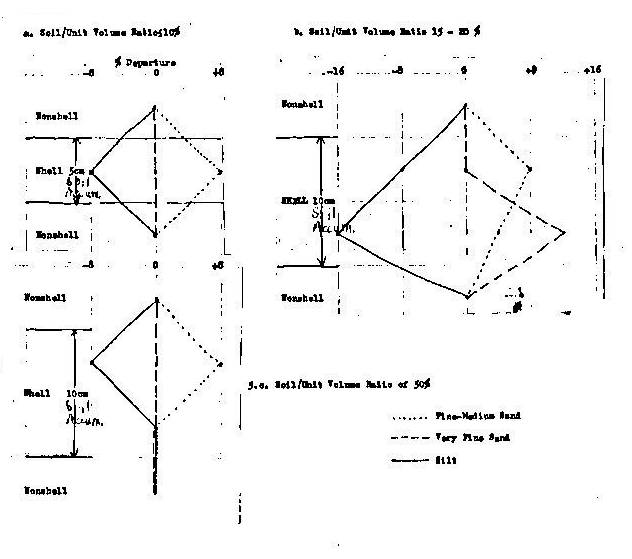
1) Quickly deposited, large shell horizons act as sand traps(an average increase of about 10%).(see section a.2)
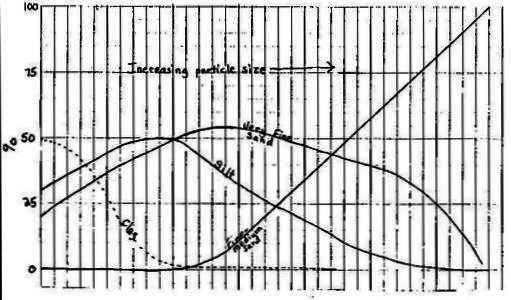
2) Fluctuations within a profile, not responding to shell sand traps are either (a) responding to aeolian site sorting(figure 4), or (b) a variable process that sorts out very fine sand with little or no inverse relationship of silt and fine-medium sand(changes in topography, parent material, etc).
3) The intensity of aeolian activity within a site affects the size and amount of particles being deposited, and a transfer function can be used to convert particle size to centimeters deposited per century(See section b.) If plowing of sandy loams was not consistent, and was performed during mild wind conditions, then they may return to their original bulk density and retain the same percentages of particle sizes.
5) The uppermost Al soil horizon (0 to 0.5 cm depth), consisting of an accumulation of more humified organic matter than mineral particles(resulting in many fine pores), my filter out dense particles (fine-medium sand). This is one reason why surface sampling was taken below the uppermost horizon.
6) Variability in the long term aeolian deposition process is greatest adjacent to large structures and increased slope(e.g.-large rock outcrops), and least at the center of a beach surrounded by a large open field. One profile taken from a low elevation bank(10-12 feet above sea level) shows poor response to aeolian size separation fluctuations, and strong response to increases or decreases of very fine sand(factor 2b), suggesting variations in parent material (e.g... beach sand vs bank particles).
7) An increase in particle site in the upper soil/midden profile is a result of recent exposure of the present bank.
8) Introduced soil particles, such as particles clinging to shells taken from the beach, appear to total far less than 10% of the total soil volume. Also, the type of shell(clam, mussel, or sea urchin) is not associated with any noticeable change in % or particle sizes.
9) Exposed surfaces such as during the pioneer stage over glacial till, or after a large area fire, increase aeolian activity and saltation, and thus promote increased deposition rates simultaneous with larger particle use deposition (see factor 3),
|
TAKEN AT 5 CM INTERVALS |
|
|
|
|
|
determined from Soil/Unit Volume Ratios |
|
At the earth's surface sand will settle quickly where a sand trap exists, such as between blades of grass, or an air gap between shell or rocks The results of profile sampling(figure 5) indicate an increase of about 8+-5 % fine- medium sand in the top 5 cm of soil accumulation in a shell horizon (inversely proportional to an 8±5 % absence of silt). • The results were consistent regardless of shell unit thickness or soil accumulation/total unit volume ratio. Soil/unit volume ratios >= 75% showed little or no change. Air gaps between rocks placed on a flat surface can accumulate a highly concentrated sand percentage on the surface between the rocks.
A serial cross correllation of field and midden horizon soil volumes compared to particle size separation (% clay, silt, very fine sand, fine-medium sand) suggests that the percent fine-medium sand minus the percent silt is roughly proportional to the amount deposited in time. Many profiles were examined over a large area at one site. The parent material consisted of sandy clay(glacial till) and sand(shell midden). Horizons of higher sand content were associated with a greater volume deposited, whereas silt indicated less volume deposited during the same time interval. Structures such as trees or houses would inhibit this process, where an extreme particle separation occurs. Also, if the parent material changed particle size, so would the aeolian size. If thee. variables were not significant, then particle size separation may be in response to amount deposited in time. The serial cross correllation at one site yielded a Transfer Function which converts aeolian particle size to centimeters deposited per century(figure ).
The formula may vary from site to site, depending on the immediate terrain, or may not be valid at others. At the test site, 5 profiles yielded an age estimate of 740 ±155 BC (2700 years ago) at the dark soil transition boundary in excellent agreement with a carbon 14 date. The transfer function was also applied to the underlying yellow brown soil which rests on glacial till or diamicton and the 5 profiles gave an setimats of 2460*200 BC (4500 years ago), in good agreement with Event #3 at about 4900 years ago.
Soil accumulation volume at most sites in the islands tend to separate out at 55 cm, 41 cm, and 33 cm. These are then associated with erosional intervals around 3000, 2100, and 1500 year. ago. Although there is good correllation in dating, extreme caution should be used until further verification of the aeolian deposition process is performed at these sites.
CONVERSION OF AEOLIAN PARTILE SIZE TO CM DEPOSITED PER CENTURY
TRANSFER FUNCTION AT ONE SITE:
I. Use: % Clay, Silt, Very Fine Sand, and Fine-Medium Sand.
II. If: X(% F-M Sand minus Silt) is between -10 and +50 Then: Cm deposited per century = X(x.0274+1.65
____If: X is between -50 and -10 Then: Cm deposited per century = X(x.0088 + 1.54)
III. Age of a given depth= Number of cm Accumulated depth divided by cm deposited per century (SD=10% of the estimated age before present).
----------------------------------------------------------------------------------------------------
                        Fine-Medium Sand minus Silt
                  -50       -25        0        25        50
          _ _______³_________³_________³_________³_________³
         ³                                                --
         ³                                             --/
       3-³                                          --/   --
         ³                                       --/   --/
CM       ³                                    --/   --/   --
         ³                                 --/   --/   --/
DEPOSITED³                              --/   --/   --/
       2-³                       ------/   --/   --/
PER      ³               -------/       --/   --/
         ³     ---------/        ------/    -/
CENTURY  ³----/          -------/         -/
         ³         -----/              --/
       1-³--------/            -------/
         ³               -----/
         ³         -----/
         ³--------/
         ³
       0 ³_________³_________³_________³_________³_________³
----------------------------------------------------------------------------
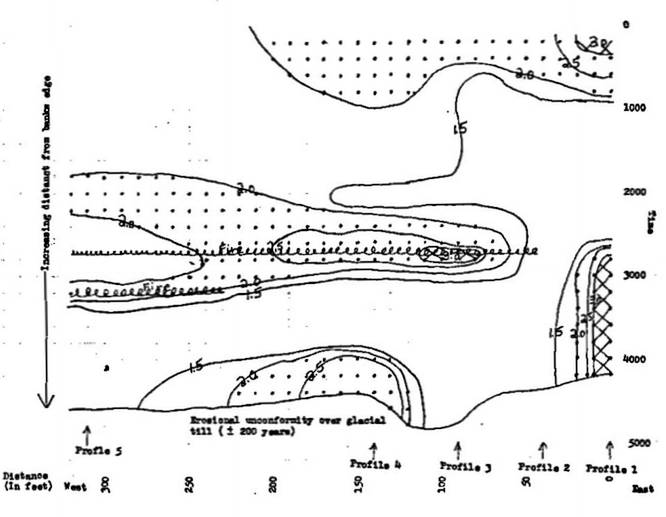
Composite of a 300 foot bank profile and the aeolian process which
has occurred. in the past 4500 years( after correction for shell midden sand traps and using the particle size transfer function). At one extreme is profile #1, located next to a large rook obtrusion, and at the other, the center of a large beach. Variability in aelolan deposition rates are highest at profile #1, and vary least at the center of the beach,
The bank as a whole reveals three major increased deposition periods: 1) Pioneer Stage just after the erosional unconformity over exposed glacial till, (2) Exposure due to a large area fire, and/or the severe climate transition about 3000 years ago, end (3) An increased deposition rate in the past 500 years possibly reflecting recent exposure of the present bank. Profile #1 shows a recent anomalous increase in particle size, either from the parent material deposited 3000-4000 years ago, or from a similar deposition process occurring adjacent to exposed rocks.
Prairie soils in the Pacific NW have 2-5% organic content, and were formed mainly under preennial tall-midgrass, with a mixed small shrub(e.g. rosebush), bracken fern, and some sedges, and a scattering at the prairie perimeter of Douglas Fir (Pseudotsuga Taxifolia) and Oregon White Oak (Quercus Garryana). Chernozem has the highest content of any soil (2-5 %), and was strictly formed under a perennial tall-midgrass environment. When a growth factor is considered, Chernozem grows strictly under grass, whereas Pacific Northwest Prairies formed under a mixed grass end small shrub environment, contributing different root systems and groundcover. In Western Washington there is only a small percentage of Prairie soils formed strictly under grass.
Humus is the remaining portion of organic matter in soil after plant and animal residues have decomposed. Humus formation is in "tune" with the grassland biosphere, which is responding to ecological stress and/or climate. Long term climatic changes occur through time, contributing various amounts of sunlight, temperature, precipitation, and ultimately, a response by plant growth through these changes. A severe, and/or long term climatic trend can easily cause a change in type vegetation and soil parameters.
The effect of the biorythm of the grasses determines the net increase or decrease in humus formation. The essential element of humus formation in prairie soils, end especially Continental Chernozems, is vitally controlled by optimum wetting conditions. A soil under optimum vetting conditions retains much of its natural liquid cementing agents, thereby retaining humus and promotes granular structure. With stronger vetting, root excretions and colloidal materiel become diluted by water. With lesser vetting the capacity of plants is inhibited end they suffer from drought. The dry, but humid, climate of Whidbey and the San Juan Islands La ideal for grassland soils, where heavy morning dews ‘persist throughout the summer.
Th. rhythm of humus formation is a continuous trend. In the early spring and summer, under optimum heat and moisture conditions, microorganisms mineralize part of the humus reserves (10 — -15 % of the total amount in the 0 to 8" layer) to syntheelse new plant growth. By the end of the growing period, when consumption of mineral nutrients decreases sharply, the products of photosynthesis, etc. flow back into the soil with root excretions. The annual cycle s in grasslands results in a very small, but detectable net increase in the humus under positive conditions.
The formation of humus is still open to debate. It is generally assumed that organic material added to a moist end warm soil will decompose through attack by a host of different soil organisms, and thus promote humus formation. Some believe that humus content is more controlled by excretions in roots.
In the case of organic litter, two major kinds of organic compounds remain after decomposition: (a) resident compounds of higher plant origin, such as oils, fats, waxes,and especially lignen; and (b) new compounds, such as polysaccharides and polyuronides, which are synthesized by mocroorganisms and help as part of their tissue. Lignen is at least partially oxidized during decom position. The humic substances derived from this humus allow for reaction. which permit Nitrogen to become incorporated in the humus. The reaction products of Nitrogen are amino combinations. The newly formed humus is quite resistant to further microbial attack, end is protected from further solubility and dissipation. Thus, the humus profile, while being added to, is accretign at a rate which conforms to climate, vegetation cover, and soil nutrients and soil structure already present.
The humus content of Chernozem, and quite possibly all grassland soils, may be derived more from root excretions than root carbon (decayed roots) or organic matter(litter). In a study of the seasonal dynamics of a typical Chernozem, Gertsyk(1959, in Ponomareva 1974 Soviet Soil Science) found that the "humus content of virgin Chernozem varies regularly during the growing season" it decreases by midsummer and increases in fall. It is interesting that while the humus content decreases the steppe mat or litter also decreaees sharply so that the increase in humus content in the second half of the summer to approximately the spring level cannot be related to the decomposition of the litter and its conversion to humus."
The release into the soil of organic and mineral substances by plant roots increases after plants flower and continues until the end of the growing neason. Root excretions consist of organic acids, amino acids, sugars, enzymes, vitamin., etc. These, and along with organic litter, mineralize rhythmically in warm weather in close harmony with the rhythm of the grasses.
The paleoclimate record is best preserved in vegetation response to climate as recorded in pollen percentages from lake and bog cores. From these pollen records, the ratio (or transfer function) of hemlock( T. Heterophylla) to Pine (P. Contorta) is an excellent indicator of precipitation(figure 8d). Temperature (figure 8c) at coastal sites can be derived from a transfer function of grass to hemlock and pine, while in the Willamette-Puget-E. Vancouver Island. trough it can be derived from the Oak(Quercus Garryana) — Pine (P. Contorta) ratio or Oak -all conifer ratio, and east of the Cascades a Pinus Contorta ratio is used. Due to variable sedimentation rates and poor climate response vs ecological stress at many sites, of 45 pollen cores, only 11 were able to be cross dated by absolute dating(carbon 14 dates and the Mazama Ash horizon) and/or climate response cross correllation.
The geoarchaeological record of river flooding and shoreline site dating reveals that 5 major events have occurred since Mazama Ash(7800 solar calendar yeaze ago), and correllated with increased precipitation and/or lake sedimentation rates. Only two sites in the San Juan Islands have soil over glacial till or beach gravels which can be dated to about 4000-5000 years ago, while most of the other sites appear to be no more than 3000 years old, or have a soil type transition about that time.
~1500 AD - Mud Flow (Ozette, Olympic Coast)
~1000 AD - Severe flooding(Possibly Skagit River)
~ 450 AD - Severe flooding(Fraser, Duwamish, and possibly Skagit River)
         - Severe shoreline erosion(4 sites San Juan Islands)
~ 200 BC - Severe shoreline erosion(6 sites San Juan Islands)
~ 850 BC - Severe flooding(Fraser, Skagit, possibly N. Olympic Penninsula (Hoke River),
                and King County (Marymoor Site])
         - Severe shoreline erosion(14 sites San Juan and Whidbey Islands)
~3000 BC - Severe flooding(Fraser River and possibly King County [Marymoor Site])
         - Possible higher sea level than present (5-15 feet). Sites resting on beach
               gravels or glacial till or outwash dated 4600-4900 years(SW Vancouver
               Island, East Vancouver Island(Comox area), Whatcom county(2 sites), and
               San Juan Islands(2 sites]) Also, approximate dating for sea level at
               San Francisco and Japan.
~4500 BC - Oldest shoreline site resting on glacial till or outwash(Helen Point)
         - Severe flooding (approximate dating of Willamette River?)
~5700 BC - MAZAMA ASH
Prairie soils and archaeological sites on Whidbey and the San Juan Islands were examined during the years 1980-1984. Notes were taken on soil accumulation within midden and soil profiles. The soil accumulation process has already been discussed, and the inferred dating of archaeological sites is here presented.
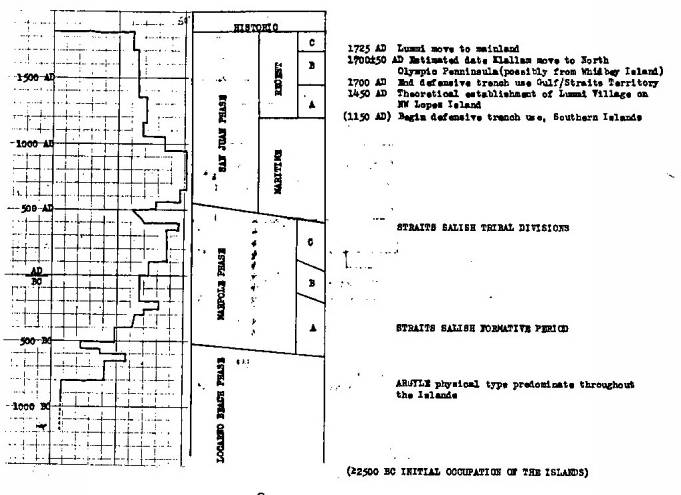
Figure 9 gives the composite area stratigraphies, and figure 10 gives the composite San Juan Islands stratigraphy as a whole. If shell density can indeed be used as an indicator of thø number of people present, then a gradual increase in populaton size is noted from about 3000 to 2000 years ago, with peak use of the islands between 500 and 1000 AD. Otherwise shell density may indicate changes in human diet preference or the clam population adjusting to ecological stress (changes in beach sediment or overdigging by the local Inhabitants). Erosion has destroyed many sites that were once closer to the older shoreline.
The dating of the surveyed sites is quite consistent with the regional
sequence. The past 5000 years is divided into four major phases, associated with technological, stylistic, end form changes of recovered artifacts. The oldest human occupation site is located on SE Lopez Island, and dates to about 4000—5000 years ago. The recovered artifacts are associated with the regional Mayne/St Mungo Phase(ca 3500 to 6000 years ago). About six sites date to the Locarno Beach Phase (ca 550 BC to 1200 BC). The Marple and San Juan Phases have been intensively studied, and date to 550 BC to 500 AD, and 500 AD to historic times, respectively. Locally, the San Juan Phase can be further divided into two periods: Maritime Component(500 to 1200 AD) and Recent Component(1200 AD to historic times).
|
IN THE SAN JUAN ISLANDS Shell density means are proportially adjusted for missing older components at some sites (due to erosional uncomformities). |
|