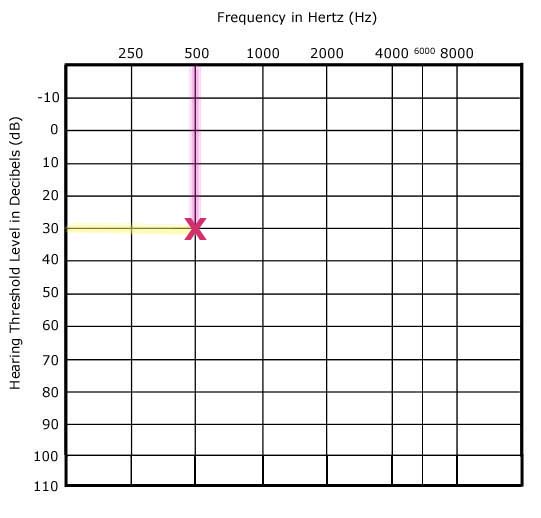
Symbols are plotted on the audiogram by finding the intersection point for
- the frequency of the tone presented, and
- the loudness level at which the tone was presented.
For instance, here is where you would plot a 500 Hz tone presented at 30 dB.