The decoherence effect explains how a superposition of states becomes a mixed state. It is my understanding that this is not in any serious doubt by the establishment - decoherence happens and explains why we do not see superpositions of macroscopic objects like Schrodinger's cat. It does not solve the measurement problem, however.
In this paper, I present an example that I claim shows decoherence using only wave functions. (No other concepts like the density matrix are required.) It is my hope that this example can be understood at the level of a student taking quantum mechanics for the first time (typically junior year in a university physics curriculum).
This example is inspired by section 7.3 of Roland Omnes's The Interpretation of Quantum Mechanics.
Consider the very popular harmonic oscillator (HO). The wave functions for the lowest 3 energy states are shown in figures 1 - 3.
These states are stationary in time. A superposition of these states will have some time dependence. Figure 4 shows the superposition of the ground state and the first excited state, and shows its time dependence by animating the wave function. (This graph should move - if it doesn't, something is wrong.)
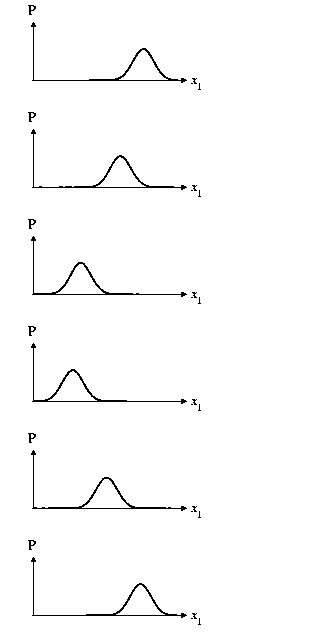
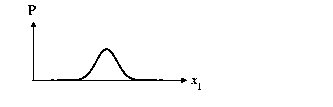
A particularly interesting state is the coherent state shown in figure 5. This wave function is a gaussian that moves without changing shape. We will use this particular HO wave function for the demonstration. Please note that the word ``coherent'' here has nothing to do with the decoherence that will be demonstrated. ``Coherent state'' is simply a common name used for this type of state. The demonstration can, in principle, be done with any state. It is just most vivid using a coherent state.
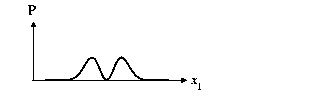
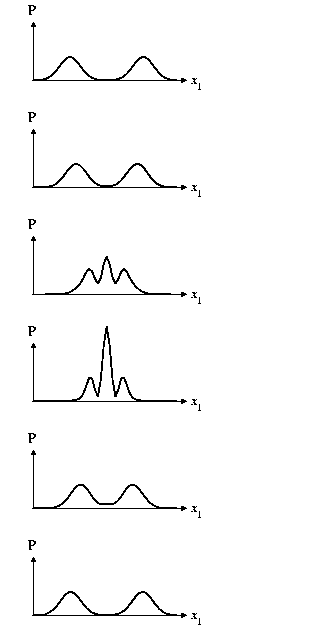
I first need to explain just what we seek to demonstrate. We want to show the difference between a superposition of states and a mixed state. I claim that the difference is that superpositions will show interference but mixed states will not. Figure 6 shows a superposition of states; this is a superposition of two coherent states, and when the gaussian peaks are near to each other, they show a clear interference pattern.
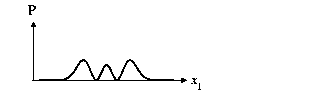
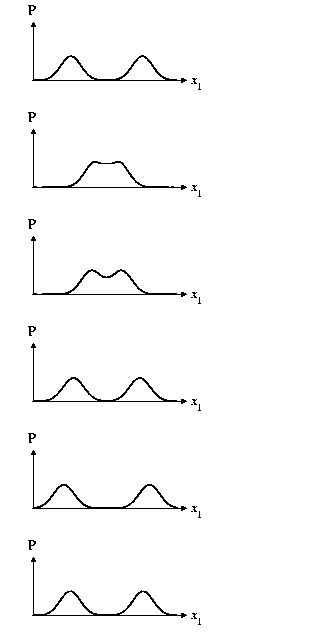
Figure 7 shows a mixed state of the same two original coherent states. When these gaussian peaks are near to each other, they show no interference.
1. What is the difference? The superposition is constructed by adding the amplitudes of the original coherent states, then squaring it to get the probabiltiy. The mixed state is constructed by squaring each original coherent state first, then adding the probabilities.
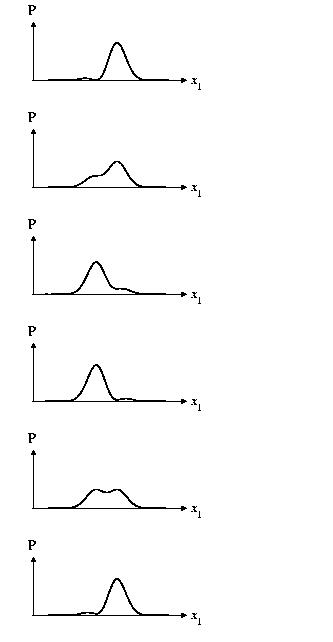
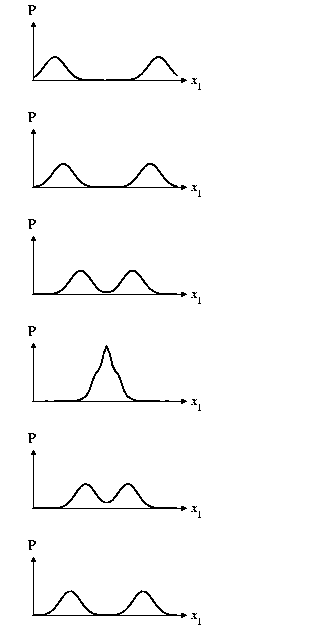
2. How do real-world states go from superpositions to mixed states? This is the question that decoherence answers. What we are looking for is a process that does what is shown in figure 8 - as time goes by, the interference pattern gradually decreases and eventually becomes undetectable.
The answer is that single particle wave functions do not remain single particle wave functions for long in the real world. They interact with other particles and become multi-particle wave functions. So, to describe a single particle accurately, we really have to describe all the particles it appreciably interacts with. As Omnes (and Zeh and Joos) shows in his book, single particles interact with other ``environmental'' particles very quickly. For even a large molecule in a laboratory-grade vacuum, decoherence will happen in about 10^-17 seconds, far too quickly to measure.
To demonstrate this, I am going to let our single particle interact with another single particle (also a harmonic oscillator). Thus, the ``environment'' is another particle. Even this simple model will show the effect.
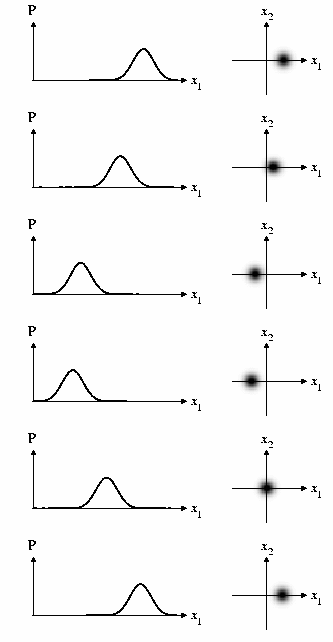
Figure 9 shows the probability density P for the two particle system on the right and P for the single original particle on the left. This figure shows the second particle in its ground state, not interacting at all with the first particle. In this situation, the wave functions separate and we can model the first particle as an isolated, single particle. It is correct to ignore the second particle.
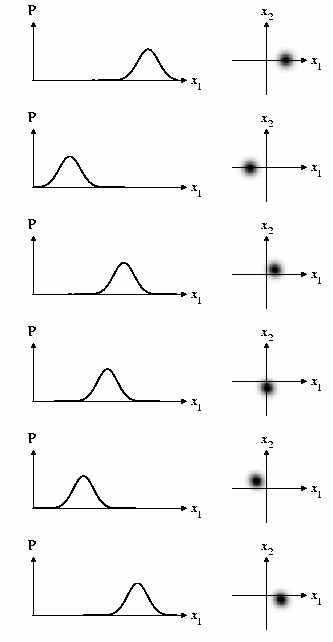
But, if there is any interaction between the particles, the wave function no longer separates, and we must use the two-particle wave functions to describe the system. This is shown in figure 10. The peak of this two-particle wave function wanders around in a 2D space.
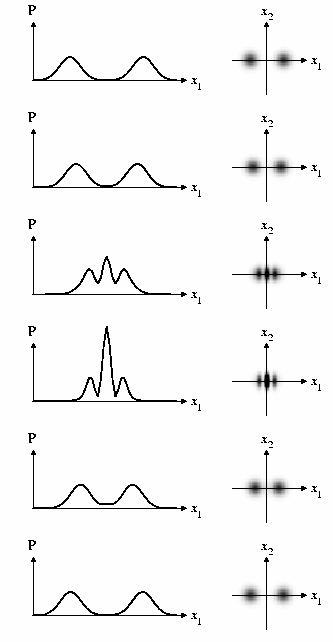
Now, what happens if we set up particle 1 in a superposition with two gaussian peaks? If particle 2 is in its ground state and does not interact with particle 1, we have the situation of figure 11. There are now two peaks in both the 2D space and in the 1D space. The peaks overlap and interfere.
(Note that the two peaks do not represent the two particles. One peak is sufficient to represent both particles, as in figure 9. The two peaks represent a superposition.)
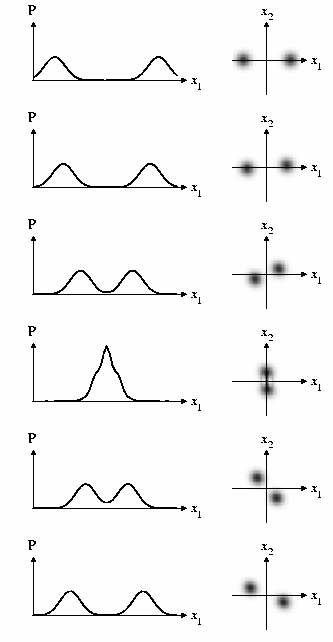
Now, prepare the system such that the first particle is in the superposition of coherent states as in figure 6, the second particle is in its ground state, and the particles interact. The result is decoherence and it is shown in figure 12. If you understand this picture, you understand all that I know about decoherence.
At first, the two peaks of the superposition overlap in 2D space and there is interference. But as the peaks wander around the 2D plane, they overlap less and less, and there is less interference. This is true even though the peaks overlap when projected onto the first particle's axis. As seen from the viewpoint of particle 1 only, its peaks seem to overlap but not interfere. Thus, particle 1 can be treated as being in a 1D mixed state.
Note that the correct, full wave function is not mixed; it is a regular wave function like we learned to manipulate in our first quantum mechanics class. It is only if we don't know about the second particle, and we insist on modeling the particle as a single 1D particle, that we must model it as a mixed state.