Update to Warren
Elementary Transfer Study
Effects of
on ISTEP+ Passing Rates in Affected Schools
December 17, 2003
The original
study, published in February, 2002, contained
ISTEP+ data for the first two years after
Figure 1 below updates one of the methods used in the
original study to include ISTEP+ results from testing in September, 2002 and
September, 2003. These were the third
and fourth year after the
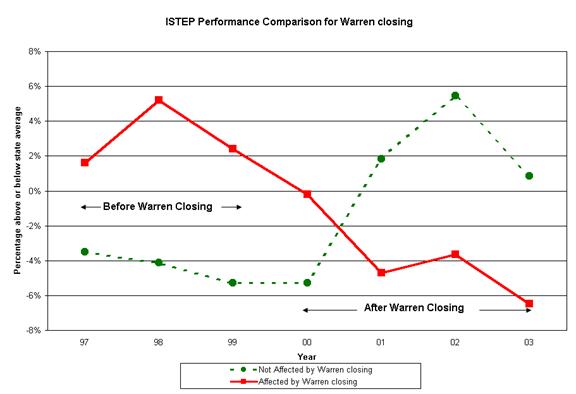
Figure 1. ISTEP+ Performance Comparison for Warren Closing
The solid line on the graph represents the percentage of
students passing ISTEP+ at the four schools affected by the closing. (For this analysis, passing rate was defined
as the percentage of students who passed both portions of the test.) For 1999 and prior years, data from
The dashed line on the graph represents the performance of
all the remaining elementary schools in
Percentages were normalized to the state average each year. For example, in 1998, students at the four schools (Warren, Meadows, Lost Creek, and Sugar Grove) had an ISTEP+ passing rate that was about five percent above state average, while students at the remaining Vigo County Schools had a passing rate that was about four percent below state average.
The recent results show a continuation of the trend seen in the original report. In the three years prior to the closing, students at the affected schools had a passing rate that varied from five percent to nine percent above the other county elementary schools. In these years, students at the affected schools exceeded the state average passing rate by two to five percent.
In the four years following the closing, students at the affected schools have trailed the state average passing rate each year. Furthermore, the trend has been for the difference to increase nearly every year, from 0.2 percent below state average in 2000 to 6.5 percent below state average in 2003.
Just as compelling is the comparison to the other elementary
schools in
The schools affected by the closing have lost ground to the
remaining schools nearly every year since the closing. In 2002, they trailed by 9.0 percent and in
2003 by 7.4 percent. (Note that there
was a testing error in 2003 at Hoosier Prairie Elementary, one of the other
county schools. As a result, an
undetermined number of students there did not pass the mathematics portion of
ISTEP. So the data likely understate the
gap between the
One of the major points of the original study was that these
results were not unique to Warren Elementary or
These data were not sufficiently persuasive to the school
board and the Crawford closing occurred as planned. Students were transferred to Farrington
Grove, Sugar Grove, Ouabache, and
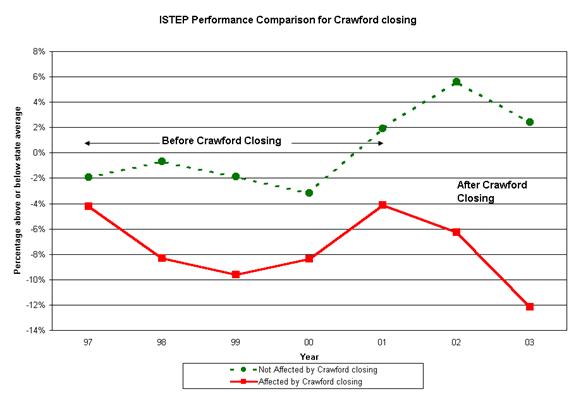
Figure 2. ISTEP+ Performance Comparison for Crawford Closing
The results are very similar to those seen in the
Figure 3 shows combined data for all the schools affected by
either or both of the closings. These
were Crawford,
In conclusion, consider the following words spoken by Georgia Mell, one of the co-authors of the original study, as she concluded a statement during the public comment at the Vigo County School Board meeting of February 25, 2002: “I am asking this board to reconsider its decision to close Crawford before more children lose the opportunity to receive their education in the environment that best suits their needs.”
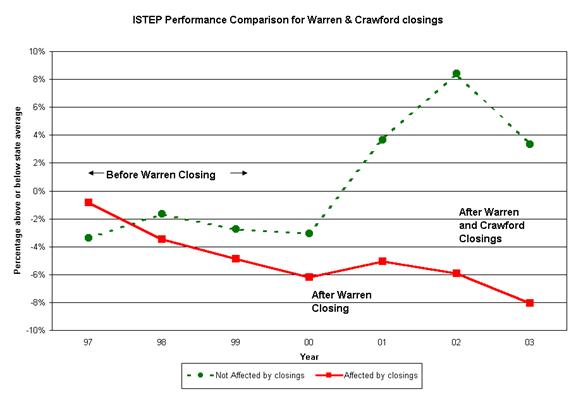
Figure 3. ISTEP+ Performance Comparison for Warren and Crawford Closings