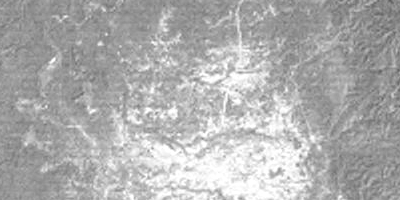
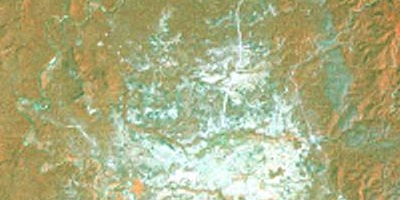
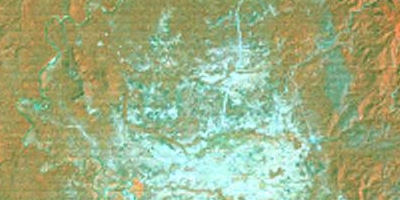
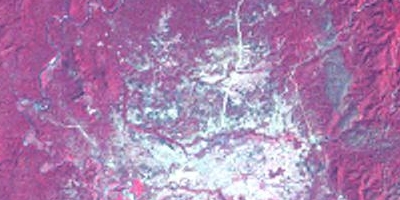
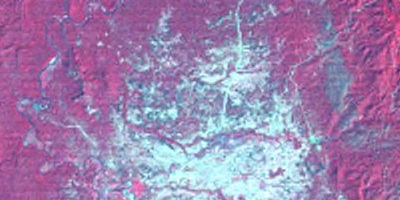
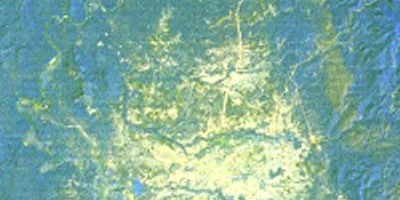
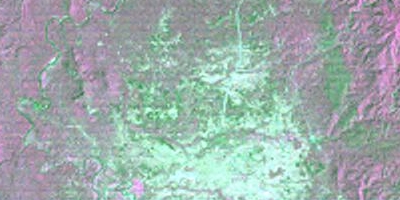
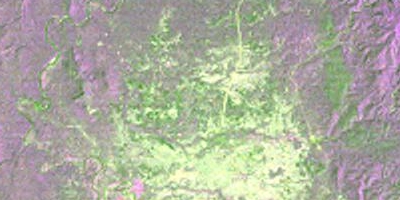
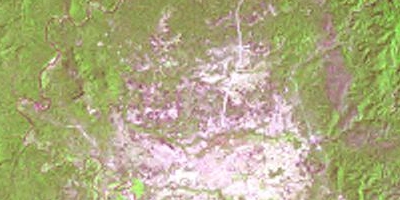
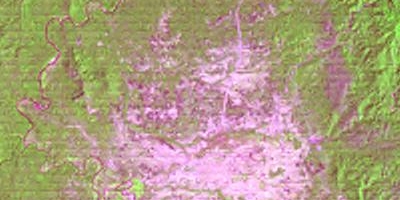
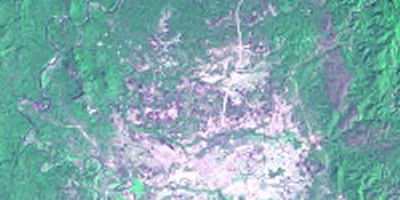
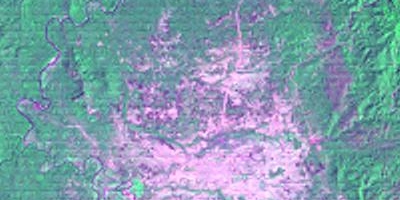
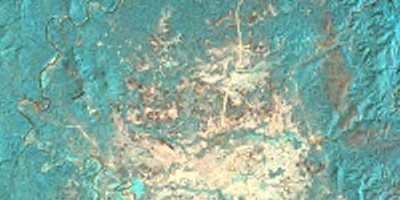
Band 1 . 0.5-0.6 . green
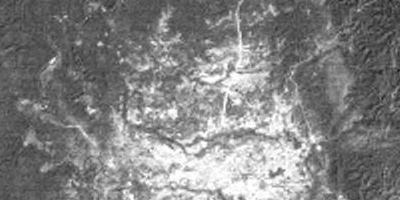
Band 2 . 0.6-0.7 . red
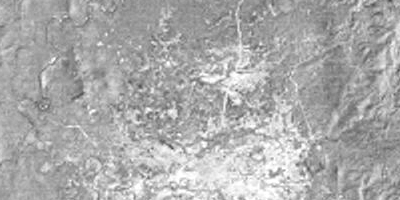
Band 3 . 0.7-0.8 . red - near-IR
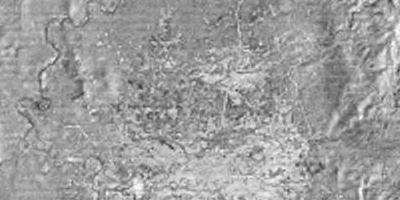
Band 4 . 0.8-1.0 .near-IR
Satellite Exploration of Thailand > General
|
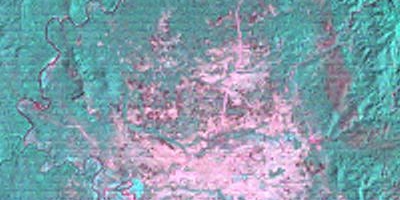
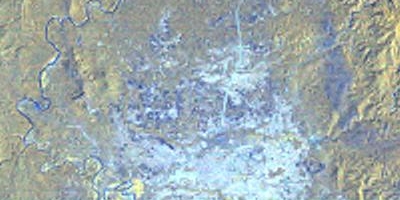
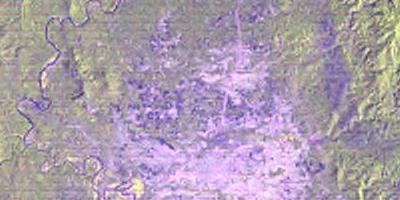
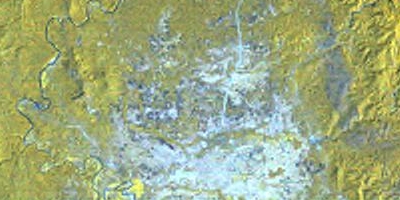
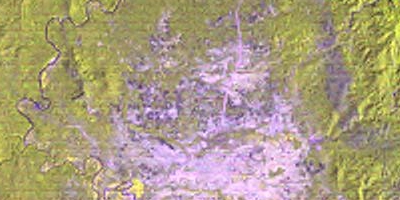
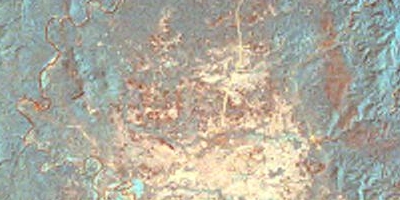
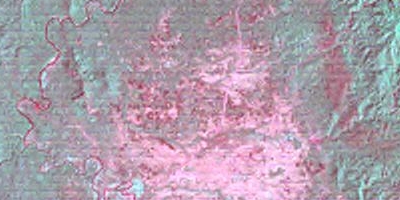
| Band Images | |
|
Band 1 . 0.5-0.6 . green |
Band 2 . 0.6-0.7 . red |
|
Band 3 . 0.7-0.8 . red - near-IR |
Band 4 . 0.8-1.0 .near-IR |
| Road Contrast - Good | |
 312 |
 412 |
 321 |
 421 |
 324 |
 423 |
 123 |
 124 |
 213 |
 214 |
| Road Contrast - Fair | |
 413 |
 314 |
 132 |
 142 |
 231 |
 241 |
 234 |
 243 |
| Road Contrast - Poor | |
 431 |
 341 |
 432 |
 342 |
 134 |
 143 |