Some have said our energy future belongs to wind and solar. If so, what growth will we demand of wind and solar? And how does that demand compare to the historic demand placed on fossil fuels?
Intro
The genesis of this thought experiment was in GliderGuider's excellent post and the lively discussion that followed. Part of that discussion centered around the question of how much and how fast can wind/solar grow? I began to wonder if we were asking the wrong question. Perhaps the better question is how much would we "need" wind/solar to grow to continue in our plush suburban lifestyles? What about China and India? They are rapidly industrializing and certainly their citizens would like to join the happy motoring lifestyle. How would their energy needs shape future demand on wind and solar?
To answer these questions I first estimated future energy needs out to 2050 with respect to very modest per capita energy growth. I then used GG's model as a baseline for all non-wind/solar energy growth, peak, and decline. If energy growth is to be met in 2050 the rest would come from wind/solar.
Next I wanted to compare the historic growth rate of various energy sources with the growth rate we would be demanding from wind/solar. This should give us a rough idea of how realistic our projected wind/solar growth is. For a larger perspective I also compared future wind/solar growth to the combined growth of all fossil fuels.
Finally I looked at two more growth scenarios and their demand on wind/solar compared to historic fossil fuel growth.
Note: This is not predictive in any way.
Data Sources
Historic data pre-1965 for oil, natural gas and coal were obtained from Romer, R. H. (1985). Energy Facts and Figures. All post 1965 data was lifted from GG's work here. Post-2006 data except for wind and solar is from GG's model.
Baseline
Before we can see how much wind/solar will need to grow in the future I needed a baseline of all energy sources not including wind/solar. The results can be seen in Figure 1.
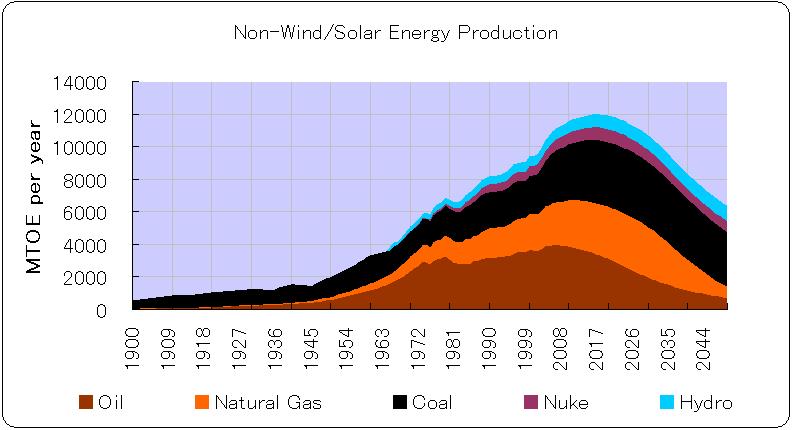
Figure 1: All Non-Solar/Wind Energy Production, 1900 to 2050
Without wind/solar world energy production quickly reaches a peak in 2017 at 12030 MTOE (million tons of oil equivalent) per year. If world energy production is going to climb past 2017 wind/solar will provide it.
Energy in 2050
How much energy will the world require in 2050? To answer this question I looked for world per capita energy data. This site shows the IEA World Energy outlook 2006. The world is currently at 1.69 TOE (ton of oil equivalent) per capita per year. For comparison the US has a per capita energy usage of 7.9 TOE per year, Europe clocks in at 3.8 and the Japan is currently at 4.17 TOE per person per year. The IEA predicts world per capita energy usage at 2.1 TOE/person/year in 2030. I decided to be conservative in my experiment and used a value of 2.0 for 2050. A per capita energy usage of 2.0 in 2050 is consistent with continued growth in total energy of 1.2% a year. Obviously a higher per capita figure would put even more demand on wind/solar.
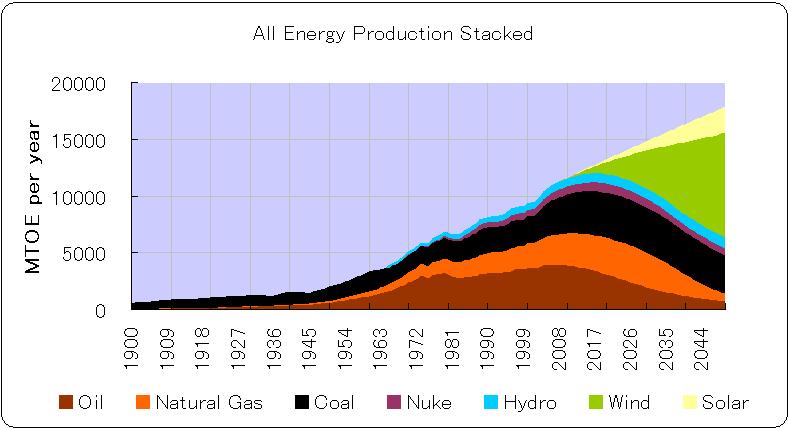
With world population projected at nearly 9 billion in 2050, a per capita energy usage of 2.0 TOE would require nearly 18,000 MTOE. Unfortunately non-wind/solar energy in our baseline model will have declined to 6,500 MTOE in 2050. The difference, 11,500 MTOE will have to be made up from wind/solar.
Figure 2: All Energy Production, 1900 to 2050
Growth in Wind/Solar
From 2006 to 2050 wind will have to grow from 37 to 9,222 MTOE. Solar will have to grow from 3 to 2,305 MTOE. For this experiment I am assuming wind and solar will keep the 4:1 ratio they show in 2006.
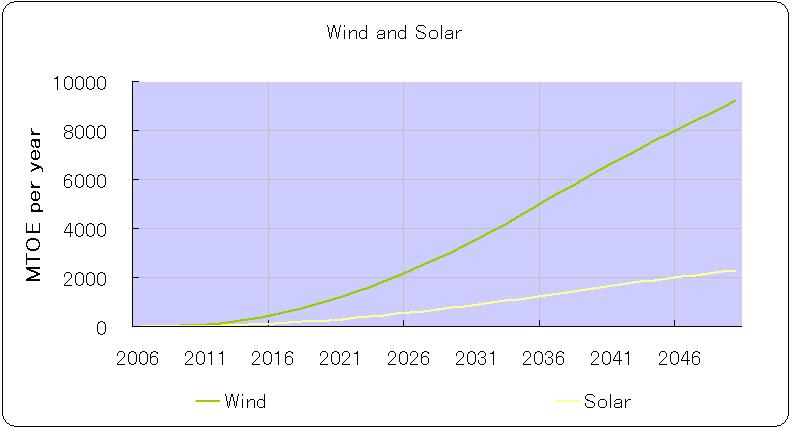
Figure 3: Wind and Solar, 2006 to 2050
Historic Comparisons
The next step is to compare the future growth of wind/solar with the historic growth of various energy sources. First up: Oil.
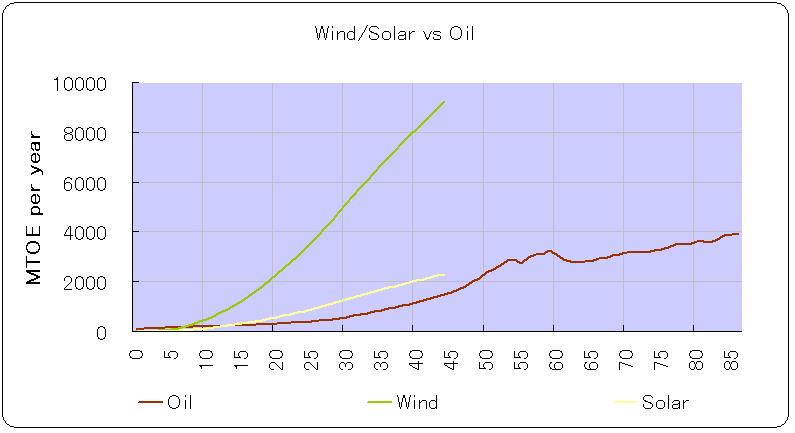
Figure 4: Wind and Solar, 2006 to 2050 vs Oil, 1920 to 2006
Figure 4 shows the growth of wind/solar from 2006 and oil from 1920. Oil grew from 96 MTOE in 1920 to 3,914 MTOE in 2006. You can see it takes oil twice as long to get to one third the level that we will need of wind and solar combined. How does Natural Gas compare?
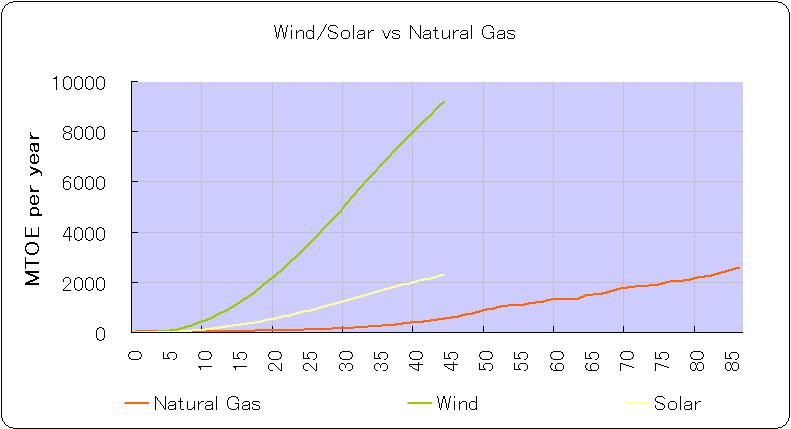
Figure 5: Wind and Solar, 2006 to 2050 vs Natural Gas, 1920 to 2006
Figure 5 shows the historic growth of natural gas from 1920 compared to the future needed growth of wind/solar. You can see the growth of natural gas was much smoother than oil but it still doesn't come close to what we'll demand of wind/solar. Natural gas grew from 22 MTOE in 1920 to 2,575 MTOE in 2006.
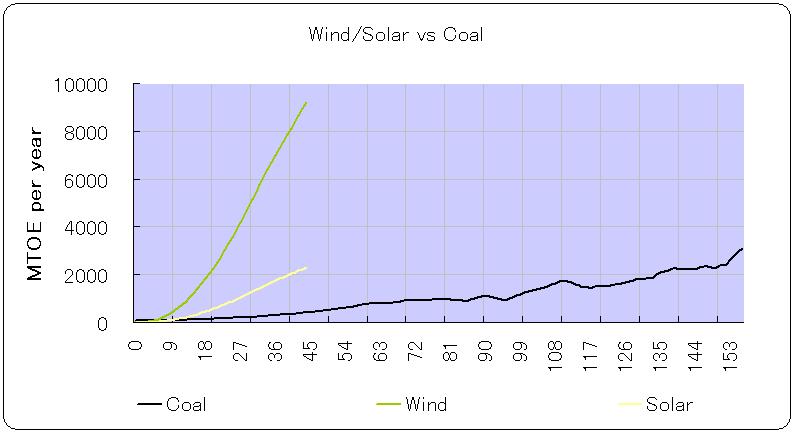
Figure 6: Wind and Solar, 2006 to 2050 vs Coal, 1850 to 2006
Figure 6 shows the historic growth of Coal from 1850 compared to the future needed growth of wind/solar. Compared to oil or NG, coal has a much longer history. It is interesting to note that coal usage has accelerated in the recent years. Coal grew from 71 MTOE in 1850 to 3,090 MTOE in 2006.
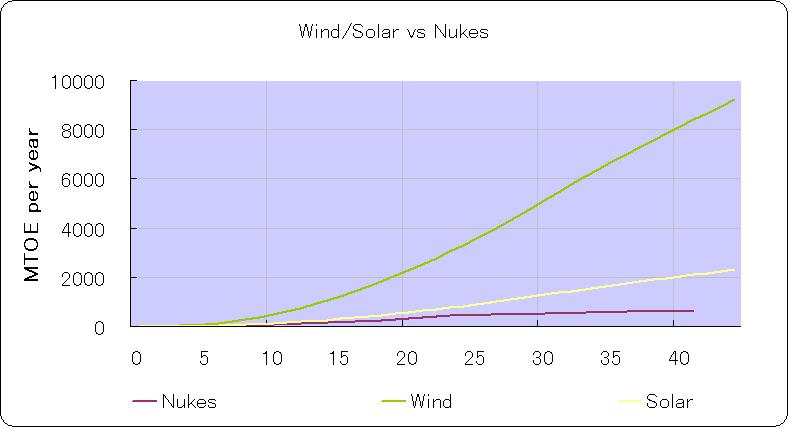
Figure 7: Wind and Solar, 2006 to 2050 vs Nuclear, 1965 to 2006
Figure 7 shows the historic growth of Nuclear from 1965 compared to the future needed growth of wind/solar.
Nuclear energy has a much shorter history than any of the fossil fuels. Unfortunately nukes have never risen much over 600 MTOE. Solar and wind will have to get to over 11,500 MTOE in a similar length of time.
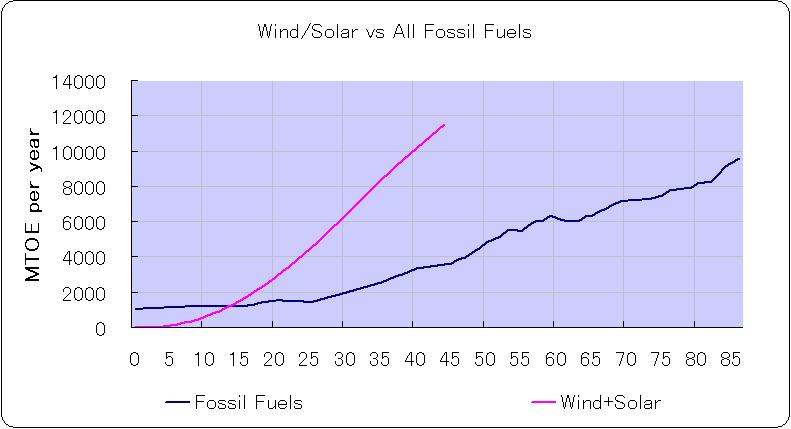
Figure 8: Wind and Solar, 2006 to 2050 vs All Fossil Fuels, 1920 to 2006
Finally Figure 8 shows the historic growth of all fossil fuels from 1920 compared to the future needed growth of wind/solar. All fossil fuels grew from about 1,000 MTOE in 1920 to 9,500 MTOE in 2006. A span of 86 years. Wind/solar will have to top that growth by 3,000 MTOE in a span of half that time. If wind/solar grow at the same rate as fossil fuels have historically then by 2050 wind/solar will only reach 4,439 MTOE.
Two More Scenarios
The above analysis linearly extrapolates per capita energy usage from 1.69 in 2006 to 2.0 in 2050. This approach is extremely cautious and results in a lower per capita in 2030 than what the IEA predicts. In this case 2.1 TOE/person for the IEA versus 1.84 TOE per person in the above analysis.
If you extend a straight line from 1.69 in 2006 and 2.1 in 2030 the per capita in 2050 will be 2.4. This is referred to the 2.4 scenario. Additionally I created a 3.0 scenario that results in a per capita value of 3.0 TOE/person in 2050. The 3.0 scenario has a value of 2.38 TOE/person in 2030 or about as high above the IEA prediction as the 2.0 scenario is below.
The 2.4 scenario has total energy demand at just under 22,000 MTOE in 2050. Under this scenario wind/solar demand will top 15,500 MTOE or 4,000 MTOE more than the above 2.0 scenario. The 3.0 scenario is even larger with total energy demand 27,000 MTOE demanding 20,500 MTOE from wind and solar in 2050. This scenario exceeds the 2.0 scenario by 9,000 MTOE.
All three growth scenarios are shown in Figure 9. It depicts wind/solar growth from 2006 to 2050 for each growth scenario. For comparison historic fossil fuel growth from 1920 to 2006 is included. As you can imagine the higher growths rates result in much higher demand for wind/solar by 2050, completely dwarfing historic fossil fuel growth.
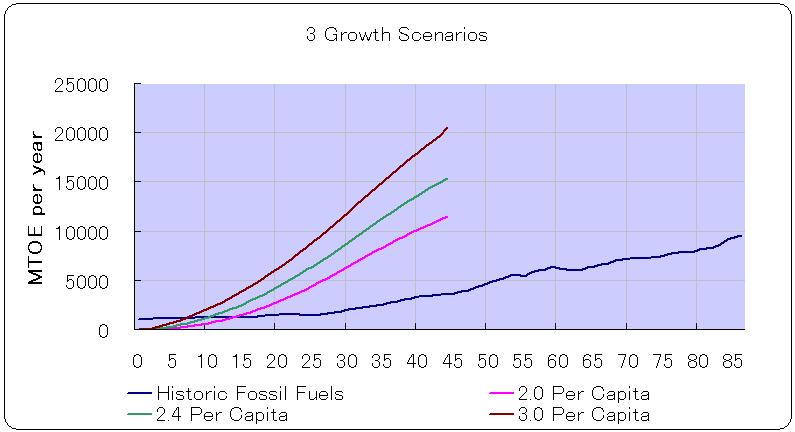
Figure 9: Three Growth Scenarios, 2006 to 2050 and Historic Fossil Fuel Growth, 1920 to 2006
Final Thoughts
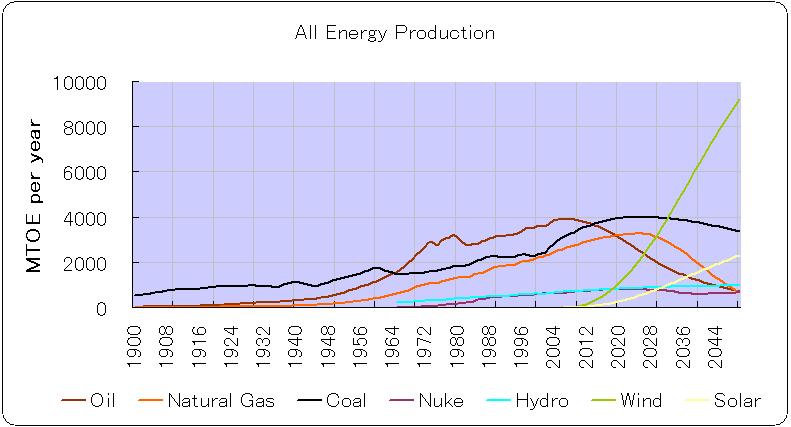
Figure 10: All Energy Production, 1900 to 2050
Many factors are outside the range of this small model. Oil production may decline at a much more rapid rate than modeled. Coal reserves might be more limited or coal fungibility much smaller than expected. Perhaps nuclear will undergo a renaissance and make a significant contribution to energy demand. It is possible that a future electric economy will be so efficient that no per capita energy growth will be needed at all (although even this scenario demands 8,738 MTOE from wind/solar in 2050).
The point of this hyperthetical model is to see what demands continuing our present happy motoring lifestyles will place on wind/solar in the future. If the world continues along its present development path it seems the demands we will be making of wind/solar will be very very large and historically unprecedented. The historic growth of any source of energy, singularly or combined, doesn't even come close to the growth rates we will need. For example, even with the conservative growth scenario 2.0, we'll demand wind/solar to grow nearly three times as high and in one half the time as oil historically has.
Additionally the historic growth of any one energy source has always been supplemental to the energy sources that preceded it. The demands on wind/solar will come during a period where all other sources of energy in aggregate are declining at a significant rate. Additional hurdles remain in transitioning our transportation system, economy, and society off of liquid fuels and onto a new electricity driven form.
Perhaps its time we put a rest to the notation that continued world energy growth can come on the backs of wind and solar. To steal a simile, if building our fossil fuel economy is like putting a man on the moon, building a post fossil fuel electric economy will be like putting a colony on Pluto.