12/08/04
EURUSD at 6:36am
trades 1.3261 x 64. On a 10-minute price chart, there is a downtrend in
process. Prior to the entry there was sideways consolidation. Over the last 5
periods notice the stochastic is high and turning over, and RSI is also falling
and below its Moving Averages (3MA, 7MA, 10MA, and the green 22MA)
06:36 am
Trade entered - - SELL EURUSD 1.3261
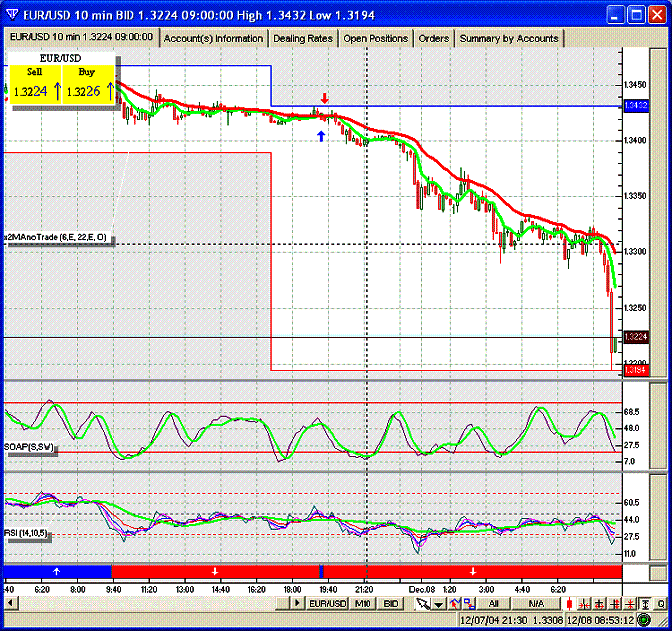
At 6:50 price
drops to 1:3193
Stochastic reading is low and RSI has a sharp upturn. The GBPUSD
(not pictured), was turning up and I decided to close
06:50 am
Trade entered - - BUY EURUSD 1.3212
Trade profit is 52 pips (standard account: 1lot - $520,
2lots - $1,040, 3lots - $1,560, etc, etc)
Here, on the same trade, look at the 4XME charts at the end
of the trade:
This is at 6:46 am

At 06:50 the
downtrend closes up as you can see on the next image

The convergence on the above chart tells me to take a nice
profit now, or sell half the position and move my stops to protect a trade profit
on the other half.