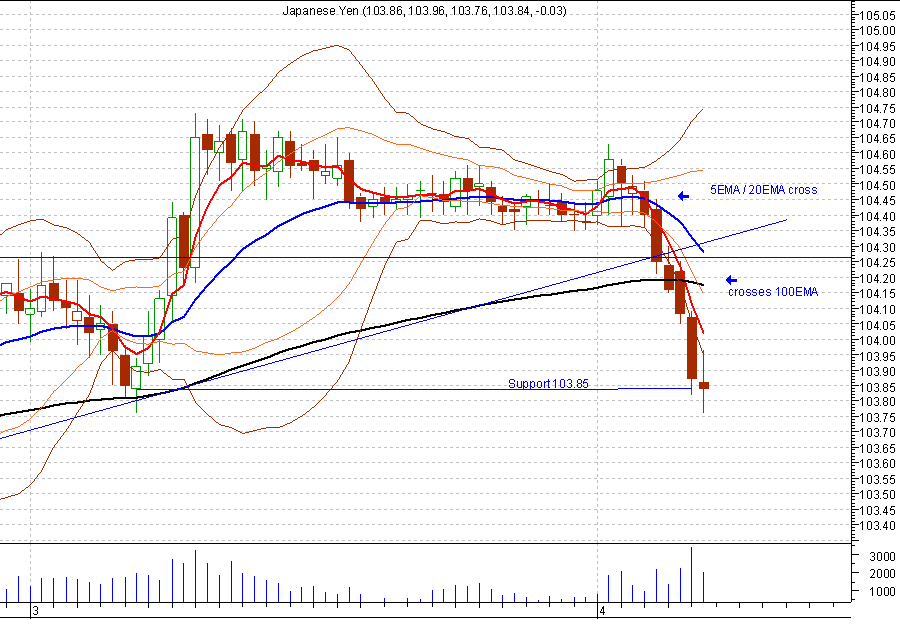
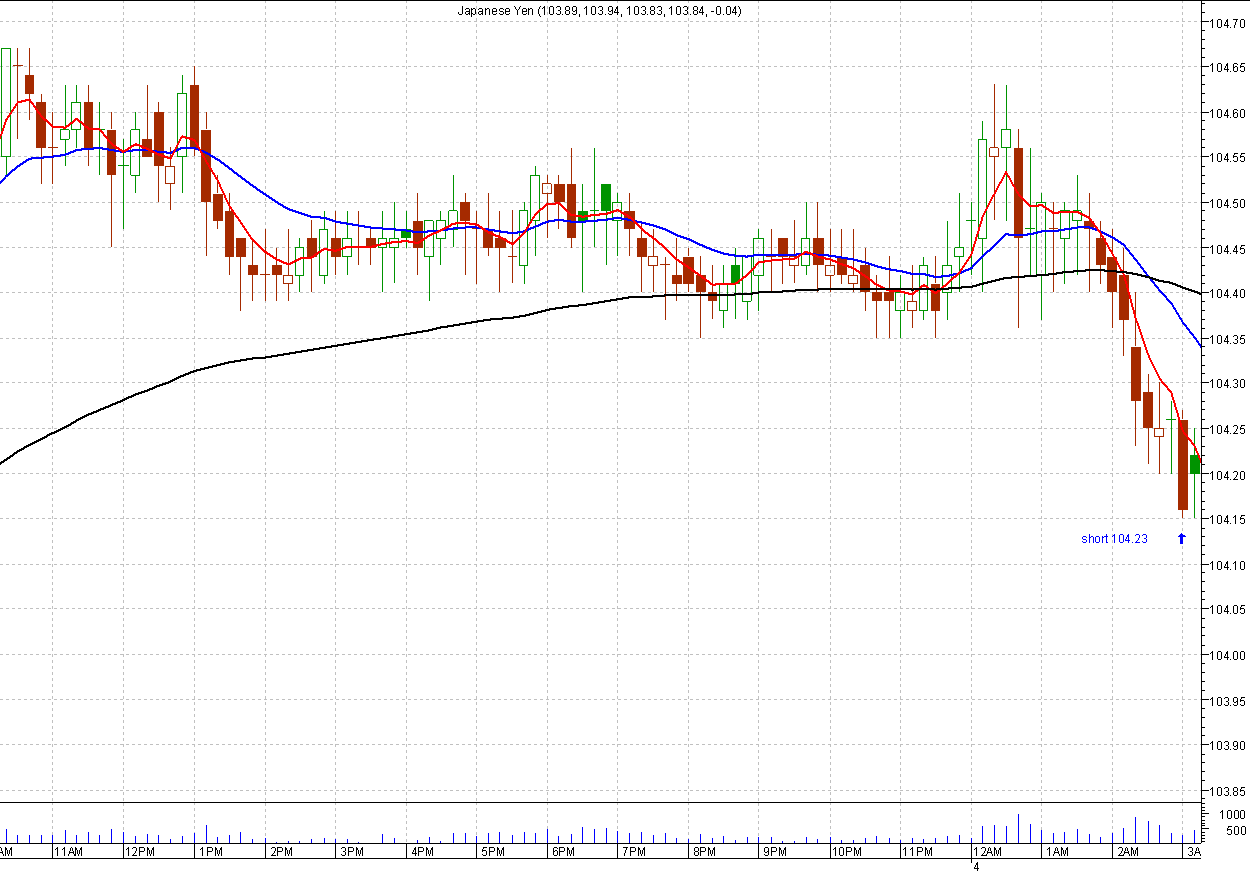
About 2:30am MST, the 20EMA crosses the 5EMA. Soon price crosses the 100EMA. With support at 103.85 and price near 104.30, there is ample room for pip movement to the downside The 10' chart below shows a little bounce up, staying below the 5EMA. Enter short at that point.
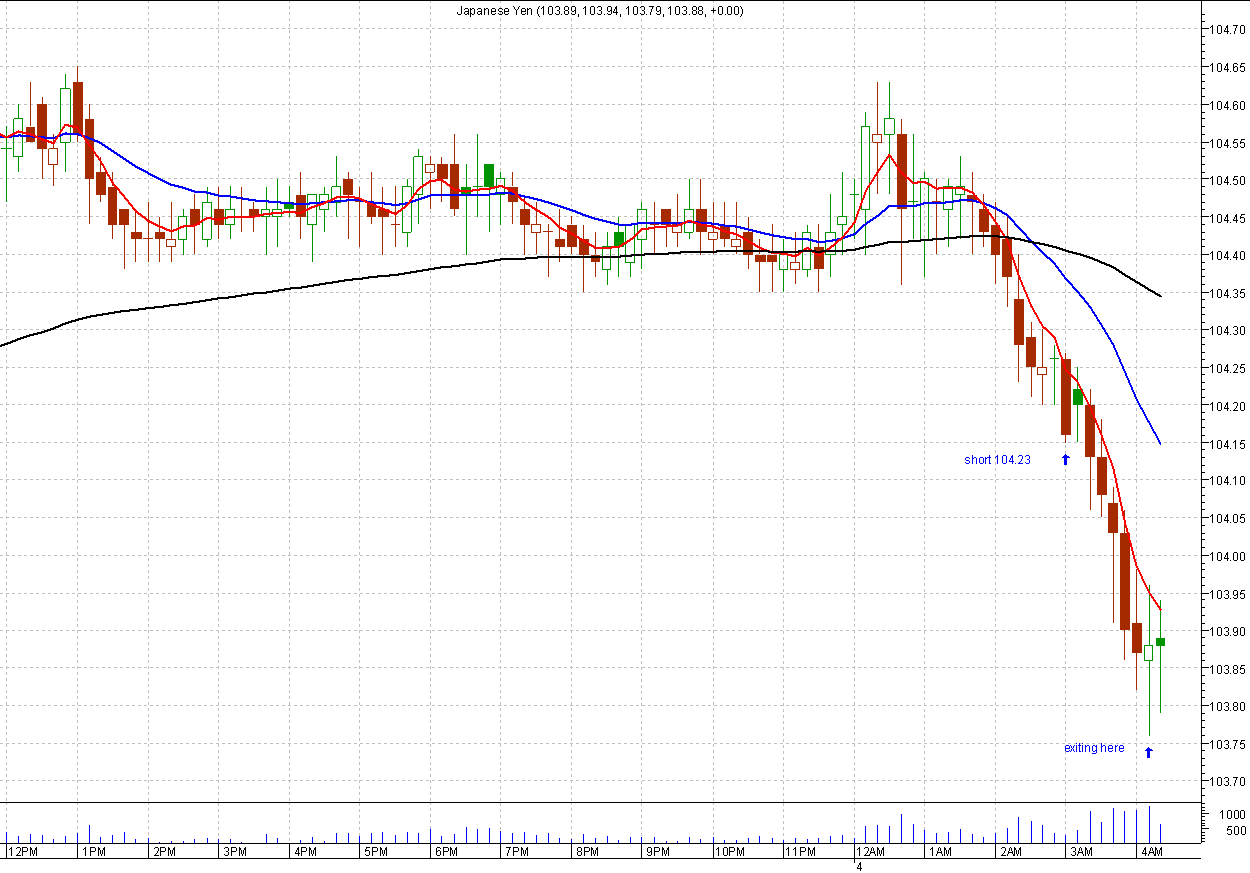
Entry Short 104.23. Stop loss 104.39. Target 103.85
=========================================================================================================
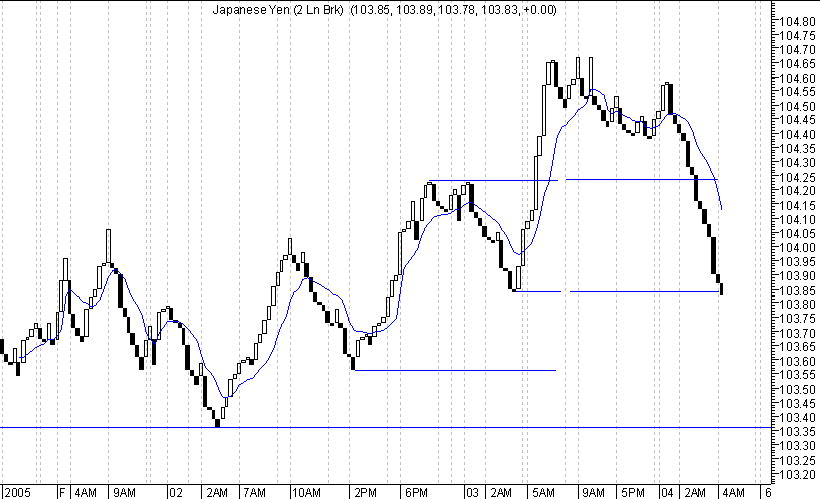
The 10 minute 2-Line Break chart below shows the support level 04 103.85
====================================================================================================
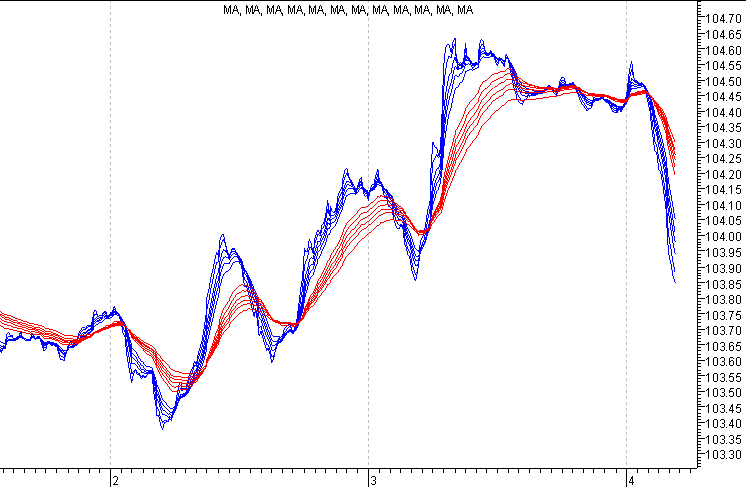
The MA guppy chart shows the down trend.
=====================================================================================================
The ADX-RSI-SAR chart below is confirming the short trade setup.
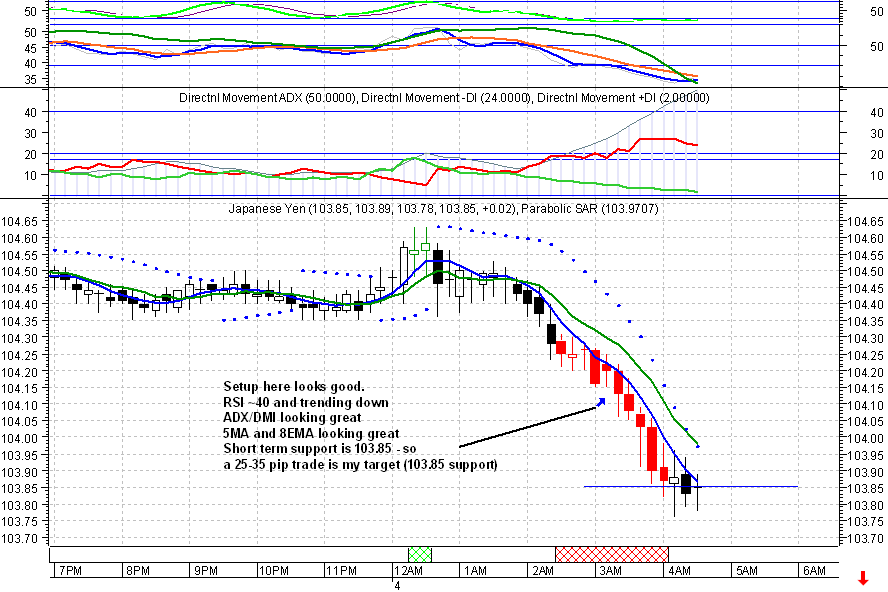
=======================================================================================================
Here's how the trade played out below. 103.85 support is met, but it looks like there may be a bounce at this level. I don't see enough stalling versus bouncing, so I get an exit price of 103.90
============================================================================================================