Summary:
I decided to post my fuel records on the web. I keep detailed records on my fuel economy and fuel costs for the following reasons. First I can detect when I have an engine or driveline problem when suddenly my fuel economy drops for no apparent reason; Second, I can figure out how much a trip will cost me whenever I get the urge to travel; and third, I can work out a monthly fuel budget as I am consistent in my driving patterns from season to season. I can also quickly figure out the impact of crazy fuel prices on my wallet too.
Below you will find a table and three graphs. The table is identical to a spreadsheet I maintain for my truck. The table is month to month, except when my camper or 5th wheel is attached to the truck. Every time I fill up with fuel, I record my odometer reading on the receipt. I then add the liters, dollars and odometer reading to the spreadsheet. The spreadsheet then calculates Km driven per month (between fillup dates that is), the Km per liter, the imperial mpg , (which is 120% greater than US mpg), the cents per km, the cents per mile and the cents per liter I paid for the fuel. The cents per liter calculation is a reality check to ensure that all fuel is accounted for. I make a separate entry for whenever I have the camper or the 5th wheel attached as they are my most heavily loaded conditions. To ensure accuracy between unloaded and loaded conditions, I fill up with fuel at trip start and trip end.
One thing I like about my truck is the 144L (38 US Gal) fuel tank. I fill up about every 14 days and I get 12 or more hours driving on it in the unloaded condition.
Table Legend:
KM: Kilometers
M: Miles
e = unloaded; Camp = camper on; 5th = Dutchmen 5th wheel
attached.
~: running average of
M/Gal: miles per imperial gallon (1 imp gal = 1.20 US Gal)
C/Km: cents per KM
C/m : cents/Mile
C/L: cents per liter of fuel
US Units.: US Gals, US Dollars at an exchange rate of $1.55 : $1; US
Mpg, US $/mile, US $/US Gal
Mpg is Imperial unless otherwise noted.
Note that for all these numbers and graphs, they are the average for the whole month, or the average for the whole trip when the camper or 5th wheel is attached.
*Tank dump refers to when I had a full tank of Sunoco Diesel dumped from my truck due to a bad case of water in fuel. It messed up the numbers because I had to estimate the km driven and liters consumed. I will never buy fuel from Sunoco again as the East Pembroke, NY staff had the poorest attitude I've ever met - I mean ever!
| Table 1 - Caculations | |||||||||||||||
| Date | Odometer | Liters | ($) | Load | KM | Km/L | ~Km/L | M/Gal | ~M/Gal | C/Km | ~C/Km | C/M | ~C/M | C/L | |
| 2000 | 2-Feb | 30 | 0.0 | $0.00 | e | 0 | 0.0 | 0.0 | 0.0 | 0.0 | 0.0 | 0.0 | 0.0 | 0.0 | 0.0 |
| 16-Feb | 1311 | 192.1 | $140.00 | e | 1281 | 6.7 | 6.7 | 18.8 | 18.8 | 10.9 | 10.9 | 17.6 | 17.6 | 72.9 | |
| 27-Mar | 4034 | 367.1 | $250.00 | e | 2723 | 7.4 | 7.2 | 21.0 | 20.2 | 9.2 | 9.7 | 14.8 | 15.7 | 68.1 | |
| 24-Apr | 5887 | 247.7 | $162.00 | e | 1853 | 7.5 | 7.3 | 21.1 | 20.5 | 8.7 | 9.4 | 14.1 | 15.2 | 65.4 | |
| 24-May | 7625 | 237.0 | $155.00 | e | 1738 | 7.3 | 7.3 | 20.7 | 20.6 | 8.9 | 9.3 | 14.4 | 15.0 | 65.4 | |
| *Tank dump | 6-Jun | 11386 | 637.9 | $385.97 | Camp | 3761 | 5.9 | 6.8 | 16.7 | 19.1 | 10.3 | 9.6 | 16.5 | 15.5 | 60.5 |
| 17-Jun | 12412 | 125.2 | $80.00 | e | 1026 | 8.2 | 6.8 | 23.2 | 19.3 | 7.8 | 9.5 | 12.6 | 15.3 | 63.9 | |
| 21-Jul | 15542 | 370.9 | $237.00 | e | 3130 | 8.4 | 7.1 | 23.8 | 20.1 | 7.6 | 9.1 | 12.2 | 14.7 | 63.9 | |
| 29-Aug | 18964 | 409.9 | $268.10 | e | 3422 | 8.3 | 7.3 | 23.6 | 20.7 | 7.8 | 8.9 | 12.6 | 14.3 | 65.4 | |
| 7-Sep | 19497 | 61.3 | $44.00 | e | 533 | 8.7 | 7.3 | 24.6 | 20.7 | 8.3 | 8.9 | 13.3 | 14.3 | 71.8 | |
| 9-Sep | 20339 | 139.5 | $99.00 | Camp | 842 | 6.0 | 7.3 | 17.1 | 20.6 | 11.8 | 9.0 | 18.9 | 14.5 | 71.0 | |
| 29-Sep | 21346 | 121.0 | $87.00 | e | 1007 | 8.3 | 7.3 | 23.5 | 20.7 | 8.6 | 9.0 | 13.9 | 14.4 | 71.9 | |
|
26-Oct |
23325 | 252.5 | $179.00 | e | 1979 | 7.8 | 7.4 | 22.1 | 20.8 | 9.0 | 9.0 | 14.6 | 14.5 | 70.9 | |
|
23-Nov |
25295 | 252.7 | $183.00 | e | 1970 | 7.8 | 7.4 | 22.0 | 20.9 | 9.3 | 9.0 | 15.0 | 14.5 | 72.4 | |
|
19-Dec |
27037 | 245.7 | $184.00 | e | 1742 | 7.1 | 7.4 | 20.0 | 20.8 | 10.6 | 9.1 | 17.0 | 14.7 | 74.9 | |
| 2001 | 31-Jan | 30391 | 487.4 | $354.04 | e | 3354 | 6.9 | 7.3 | 19.4 | 20.7 | 10.6 | 9.3 | 17.0 | 14.9 | 72.6 |
| 28-Feb | 32014 | 250.8 | $175.00 | e | 1623 | 6.5 | 7.3 | 18.3 | 20.5 | 10.8 | 9.3 | 17.4 | 15.0 | 69.8 | |
| 31-Mar | 34757 | 365.6 | $246.02 | e | 2743 | 7.5 | 7.3 | 21.2 | 20.6 | 9.0 | 9.3 | 14.4 | 15.0 | 67.3 | |
| 27-Apr | 36529 | 218.5 | $144.00 | e | 1772 | 8.1 | 7.3 | 22.9 | 20.7 | 8.1 | 9.3 | 13.1 | 14.9 | 65.9 | |
| 29-May | 39516 | 359.5 | $235.00 | e | 2987 | 8.3 | 7.4 | 23.5 | 20.9 | 7.9 | 9.2 | 12.7 | 14.7 | 65.4 | |
| 27-Jun | 42245 | 324.2 | $212.00 | e | 2729 | 8.4 | 7.4 | 23.8 | 21.0 | 7.8 | 9.1 | 12.5 | 14.6 | 65.4 | |
| 10-Aug | 46843 | 545.3 | $353.35 | e | 4598 | 8.4 | 7.5 | 23.8 | 21.3 | 7.7 | 8.9 | 12.4 | 14.4 | 64.8 | |
| 13-Aug | 47958 | 190.8 | $120.86 | Camp | 1115 | 5.8 | 7.5 | 16.5 | 21.1 | 10.8 | 9.0 | 17.5 | 14.4 | 63.3 | |
| 20-Aug | 49051 | 124.8 | $82.00 | e | 1093 | 8.8 | 7.5 | 24.8 | 21.2 | 7.5 | 8.9 | 12.1 | 14.4 | 65.7 | |
| 25-Sep | 52431 | 384.4 | $248.01 | e | 3380 | 8.8 | 7.6 | 24.8 | 21.4 | 7.3 | 8.8 | 11.8 | 14.2 | 64.5 | |
| 22-Oct | 55496 | 353.7 | $218.01 | e | 3065 | 8.7 | 7.6 | 24.5 | 21.6 | 7.1 | 8.7 | 11.5 | 14.1 | 61.6 | |
| 26-Nov | 59382 | 496.4 | $297.00 | e | 3886 | 7.8 | 7.6 | 22.1 | 21.6 | 7.6 | 8.7 | 12.3 | 14.0 | 59.8 | |
| 31-Dec | 62020 | 373.6 | $214.00 | e | 2638 | 7.1 | 7.6 | 20.0 | 21.5 | 8.1 | 8.6 | 13.1 | 13.9 | 57.3 | |
| 2002 | 24-Jan | 63782 | 253.6 | $143.01 | e | 1762 | 6.9 | 7.6 | 19.6 | 21.5 | 8.1 | 8.6 | 13.1 | 13.9 | 56.4 |
| 18-Feb | 65477 | 245.4 | $136.00 | e | 1695 | 6.9 | 7.6 | 19.5 | 21.4 | 8.0 | 8.6 | 12.9 | 13.9 | 55.4 | |
| 24-Mar | 67135 | 245.0 | $140.00 | e | 1658 | 6.8 | 7.6 | 19.1 | 21.3 | 8.4 | 8.6 | 13.6 | 13.9 | 57.1 | |
| 02-Apr | 70633 | 650.1 | $360.29 | 5th | 3498 | 5.4 | 7.4 | 15.2 | 20.9 | 10.3 | 8.7 | 16.6 | 14.0 | 55.4 | |
| 21-Apr | 71623 | 122.6 | $71.00 | e | 990 | 8.1 | 7.4 | 22.8 | 21.0 | 7.2 | 8.7 | 11.5 | 14.0 | 57.9 | |
| 23-May | 72905 | 159.7 | $98.00 | e | 1349 | 8.5 | 7.4 | 23.9 | 21.0 | 7.3 | 8.6 | 11.7 | 13.9 | 61.4 | |
| 23-Jun | 75041 | 250.4 | $155.00 | e | 2248 | 9.0 | 7.5 | 25.4 | 21.1 | 6.9 | 8.6 | 11.1 | 13.8 | 61.9 | |
| 13-Jul | 75919 | 106.6 | $66.00 | e | 924 | 8.7 | 7.5 | 24.5 | 21.2 | 7.1 | 8.6 | 11.5 | 13.8 | 61.9 | |
| 15-Jul | 76766 | 132.5 | $82.00 | 5th | 847 | 6.4 | 7.5 | 18.1 | 21.1 | 9.7 | 8.6 | 15.6 | 13.8 | 61.9 | |
| 26-Jul | 77713 | 83.7 | $50.00 | e | 697 | 8.3 | 7.5 | 23.5 | 21.1 | 7.2 | 8.6 | 11.6 | 13.8 | 59.7 | |
| 21-Aug | 79844 | 249.3 | $147.00 | e | 2131 | 8.5 | 7.5 | 24.2 | 21.1 | 6.9 | 8.6 | 11.1 | 13.8 | 59.0 | |
| 06-Sep | 80809 | 120.8 | $76.00 | e | 965 | 8.0 | 7.5 | 22.6 | 21.1 | 7.9 | 8.5 | 12.7 | 13.8 | 62.9 | |
| 09-Sep | 81548 | 129.2 | $80.00 | 5th | 739 | 5.7 | 7.5 | 16.2 | 21.1 | 10.8 | 8.6 | 17.4 | 13.8 | 61.9 | |
| 26-Sep | 82676 | 125.2 | $80.00 | e | 1128 | 9.0 | 7.5 | 25.5 | 21.1 | 7.1 | 8.5 | 11.4 | 13.8 | 63.9 | |
| Totals | 26-Sep | 82676 | 11051.6 | $7,062.42 | 82646 | 7.5 | 21.1 | 8.5 | 13.8 | 63.9 | |||||
| Table 1a - Totals converted to US Units | |||||||||||||||
| US Units | Odometer | US Gal | US $ | Miles | US mpg | US C/M | US $/Gal (@1.55/$) | ||||||||
| 51352 | 2923.7 | $4,556.40 | 51333 | 17.6 | 8.9 | $1.56 | |||||||||
| Table 2 - Trips with Camper or 5th wheel attached (loaded) | |||||||||||||||
| Liters USGal | ($) USD |
KM Miles | Km/L |
M/Gal | C/Km | C/M USC/M | C/L US$/Gal | ||||||||
| Cape Hatteras 2000 | Can Units | 638.0 | 385.97 | 3761 | 5.9 | 16.7 | 10.3 | 16.5 | 60.5 | ||||||
| Camper | US Units | 168.8 | 255.00 | 2336 | 13.8 | 10.9 | $1.51 | ||||||||
| Lake George 2000 | Can Units | 139.5 | 99.00 | 842 | 6.0 | 17.1 | 11.8 | 18.9 | 71.0 | ||||||
| Camper | US Units | 36.9 | 66.00 | 523 | 14.2 | 12.6 | $1.79 | ||||||||
| East Durham 2001 | Can Units | 190.8 | 120.86 | 1115 | 5.8 | 16.5 | 10.8 | 17.5 | 63.3 | ||||||
|
Camper
|
US Units | 50.5 | 77.23 | 693 | 13.7 | 11.2 | $1.53 | ||||||||
| Cape Hatteras 2002 | Can: | 650.1 | 360.29 | 3498 | 5.4 | 15.2 | 10.3 | 16.6 | 55.4 | ||||||
|
5th
|
US: | 172.0 | 221.52 | 2173 | 12.6 | 10.2 | $1.29 | ||||||||
| Orillia 2002 | Can: | 132.5 | 82.00 | 847 | 6.4 | 18.1 | 9.7 | 15.6 | 61.9 | ||||||
| 5th | US: | 35.1 | 50.55 | 526 | 15.0 | 9.6 | $1.44 | ||||||||
| Lake George 2002 | Can: | 129.2 | 80.00 | 739 | 5.7 | 16.2 | 10.8 | 17.4 | 61.9 | ||||||
| 5th | US: | 34.2 | 49.32 | 459 | 13.4 | 10.7 | $1.44 | ||||||||
Interesting Stats:
Percentage distance driven under load: 11052/82646
= 13.37%
Number of Days Truck Owned: 967
liters per day used: 11.4
CAD/day cost: $7.30
Km/day driven: 85
Total Barrels of Diesel Consumed: 69.6
Detailed Analysis:
The following graph shows how my fuel performance varies month to month. You can clearly see the patttern that the table is reporting. Note that fuel economy varies with the time of year or drops whenever I have a full load on. Winter fuel and winter driving conditions clearly affects the fuel economy of the PSD (the EBPV comes on frequently, the engine takes longer to warm up, snowy roads & more idle time). In Canada, most resellers switch to winter fuel sometime in Oct with the onset of frost. The fuel economy drops as a result, since winter fuel has less heating value than summer fuel, and vehicle drag increases due to denser air, and the truck rolling resistance increases due to higher friction.
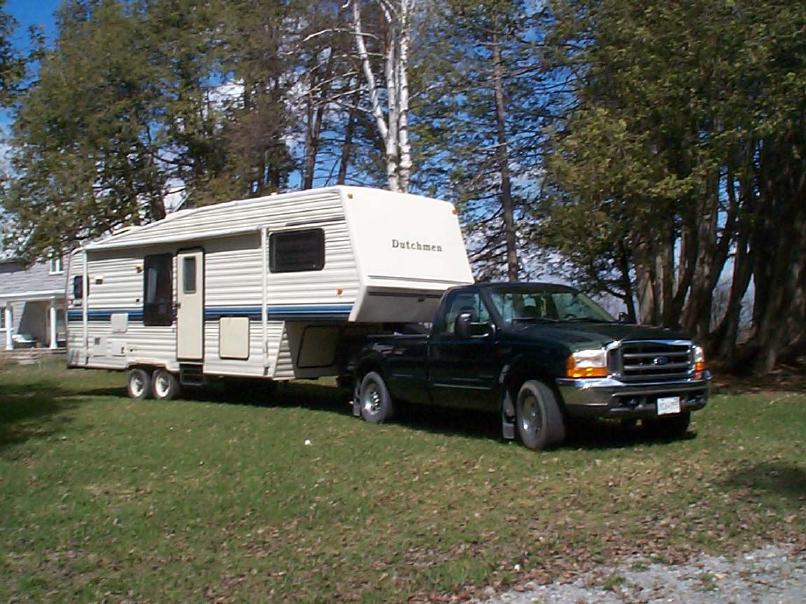
Here is a picture of my truck with my 1993 Dutchmen 27FWRK-RYL attached. I hardly know its behind me. This is my most heavily loaded condition and I get 16 mpg with it on (and thats towing through the Pennsylvania Mountains at 100KM/hr in 6th!)
When Loaded, I average consistent mpg's. The x-axis is Kilometers as my odometer is in KM. The solid bar and right axis represents the number entries in the table above (equals number of trips). The blue line represents the average cost for those months. The yellow line is an adjusted line based on the life average cost of fuel (total fuel cost / total liters purchased). When the blue line is above the yellow line it indicates the price of fuel was higher than average for those entries. As an example, I drove two trips where I averaged 3630 KM, my average mpg was 16, (pink line) it cost me 16.5 c/mile (blue line), which is lower than my life cost of 18 c/mile (yellow line). Thats because both of these trips were to Cape Hatteras, and the fuel cost is much lower in the mid eastern States than in Ontario at that time.
The next graph shows I get between 21 and 24 mpg imperial each month just going about my daily business. The high mpg occur during the summer months . The low mpg occur during the winter months. I am bining the data on distance travelled per month because I am consitent in my travel patterns year to year. This way I can distinguish between months of just commuting and months that include lots of extra travel, which tends to be the summer months. For example, for 10 months, I averaged 1779 KM, my fuel economy was 20.5 mpg (pink line), it cost me 14.5 c/mile (blue line) which is lower than the life cost of 14 C/mile (yellow line). Thats because these are mostly winter months, and mostly commuting, and since Feb 2000, the price of Diesel spikes up during the heating months due to heating oil supply problems in the USA.
Last Updated on 09/30/02