Assessment of the performance of physically based distributed codes simulating medium size hydrological systems. 2003, K.U.Leuven, ISBN 90-5682-416-3, 335pp.
![]() One level
up
Spanish site
One level
up
Spanish site
Introduction To Table of Contents
Vázquez R. F., 2003. Assessment of the performance of physically
based distributed codes simulating medium size hydrological systems. ISBN
90-5682-416-3, Department of Civil Engineering,
Katholieke Universiteit
Leuven, Belgium, 335pp.
The PhD research is related to distributed catchment modelling, a relative new topic with growing interest. Such interest in the subject is increasing rapidly under the society's pressure to accurately assess the impact of human activity on the natural resources, among which, water is one of the most vulnerable. Clear understanding of how human interference affects the water resources of a river basin will assist policy makers and water administrations in the definition of the most appropriate regulations and measures that conserves and protects the basin's water resources.
The specific objective of the doctoral research was the performance assessment of a physically based distributed hydrologic model using the MIKE SHE code and data of the river basin Gete (586 km2). The MIKE SHE code was selected as the modelling tool for its capacity to model the entire hydrologic cycle, the underground, soil and surface component in an integrated way (Chapter 1). The Gete catchment was chosen as test basin for its size, rolling landscape and shallow to medium depth of the phreatic groundwater table. The catchment is very representative for the loamy region of Belgium, being an important zone for the natural recharge of the groundwater system (Chapter 1).
In constructing the model of the study site, care was exerted to integrate (i) distributed data with different accuracy and scale characteristics and (ii) time varying data to characterise the hydrological stresses and catchment outputs (Chapter 2). Calibration and evaluation approaches were selected and applied (Chapter 3 and Chapter 4). For avoiding over-parameterisation and to address uncertainties associated to the model predictions, several sensitivity analyses were carried out including the assessment of the effect of the grid size, the potential evapotranspiration data and the digital terrain model generation-methods on the model performance, as well as, the values of the effective parameters (Chapter 4 and Chapter 5).
An uncertainty analysis was then performed to determine confidence intervals for the modelled variables (Chapter 6). The latter analysis involved the Monte Carlo simulation technique within the framework of the GLUE (Generalised Likelihood Uncertainty Estimation) methodology, which is based on the equifinality philosophy (many models that are consistent with the available observations). The sensitivity and uncertainty analyses (Chapter 4, Chapter 5 and Chapter 6) revealed (i) the equifinality of parameter sets apparently due to non-linearities and parameter interactions; (ii) the significant uncertainties associated to distributed model predictions, apparently caused by the significant uncertainty of the data available for the modelling; and (iii) the sensitivity of some of the components of the model structure to the referred data uncertainty.
Chapter I: INTRODUCTION To Table of Contents
In principle, spatially distributed codes can accept experimental data at each grid element or calculation node, predicting the response of catchments based on the knowledge of its physical properties without the need of model calibration. Those models would allow the prediction of the hydrological responses of ungauged catchments and of the changing responses resulting from changes in land characteristics. In practice, because of sub-grid heterogeneity of parameter values, differences between measurement and model grid scales, and experimental and financial constraints, specification of parameter values is difficult. Indeed, in most cases the experimental techniques to measure or estimate the model parameter values at the scale of the grid element do not exist. Thus, effective model parameters have to be defined normally through model calibration. Traditional evaluation by means of a Split-Sample (SS) test still remains in many practical cases the only attainable option; however, this method is inconsistent with spatially distributed modelling.
A brief description of both, the study site as well as the hydrological code used in this study are given in this chapter.
The study site is the Gete catchment,
located in Belgium (Fig.
1.1).
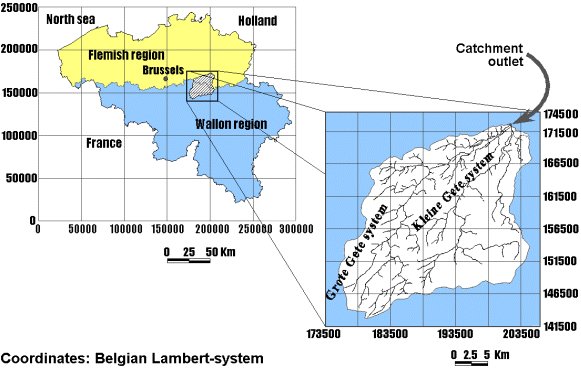
Fig. 1.1: Location of the study site within Belgium and a detailed view
of the modelled area (Vázquez
et al., 2002).
Chapter II: DATA SOURCES AND INITIAL PARAMETERISATION OF THE MODEL OF THE STUDY SITE To Table of Contents
This chapter outlines the general data requirements, data sources, data accuracy and data flow for building the distributed model of the study site with the aid of the MIKE SHE code. In doing so, this chapter also provides more details of the conceptual model of the study site (Fig. 2.1).
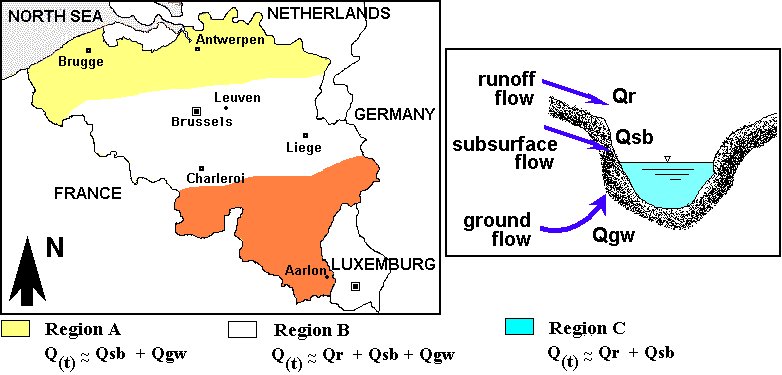
Fig. 2.1: Sketch of Belgium subdivided into the northern, central and
southern regions and schematization of the main hydrological processes.
Publications related to this chapter are Feyen et al.(2000), Vázquez et al.(2002) and Vázquez et al.(2004a).
Chapter III: MULTI-CRITERIA FRAMEWORK FOR ASSESSING THE PERFORMANCE OF DISTRIBUTED MODELS To Table of Contents
In principle, spatially distributed codes can accept experimental data at each grid element or calculation node, predicting the response of catchments based on the knowledge of its physical properties without the need of model calibration. Those models would allow the prediction of the hydrological responses of ungauged catchments and of the changing responses resulting from changes in land characteristics. In practice, because of sub-grid heterogeneity of parameter values, differences between measurement and model grid scales, and experimental and financial constraints, specification of parameter values is difficult. Indeed, in most cases the experimental techniques to measure or estimate the model parameter values at the scale of the grid element do not exist. Thus, effective model parameters have to be defined normally through model calibration. Traditional evaluation by means of a Split-Sample (SS) test still remains in many practical cases the only attainable option; however, this method is inconsistent with spatially distributed modelling.
The study site is the Gete catchment,
located in Belgium (Fig.
3.1).
Fig. 3.1: Flowchart for the creation of
DTMs (Vázquez et al.,
2002).
Publications related to this chapter are Feyen et al.(2000), Vázquez et al.(2002) and Vázquez et al.(2004a).
Chapter IV: CONVENTIONAL CALIBRATION AND EVALUATION OF THE DISTRIBUTED MODEL OF THE STUDY SITE To Table of Contents
This chapter describes the calibration of the distributed model of the study site (600x600 m²) within a multi-objective framework. Firstly, the model was calibrated against both daily discharge measurements and observed water levels and then evaluated using a simple Split-sample (SS) test. In addition, a Multi-site (MS) evaluation test was performed for 2 internal discharge stations and 6 observation wells that were not considered during model calibration.
The main calibration and evaluation
periods are sketched in (Fig.
4.1).
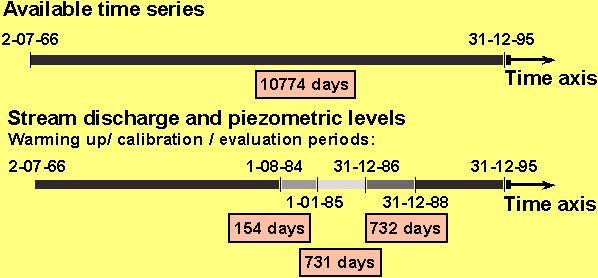
Fig. 4.1: Main calibration and evaluation
periods (Vázquez et al.,
2002).
Publications related to this chapter are Feyen et al.(2000) and Vázquez et al.(2002).
Chapter V: SENSITIVITY ANALYSES WITH RESPECT TO KEY INPUT AND MODELLING VARIABLES To Table of Contents
The potential of distributed codes (DC) for integrated water management is usually in contrast with the significant amount of input variables and parameters necessary to represent and schematise a particular catchment. As such, it is important to investigate which of those input variables are relevant to the simulation of the dynamics of the modelled hydrological system. This investigation should be based on reliable sensitivity analyses (SA) and implemented according to the distributed nature of those codes.
This chapter reports the results of some SA that considered few input variables and their effect on the model performance and on the magnitude of the model effective parameters(Fig. 5.1). In the same framework, this chapter also depicts some results dealing with the incidence of additional sampling of the parameter space on the performance and effective parameter values.
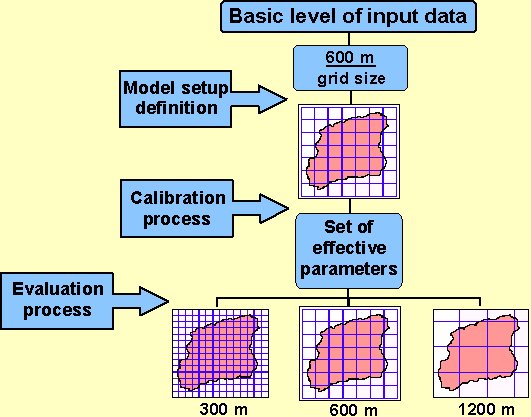
Fig. 5.1: Flowchart of the Multi-resolution (MR) test for investigating
the sensitivity to grid size
(Vázquez et al.,
2002).
Publications related to this chapter are Feyen et al.(2000), Vázquez et al.(2002) and Vázquez et al.(2004a).
Chapter VI: UNCERTAINTY ASSESSMENT OF THE MODEL PREDICTIONS To Table of Contents
This study aimed to estimate the uncertainty associated with the prediction of the basin-wide streamflow in the study-catchment. The Generalised Likelihood Uncertainty Estimation (GLUE) process was applied to assess the performance of the hydrological model with randomly defined parameter sets and to estimate confidence simulation limits. The GLUE analysis showed that the horizontal and vertical components of the hydraulic conductivity of one of the geological layers had the most influence on the streamflow model performance. The analysis also revealed the significant impact of data uncertainty in the hydrological modelling of the study site.
The study site is the Gete catchment,
located in Belgium (Fig.
6.1).
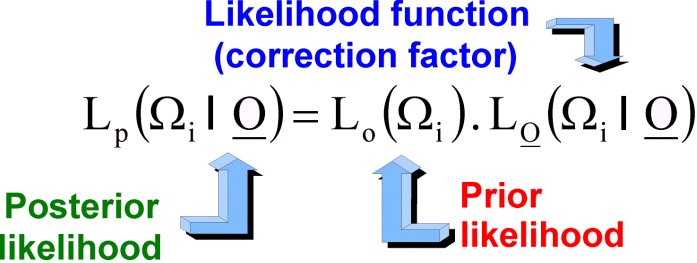
Fig. 6.1: Bayesian approach to upgrade probability estimates conditioned
on newly observed data (Vázquez,
2003).
Publications related to this chapter are Vázquez et al.(2002) and Vázquez et al.(2004a).
Chapter VII: CONCLUSIONS AND RECOMMENDATIONS To Table of Contents
"So far as the laws of mathematics refer to reality, they are not certain. So far as they are certain, they do not refer to reality" ................Albert Einstein (1879-1955).
The main objectives of the doctoral research were to outline and test an approach for assessing the performance of spatially distributed catchment models and to quantify the uncertainty associated to the model outputs, given current limitations in terms of data availability and differences among the scales at which the physical structure of the model was derived, the scales at which the data are collected and the scales at which medium size catchments are modelled. To accomplish previous, research was mainly based on the assessment of the relevance of some key input and modelling variables on the simulation outputs and the magnitude of the effective parameters, the assessment of the sensitivity of certain components of the MIKE SHE model structure to the accuracy of these input and modelling variables and the realisation of the spatially physically based hydrological code MIKE SHE in a simple stochastic context. In this respect, the following research activities were developed: (i) the definition of appropriate evaluation statistics and evaluation tests to assess the performance of distributed models; (ii) the application of sensitivity analyses inspecting some input and modelling variables; and (iii) the definition of simulation bands characterising the total uncertainty associated to model outputs. Although those activities are part of a holistic modelling protocol, an attempt was made to depict separately their relevance through the different chapters of the dissertation.
Appendix A: ASSESSMENT OF DTM QUALITY FOR HYDROLOGICAL USE To Table of Contents
In the framework of a hydrological catchment modelling, a sensitivity analysis was carried out to investigate the relevance of digital terrain models (DTMs) on the model performances and effective parameter values. To support the analysis, three approaches for producing DTMs were applied (Fig. A.1). This appendix describes the DTM generation approaches and the assessment of the suitability for hydrological use of the resulting terrain models. The details of the DTM sensitivity analysis, carried out with the MIKE SHE hydrological code, are reported in Chapter 5. The DTM generation approach (A) considered the Bilinear (Bi) interpolation technique that is available in the MIKE SHE code. A triangulated irregular network (TIN) surface was produced for the approaches (B) and (C). In approach (B), the TIN surface was rearranged into a regular lattice with a resolution required by the hydrological modelling. In approach (C), the MIKE SHE Bilinear interpolation method was applied on contour lines that were, in turned, derived from the TIN surface.
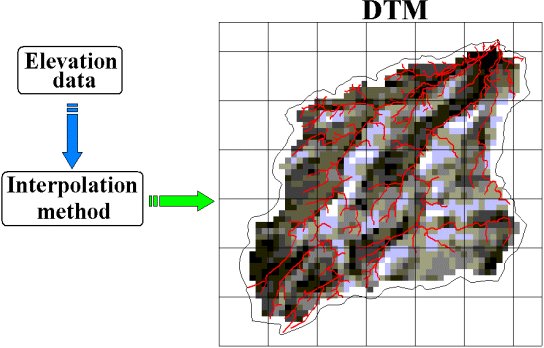
Fig. A.1: Flowchart for the creation of
DTMs (Vázquez,
2003).
A publication related to this appendix is Feyen et al.(2004b).
Appendix B: PROCESSING OF THE SOIL DATA To Table of Contents
This appendix describes the
morphogenetic Belgian soil system, which is built of a three letter combination
representing texture of the topsoil, natural drainage class and soil profile
development. The series is further specified by qualifiers, which refer to
substratum, type of parent material, soil profile development and soil phase.
The data indicated in this appendix must be used in conjunction with the
textural triangle represented in
(Fig.
B.1).
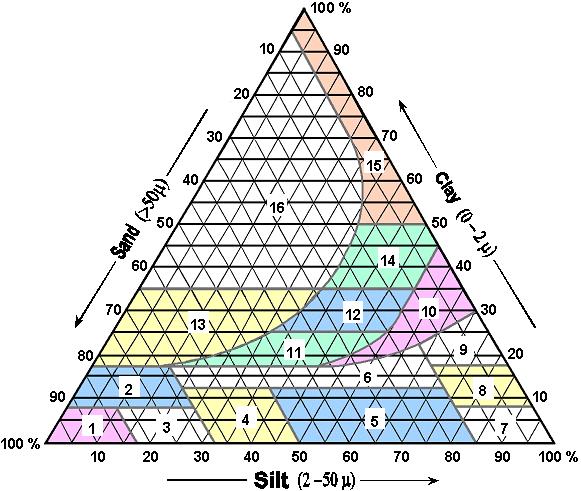
Fig. B.1: Textural triangle for the Belgian soil
system (Vázquez,
2003).
A publication related to this appendix is Feyen et al.(2000).
Appendix C: LITHOSTRATIGRAPHY OF THE STUDY SITE To Table of Contents
The appendix describes the main characteristics of the geology of the catchment that is conformed by nine geological formations, namely, (i) Quaternarian (Holocene and Pleistocene), (ii) Borgloon (Tongeren group), (iii) St. Huibrechts-Hern (upper Eocene), (iv) Brusseliaan (Zenne group), (v) Kortrijk (Ieper group), (vi) Tienen and Landeniaan (Landen group), (vii) Heers (middle Palaeocene), (viii) Cretaceous and (ix) the Palaeozoic pedestal (Feyen et al.(2000)).
Appendix D: POTENTIAL EVAPOTRANSPIRATION (ETp) FOR THE DISTRIBUTED MODELLING OF BASINS To Table of Contents
The knowledge of spatial and temporal variability of evapotranspiration (ET) is necessary to face a variety of water resources problems in different scales. Over an extensive range of spatial scales, ET or its components can be measured with reasonable accuracy by several methods that have different inherent advantages, limitations and intrusive characteristics and are suitable for different spatial scales. The methods are generally indirect such as water budget methods (soil and plant weighing lysimeters or regional water-budget method) or directly such as micrometeorological methods (Eddy Correlation method). Other methods are for instance chemical tracing and sap flow. ET can also be estimated directly from climatic measurements usually through energy balance methods, such as the Penman type models or through other more empirical methods that are differing in terms of data demand and in terms of climatic suitability.
However, the effective quantitative estimation of ET still remains a tough task to be achieved, especially in a regional context as it depends among other factors on the water supply to the evaporating surfaces, soil water content and rainfall distribution.
MIKE SHE estimates ETact based on the Kristensen-Jensen model that uses among other information time series of potential evapotranspiration (ETp). In this appendix, the generation of ETp is discussed in detail by assessing the suitability of two Penman based estimating approaches, FAO-24 and FAO-56 for deriving ETp data to a point scale.
The ETp were generated not only
to obtain relevant data for the modelling of the catchment of interest but
also to support the investigation of the effect of the ETp data on the effective
parameters and on the performance of the MIKE SHE code applied to the catchment
(Fig.
D.1), as discussed in Chapter 5.
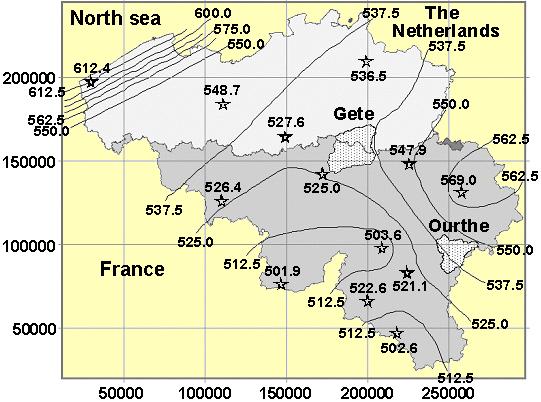
Fig. D.1: Position of the study site, meteorological stations and distribution
of mean annual ETo (Vázquez
and Feyen, 2004a after Gellens-Meulenberghs and Gellens, 1992).
Publications related to this appendix are Feyen et al.(2003a), Vázquez et al.(2003b) and Vázquez et al.(2004a).
Appendix E: BRIEF QUALITY ASSESSMENT OF THE CLIMATIC DATA FOR ESTIMATING ETp To Table of Contents
This appendix assesses briefly the quality of the available meteorological records for estimating ETp.
Appendix F: FILTERING OF SUBFLOWS FROM TOTAL STREAMFLOW TIME SERIES To Table of Contents
Streamflow is the flow rate, or discharge, along a defined natural channel. It is the component of the hydrologic cycle, which transfers water, originally falling as rain or snow onto a watershed, from the land's surface to the oceans. Streamflow (Fig. F.1) is usually generated by a combination of (i) baseflow (return flow from groundwater); (ii) interflow (rapid subsurface flow through pipes, macro pores, and seepage zones in the soil) and (iii) saturated overland flow from the surface of poorly permeable or temporarily saturated soil, or from permanently saturated zones near the channel system.
A brief description of the methods
used in the research for subflow separation is given in this
appendix.
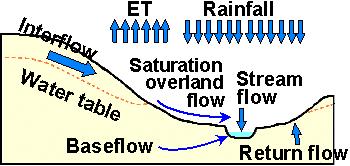
Fig. F.1: Sources of streamflow for a wet period
(Vázquez,
2003).
A publications related to this appendix is Vázquez et al.(2004a).
Appendix G: GENERALISED ESTREME VALUE ANALISYS (GEV) CONSIDERING THE POT APPROACH To Table of Contents
Spatial and temporal evolution of hydrological processes occurs in a manner that is partly predictable or deterministic and partly stochastic. When the deterministic part is insignificant, the processes may be treated as purely random or stochastic, which implies that an observation of the process is not correlated to adjacent observations. The output of the hydrologic system is then treated as stochastic, space-independent and time-independent. This type of treatment is very appropriate for observation of extreme hydrologic events (floods or droughts) and for data averaged over long time intervals, such as annual precipitation. Random description of a hydrological process is purely descriptive in the sense that statistics are applied on the observations themselves without consideration of the physical processes that produced them, that is, without a causality treatment. Independence of events is a critical characteristic of the observations to be analysed, because if they are independent they can be analysed without regard to their order of occurrence. If successive events are correlated, the statistics involved in the analytical process are more complicated.
A brief description of the Generalised Value Analisis usedin this research is given in this appendix.
A publication related to this appendix is Vázquez et al.(2004a).