Dear readers please read the disclaimer at the bottom of this page
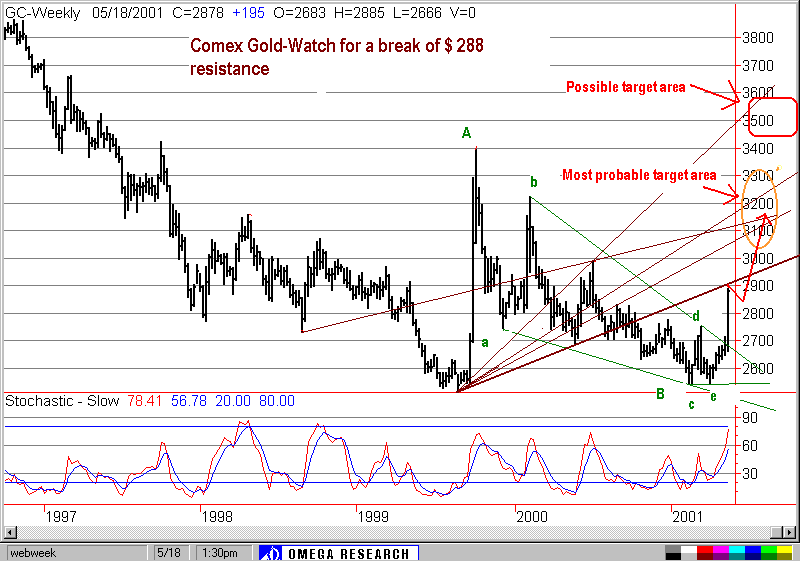
Gold closed the week with a strong spike up to break a few resistance points notably the high marked by the ‘d’ wave within the descending wedge. The rising wave structure from the ‘e’ low was not really copybook wave formation. But yet the preceding pattern and the message it contained could not be ignored.
Pattern formations are market’s way of telling us what’s going on in people’s minds. They give a pre-view of the ensuing collective thought process. Respect and act on the patterns and we may benefit. Dismiss them and get injured.
We first identified the pattern and thought it fit to put out the idea of Gold $ 330-335 in the 1st Dec 2000 update. Since then six updates have exhorted readers to watch for the breakout including the 10th March "Gold alert". Patience pays.
Of course fundamental commentators will now explain away the up-move as a consequence of the conclusion of the Bank of England auction sales. Or that Gold was over-short. Oh yeah! If in the past Gold had reacted to news of auction conclusions and accumulated short positions the metal should have been now at $500.
What next? We studied charts of Comex Gold, Silver, XAU index, TSE Index and the JSE Index. Some charts from this group are cast below with our analysis. They seem to hold a common message. More rising action is to be expected in the market. So those holding on to metal positions should not sell out yet. On the other hand we should be cautioned that spikes have a way of breaking down equally sharply.
Comex Gold-weekly-19thmay-close-2878.
Comex Gold is now nudging at an immediate resistance level traced by the brown line drawn from the Yr.99 lows. Should the price surpass that level it should next head for the $320 level area marked by the yellow circle. That is a very probable target often stated in previous gold updates. A more aggressive target could be around the $350 area marked by the red rectangle. Such a rise would then register an important Elliottian labeling after which a final decline may commence.
As a matter of prudence stop loss at $274, which is wave "d" high, is advisable. A fall below this level will negate the bull picture.
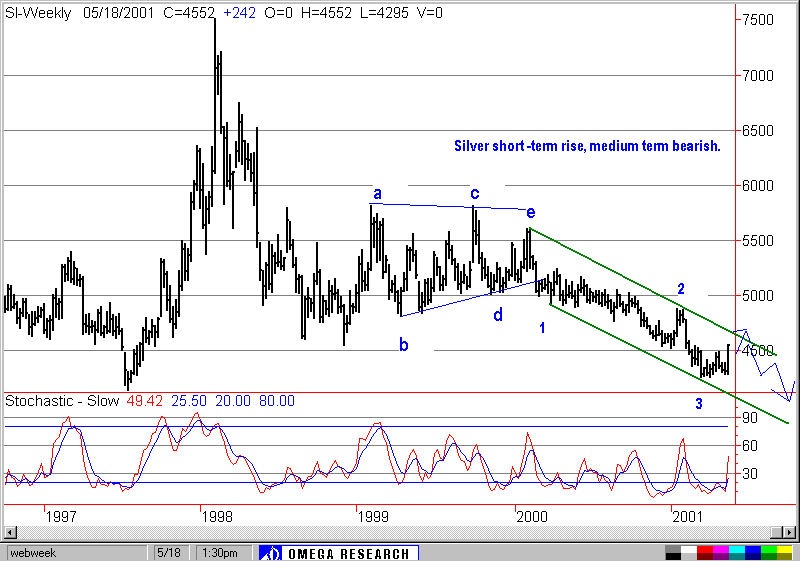
SILVER-Weekly-18th May-Chart 1
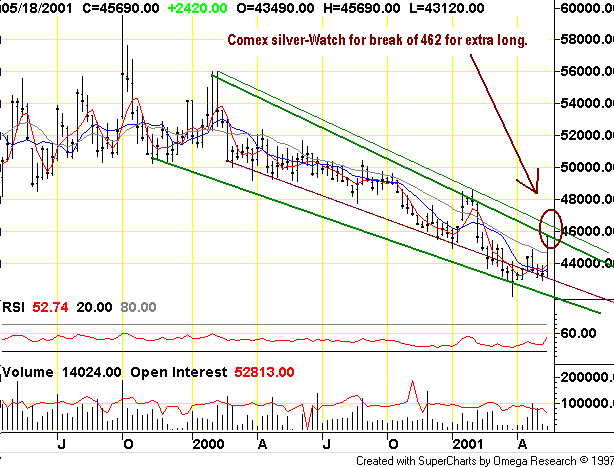
In our 1st March chart update on Silver we had forecast "Silver on the down path" .The 4295 low has found channel support and may now hold on allowing the current up-move to play out. Silver now faces an important resistance just under 4620.A break of the resistance should increase the bullishness, short term. Next resistance is under 4700.
Long term, lower lows are to be expected.
Stop loss at 4295 (wave 3). A fall below that level will negate the up trend.
Silver Chart 2
XAU Index
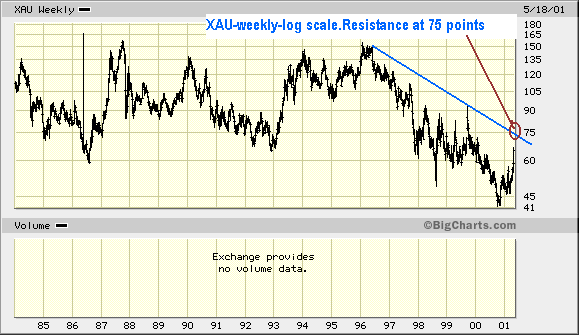
Two charts of the Philadelphia gold and silver Index are analyzed below. The long-term chart from Yr.1984 log scale faces resistance at 75 points level. That being not too near the current market it holds forth a case for further up-moves in Gold and Silver near time.
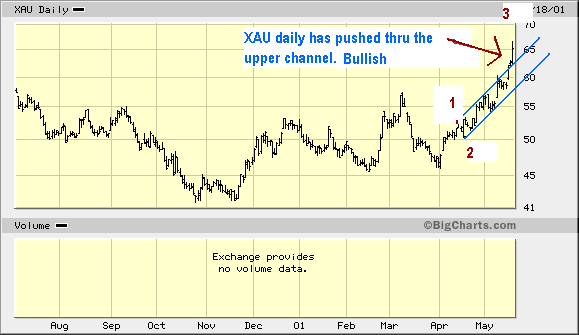
On the daily the price line has already cut through the channel upper line and appears to have embarked on a 3rd wave advance from the March end/April lows.
XAU-Log-week-18th May
XAU-Daily-18th may
Disclaimer: The contents of Krystal Ball are provided for personal reading purpose only and does not constitute a recommendation to invest in or endorse any market, company, or investment product. We make no representations nor tender any advice and specifically disclaim all warranties, express, implied or statutory, regarding the accuracy, timeliness, completeness, or fitness for any particular purpose of any of the contents. Anyone who makes investment or any other decisions based on what they read in the Krystal Ball does so at his own risk and cannot hold Krystal Ball, the author or the owners thereof responsible for the consequences