Krystal Ball
A Wave perspective of the Indian Stock market.
BSE Sensex -8th June Close
As we are now getting past the Corporate annual and quarterly results season except for a few pending announcements it is perhaps time to take another look at the Indices from a chart perpective.
At this point of time the Chart patterns are anything but bullish. Four charts of the Sensex from Yr.1979 are reproduced below with corresponding Trend and Elliott Wave analysis applied to the charts.
Before we go on to the analysis of the price line two important points need to be borne in mind.
1.The BSE Index data is available from only 1979.The market itself has been in existence much before. To that extent the "cycle" analysis of the Index may not correspond to economic cycles. The RBI data existing before that may throw more light but then mixing the RBI chart with the BSE Index has it's own perils in ratio calculations.
2.Several ways of interpreting the Charts from a wave perspective are possible. My labeling of the waves is more guided by the form of the price line than anything else. Even within forms there can be objective alternatives. I have picked the one that most satisfies my aesthetics, so to say.
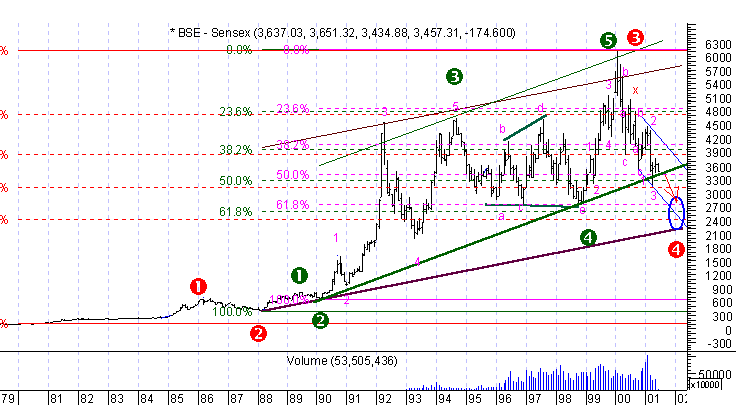
So with these caveats I suggest that the Sensex is on course to fulfilling a perfectly natural correction after completion of the Primary bull market commencing early 1988 ( the Waves marked by the Green circles 1,2,3,4, and 5).This primary bull market may be classified as Cycle Wave 3 (Red Circle 3) commencing from the low of 1988 within the Cycle wave that commenced early 80s.Refer Charts 1and 3.
Chart 1-Sensex -1979-Monthly -Arith-scale.
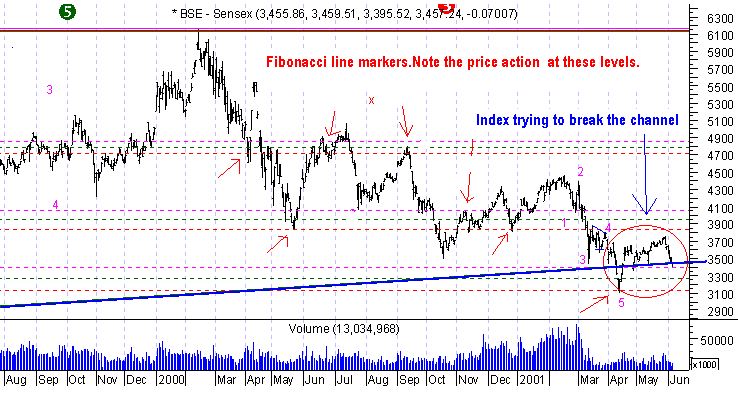
Chart 2-arith-daily
The price line on the 1979 monthly-Chart 1- has once broken the channel support from the 90 lows to touch the 50% retracal level from the 1980 lows on an intra-day basis. It is now hovering after the bounce back above the channel. One may well say this satisfies a technical parameter for the bear market correction. And this will be the case even if the index cuts below the channel again and stays at or about 3018 points daily close.
Note the price line on the daily-Chart 2. Observe the price action of the index at the fibonacci dotted lines. It picked the 61.8% red dotted line to change trend during the May 2000 and April 2001 lows. It is persistent on breaking the channel shown by four attempts so far. Moreover the declining pattern does not seem complete yet.(For details of possible declining patterns and their targets watch out for our next update). If the channel is broken as I expect then the index could move down towards the next probable Fibonacci retracal ratio, that is 61.8% of the distance from the 90 lows.
Applying 61.8% ratio three correction levels are indicated within the elliptical area in Blue in Chart 1. These are taken from the 79 lows, 88 lows and the 90 lows. They all form a cluster within a small area. Refer the table below for the target values
So if the Index does move into that elliptical area then it may be able to satisfy a trend parameter also by touching the channel support drawn from the 88 lows which is the beginning of Cycle Wave 3. Sometimes when an Index heads towards a retracement zone that is near a major channel support most, if not all guidelines are satisfied within admissible tolerance levels. Often it marks the end of an era and heralds a new bull phase. So I will be keenly watching for the price action to find support at the 1988 channel to time an entry into stocks.
Chart 3-Sensex-79-Semi-Log
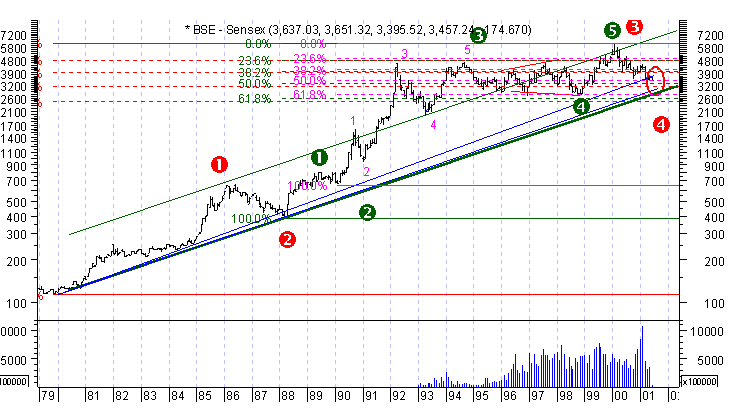
Chart 4-Sensex-semilog-Daily
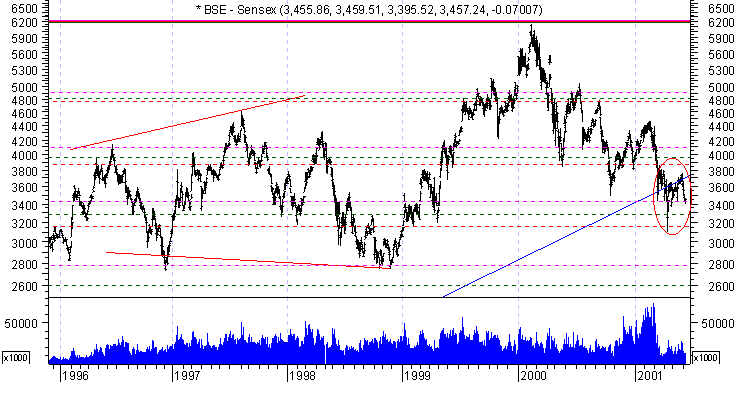
Chart 3 -Monthly-semi-log scale. The price line on the monthly and weekly Index is still above the 80 lows channel support within the elliptical area (red). But on Chart 4-daily-the Sensex is already under the channel and has failed on several occasions to bounce back above. It is now heading for the 61.8 % retracal from the 90 lows.
Summing up the charts are anything but bullish.
Probable Bear Market retracement levels-.
| Calculation basis | Peak / length | Correction | Extent | Target | Status | |
| Y2K high-Intra | 6150.6899 | 38.20% | 2349.564 | 3801.126 | achieved | |
| 6150.6899 | 50.00% | 3075.345 | 3075.345 | almost | ||
| 6150.6899 | 61.80% | 3801.126 | 2349.564 | |||
| Y2K high-Close | 5924.3101 | 38.20% | 2263.086 | 3661.224 | achieved | |
| 5924.3101 | 50.00% | 2962.155 | 2962.155 | |||
| 5924.3101 | 61.80% | 3661.224 | 2263.086 | |||
| Y2K Hi Intra less 79 low | 6037.4099 | 38.20% | 2306.291 | 3844.399 | achieved | |
| 6037.4099 | 50.00% | 3018.705 | 3131.985 | achieved | ||
| 6037.4099 | 61.80% | 3731.119 | 2419.571 | |||
| Y2K Hi Close less 79 low | 5811.0301 | 38.20% | 2219.813 | 3704.497 | achieved | |
| 5811.0301 | 50.00% | 2905.515 | 3018.795 | almost | ||
| 5811.0301 | 61.80% | 3591.217 | 2333.093 | |||
| Y2K Hi-intra less 88 low | 5760.6899 | 38.20% | 2200.584 | 3950.106 | achieved | |
| 5760.6899 | 50.00% | 2880.345 | 3270.345 | achieved | ||
| 5760.6899 | 61.80% | 3560.106 | 2590.584 | |||
| Y2K Hi-close less 88 low | 5534.3101 | 38.20% | 2114.106 | 3810.204 | achieved | |
| 5534.3101 | 50.00% | 2767.155 | 3157.155 | achieved | ||
| 5534.3101 | 61.80% | 3420.204 | 2504.106 | |||
| Y2K Hi-intra less 90 low | 5479.7699 | 38.20% | 2093.272 | 4057.418 | achieved | |
| 5479.7699 | 50.00% | 2739.885 | 3410.805 | achieved | ||
| 5479.7699 | 61.80% | 3386.498 | 2764.192 | |||
| Y2K Hi-close less 90 low | 5265.0101 | 38.20% | 2011.234 | 3913.076 | achieved | |
| 5265.0101 | 50.00% | 2632.505 | 3291.805 | achieved | ||
| 5265.0101 | 61.80% | 3253.776 | 2670.534 |
The above table specifies certain commonly observed retracement ratios. But which one is to be applied here and what will be the eventual bear market target.?
In the past ( ex: yrs 88,91,98) the Sensex has often retraced about 40 %. So far this market has broken past all 40% markers and a few 50% markers as per the table. While the remaining 50% ratio targets ( 2962 to 3157 points) would validate a bear market end, as stated above the current patterns shown by the Sensex price line ( Charts 2 and 4 ) indicate some more descent .
So I am inclined to look for a 61.8% correction. That gives a guidance between 2263 on the lower side and 2764 on the upper side. Within this my ideal target is a 61.8 % correction of the distance covered from the 88 lows to the 2000 highs, that being a classic Fibonacci ratio correction of cycle wave 3.The table shows the corresponding figures are 2504 and 2590 points. I would therefore be would be very very careful in pronouncing now that we are already in the beginning of a new Bull market.
How accurate or sure can we be of Wave perspectives?
Elliott Wave principle deals with a high order of probabilities .They include alternatives in patterns, ratios, time sequences and target levels. But the big picture never fails. When we put aside our emotional states and try an objective evaluation of the market action the Waves often give us an amazingly accurate picture.
In my own view held since commencing analysis of the BSE Index in Sept 2000 and repeated often in several forums including Chart postings and write-ups on this site ( refer Indian stocks archives section for regular updates since September 2000 to date), I have consistently maintained that BSE would retrace to between 2500 and 3200 levels. I had expected and projected a sideways moving market action in descending mode which is more or less accurate even in form. So in a sense the Big picture shown well in advance by Elliott's principle has already been accurate. After the March crash I took new guard and introduced the concept of 2266 being a low possibility in the 15th April posting.
All these pronouncements have been against the analysts's consensus, but that has not worried me. Looking at the continued optimism among quite a few Fund managers and magazine writers that the worst is over I feel the sentiment indicator may not have bottomed out yet. Volumes too need to come to a trickle before the bear's appetite is satiated. Planetary trend in the coming days (watch out for periodical updates of Astrological insights into markets) tells me Nature is in no hurry to shower us with prosperity or a Financial boom. Economy and Politics can only contribute to further negativism.
So all in all I would rather stick to my bearish stance.
End of write-up
subject to disclaimer on the Index page.
Readers may respond to [email protected]