Back to Main Page
My theory on trend in the stock market.
a) The mathematics of the market is Price/Volume/trendlines and channels. Not stochastic/rsi/moving averages.
b) A stock is always moving between two lines. Support and resistance.
Channeling
A channel is drawn by taking 3 points
Upward channel
a) Connect two lows of the same degree
b) Draw a parallel from the high
Downward channel
a) Connect a high and a lower high
b) Draw a parallel from the low in the middle to obtain targets.
In this example the price makes a higher low . You can then construct a trendline to project the higher high as long as the higher low holds. First connect the lows
Then draw the parallel from the high in between.


What is the trend?
The trend is nothing but these 2 trend lines.
If the lines are going up you have an uptrend
If the lines are flat you have a sideways consolidation
If the lines are down you have a downtrend
The channel will alert you of possible turns or acceleration of the move
IF an upward channel breaks to the upside you have the potential for a wave 3 up.
If an upward channel breaks to the downside it should alert you to a possible trend reversal.
Apply in reverse for downward movements.
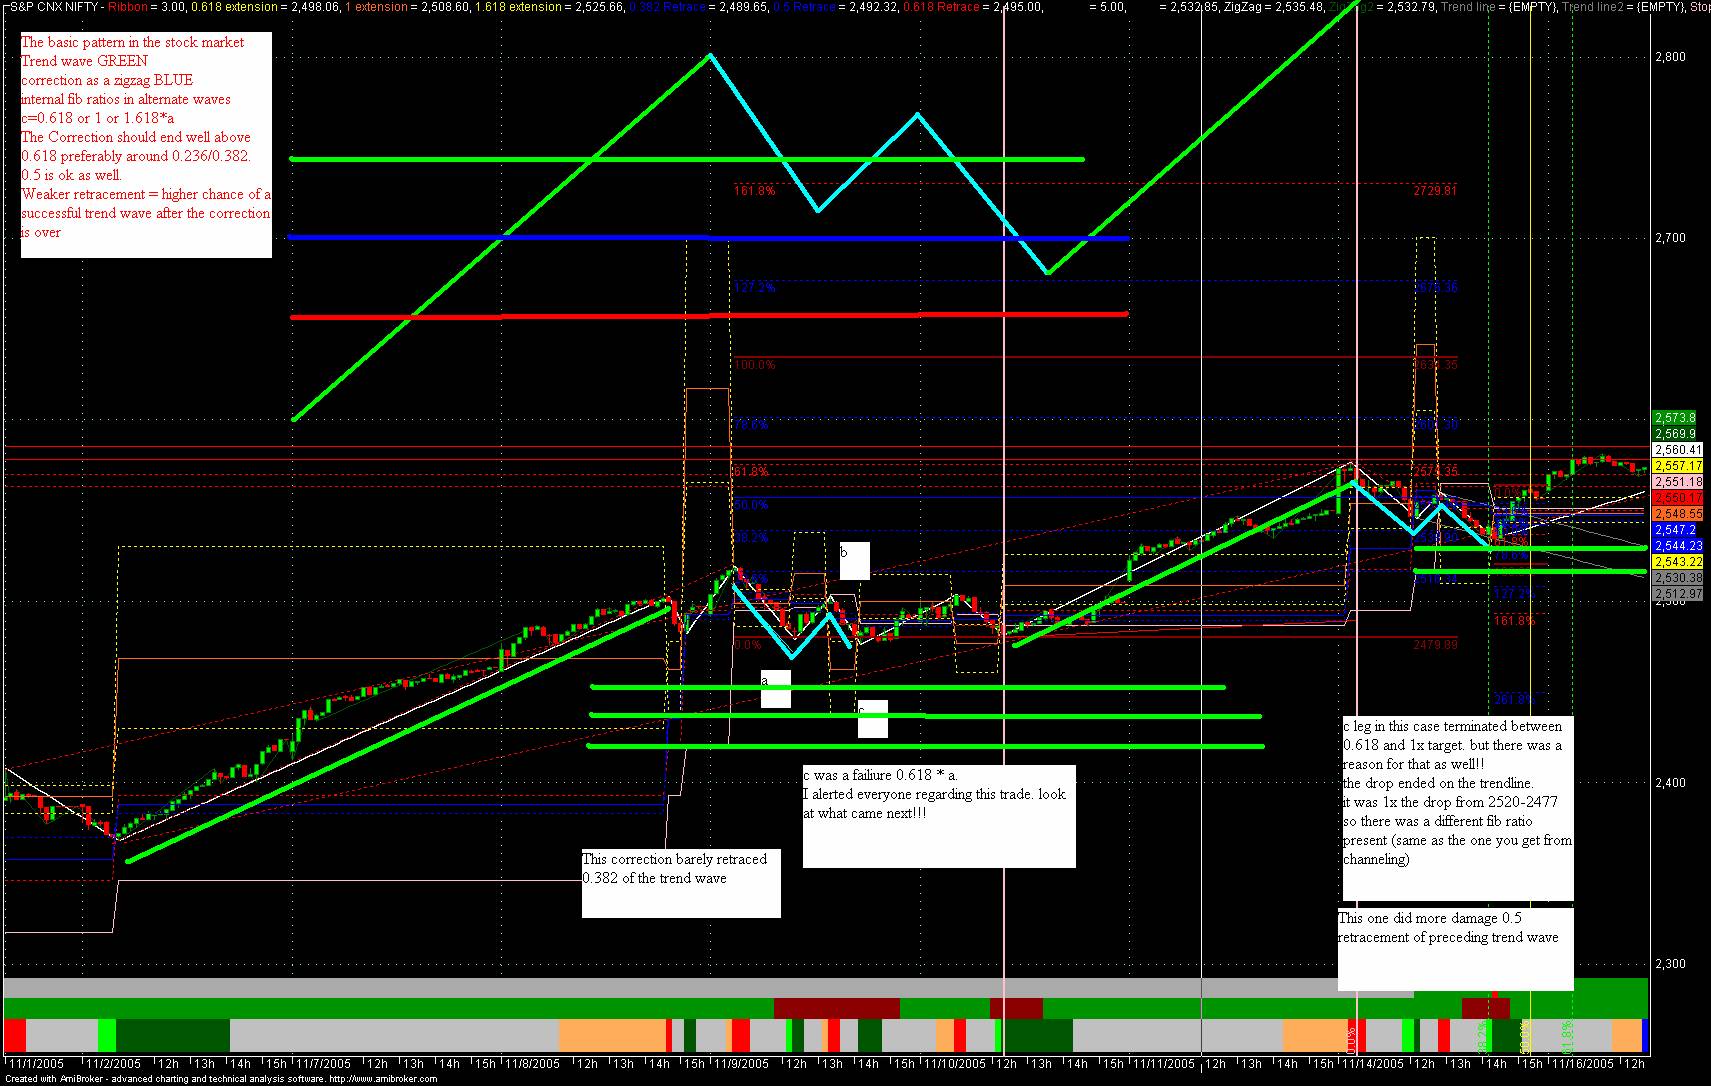
From the basic building block which is called a zigzag you can get more complex movements. As a trader, our goal is to trade the trend. We’re looking for the following trade setup. (This is ignoring EWT and more complex setups. The basic trade setup which every trader should know is.
This is without counting waves or anything. Just look at the price. In the timeframe you want to hold. See the main movement. See the counter trend interruption and when the correction ends you want to get back in with the trend. The key point is 2 or B should retrace less than 0.618 of A then you can hope for a healthy C wave.

Alternate wave equality:
Key relation ships to look for are
c=0.618 * a
or c=1*a
or c=1.618*a
if you’ve got c<=1.27*a you’ve got good probability of
success
wave 2 or wave B will retrace part of A but not A entirely
Potential supports for wave B will be
0.382
0.5
0.618
Of the rise from 0->A
Once 2 or B is completed
We can project targets by using the principle of alternate wave equality and channeling
C=0.618*A or C=1*A or C=1.618*A
(Note caps=larger degree, small=lower degree)

Now look at this trade setup carefully.
What are we looking for?
We want to see the price struggle to go down. When coming up, the price came up quickly from 0-1 in a straight line, in time x minutes.
We would like Wave B to retrace less than 0.618 of Wave A after x minutes from completion of wave A are over. This is a healthier way of watching trend than a moving average.
When going down you want to see a zigzag. The internal retrace of the zigzag is usually irrelevant, but if the internal retrace is higher then the probability that a correction is happening are higher. The more fib relationships you can spot the better your trade will be.
Then finally when the red trendline breaks you’ve got a signal to get in with what you hope is the trend. Your first target is the green channel line.
You can also use fib relationships to compute your targets.
Live example WHICH I DIDN’T TRADE J
My Indiabulls Rm spotted the trade and so did my automated analysis software
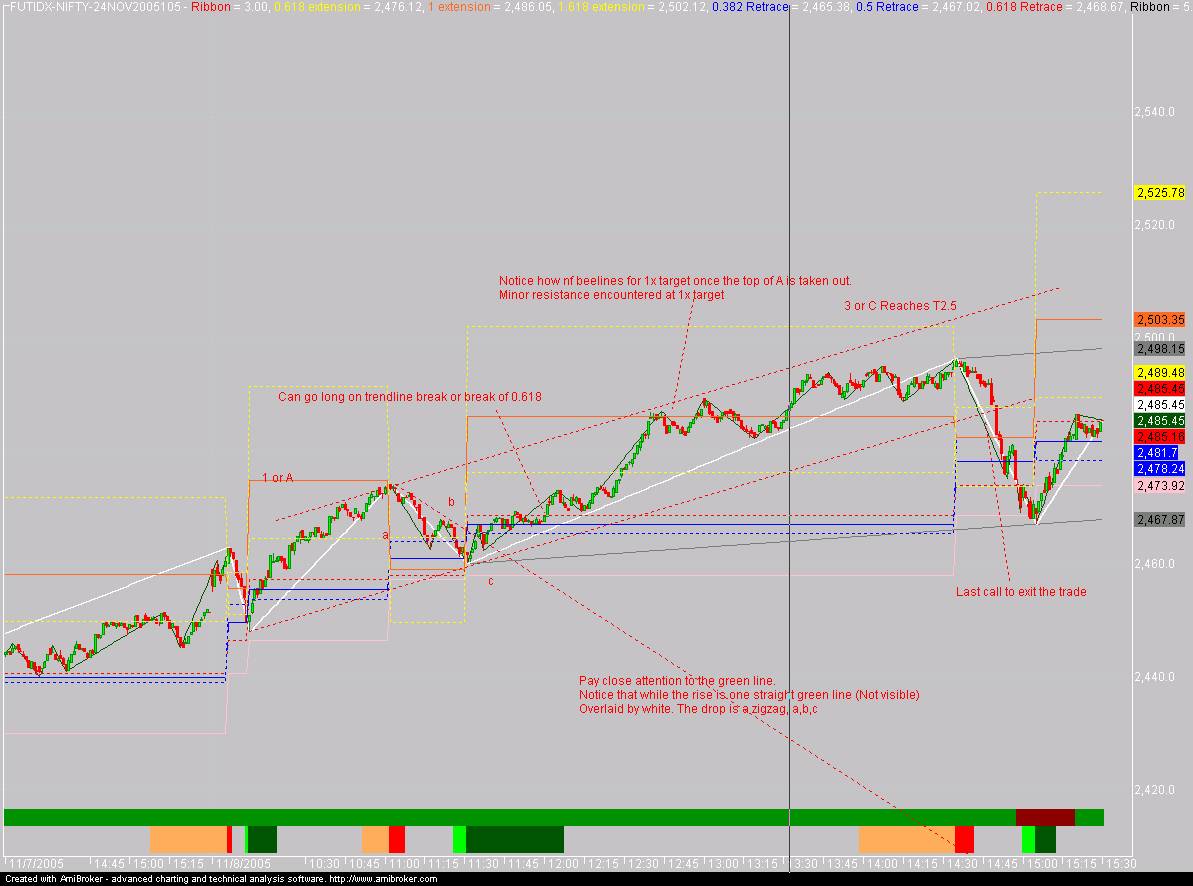
The automated analysis was as follows
Swing:Up
0:2,448.000
1:2,474.000
2:2,460.050
3:2,472.500
Retracement: 0.537
Extension: 0.479
T1:2476.12
T2:2486.05
T3:2502.12
Fib 0.618 Stop:2457.93
Buy 0.618 Stop:2467.2 (when 0.618 of the drop->abc or ii is taken out you have a signal to buy)
Risk/Reward T1=0.248362
Risk/Reward T2=0.930117
Risk/Reward T3=2.03308
Support Line:2461.03
Resistance Line:0
Open:2467.5, High:2472.7, Low:2467.5, Close:2472.5
Another live example
Auto analysis for first correction was as follows
Swing:Up
0:2,368.000
1:2,519.150
2:2,476.050
3:2,503.350
Retracement: 0.285
Extension: 0.181
T1:2569.46
T2:2627.2
T3:2720.61
Fib 0.618 Stop:2425.74
Buy 0.618 Stop:2450.55
Risk/Reward T1=0.851822
Risk/Reward T2=1.59578
Risk/Reward T3=2.79936
Support Line:2484.89
As you can see the retracement was extremely weak only 0.285
T1 proved sufficient resistance because this was a potential w5. (w5 was roughly equal to w1). Notice this was not a simple channel target. It was one of the more complicated targets which come from EWT. This channel target was based on 1->2-4. So I will not delve into it in greater detail here. Whether it was a w5 is tough to say. But the targets sure worked out.
Auto analysis for the second correction is as follows. Note the deeper correction and T1 has not yet been reached. Old Tops 2588/2591 may get in the way.
Swing:Up
0:2,476.050
1:2,576.750
2:2,534.600
3:2,579.800
Retracement: 0.419
Extension: 0.449
T1:2596.83
T2:2635.3
T3:2697.53
Fib 0.618 Stop:2514.52
Buy 0.618 Stop:2541.15
Risk/Reward T1=0.260907
Risk/Reward T2=0.850148
Risk/Reward T3=1.80343
Support Line:2544.54
Resistance Line:2599.95
(note that you never know whether your simple abc has ended or whether the correction is going to be more complex. So we keep 0.618 of the initial rise
I will add more to this doc later
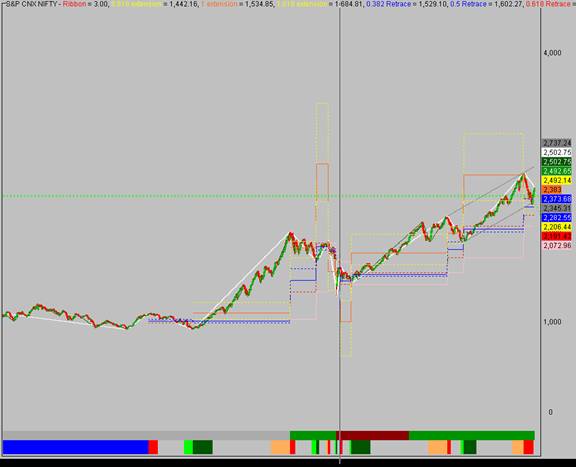
But for now check out these pictures to figure out what the nifty is doing in various degrees. In some the trend is down in some the trend is up.
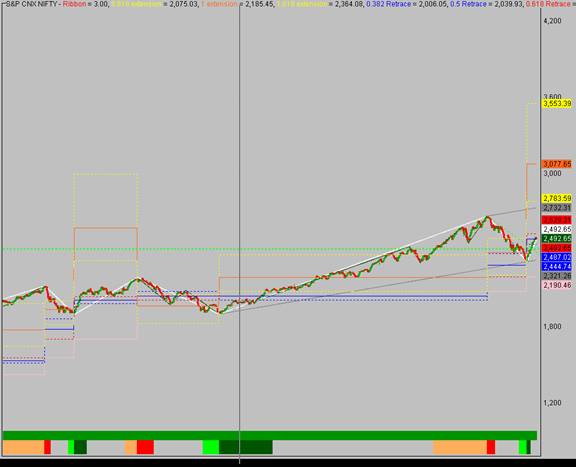
14 percent channel (lower line, 1805, upper line 2647) trend up as long as 1805 holds
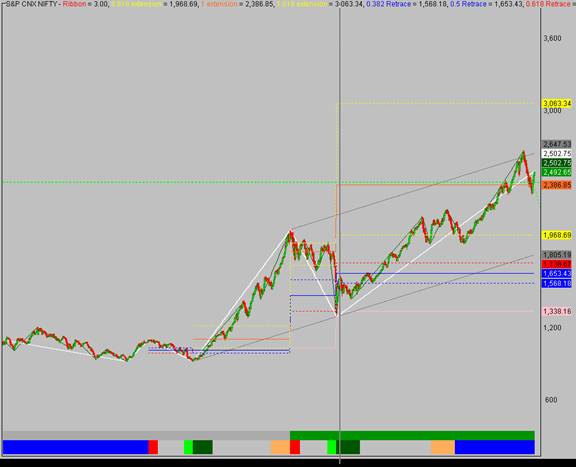
11 percent channel (upper line 2737 lower line 2345) trend up as long as 2345 holds
8 percent(upper line 2732, lower line 2321) trend up as long as 2321 holds
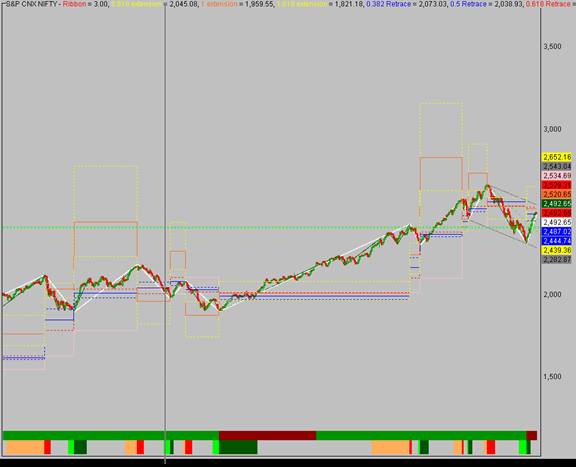
5 percent : upper line 2541 downtrend is intract as long as 2540 holds. Lower line 2280
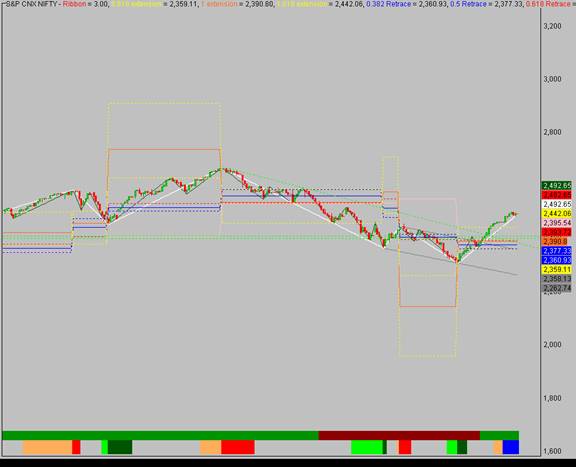
3 percent: upper line 2358 (break to upside happened earlier at 2390), lower 2282
1 percent: upper line 2548, lower line 2482, uptrend intact as long as 2482 holds.
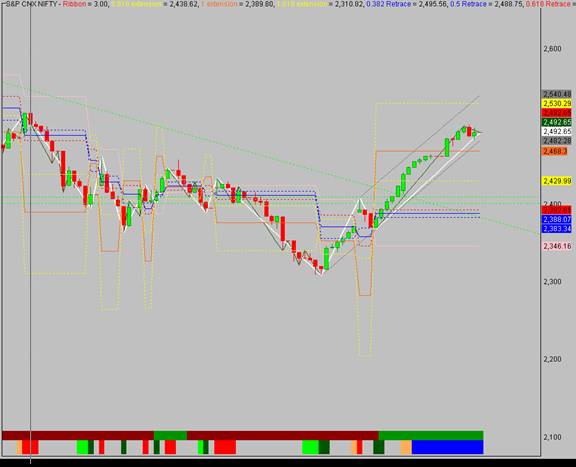
By using all these lines one can obtain a summary of supports/resistances and targets
A computer can analyze the ‘trend’ in all degrees and compute potential supports/resistances. If we can find a way to combine this information from various degree movements then we can arrive at probabilities for the next move.
I am now working on a program which can combine all this information to arrive at
Target (price/time)/stoploss (price/time)/ Probability of success
Elwave already does this and that too in a very complicated fashion but the program is too bullish for my tastes.
Elwave is always looking up and moving stoplosses down as the price falls.
It keeps saying that the downward move has ended prematurely presumably without analyzing for fib relationships.
Also remember that there can be a failure.
Your first warning sign is when c>1.27*a
Second sign is when 0.618 of the rise from 0-A breaks
And the final sign is when the stock breaks the old low itself.
The problem is that sometimes c leg itself may be more complex than a leg