 |
|
|
|
|
|
|
|
|
|
|
|
|
|
|
|
|
|
|
|
|
|
|
|
|
|
|
|
PHYSICAL TESTS |
|
|
|
In order to determine the Titanic steel's mechanical properties, it was subjected to tensile testing as well as the Charpy V-Notch Test, used to simulate rapid loading phenomena. These tests used samples that originated both parrellal and perpendicular to the original direction of the hull plate. |
|
|
|
TENSILE TESTING |
|
|
|
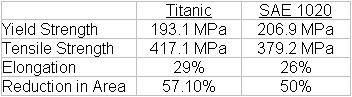
The specimen of hull steel used for the tensile testing was 0.625cm in diameter, and had a 2.5cm gage length. These were not, of course, the original dimentions of Titanics hull plate, but salt water from the ocean had corroded the steel and reduced the thinkness of the hull plate, meaning that it was not possible to test standard specimens from it.
The following table shows the results from the tensile testing on Titanic's steel. It also compares these results with tensile test data for an SAE 1020 steel, which is simular in composition. |
|
|
|
 |
|
|
|
The table shows that the steel from Titanic has a lower yield strength. This could be due to the fact that it has a larger grain size. Infact, tensile testing has shown that the Titanic steel has approximately one-third the impact strength of modern steel. The elongation increases more in Titanic steel, which again, is most likely due to its larger grain size. |
|
|
|
CHARPY IMPACT TESTS. |
|
|
|
Charpy impact tests were performed over a range of temperatures from -55 to 179 degrees celcius, on three seris of standard Charpy specimens. These were; a seris of specimens machined with the specimen axis parallel to the longitudinal direction in the hull plate from Titanic, a seris machined in the transverse direction, and a seris made, for comparison, from ASTM A36 steel. In preparation for the tests, the specimens were soaked in a chilling water bath or heated in a circulating air laboratory oven for about 20 minutes, until they reached the desired temperature. To make sure the tests were fair, pairs of identical specimens were prepared at the same temperature and an average of these two results was taken. |
|
|
|
 |
|
|
|
 |
|
|
|
|
|
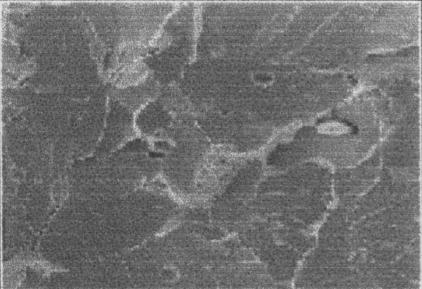
This is a scanning electron micrograph of a Charpy impact fracture surface, that has been newly created on a longitudinal section of Titanic hull steel, at 0 degrees celius. Clearly visable in the micrograph are the cleavage planes, shown by the grey lines. Particles of MnS can also be seen, this is the light grey oval shape on the right hand side of the micrograph. There are slip lines radiating away from this particle, indicating that it is easing the steels ability to fracture. |
|
|
|
|
|
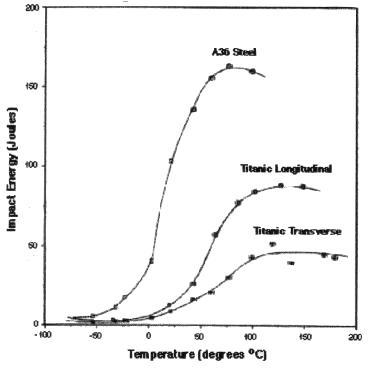
This is a graph plotting the impact energy against the temperature, for the three seris of specimens. It shows that at higher temperatures, all three specimens can withstand a lot more impact, although this is shown most dramatically for ASTM A36 steel, which has a very steep curve, and by far the best impact properties. The graph also shows that at lower temperatures, the impact needed to fracture both longitudinal and transverse sections of Titanic steel are about the same, but at higher temperatures, the longitudinal section has better impact properties.
The Charpy impact tests found that the ductile-brittle transition temperature determined at an impact energy of 20 joules is -27 degrees C for ASTM A36, 32 degrees C for longitudinal sections of the Titanic hull plate, and 56 degrees C for the transverse specimens. From these results, it was concluded that the steel used for the Titanic's hull was not suitable for use at low temperatures, which shows why a collision with an iceberg in a sea of temperature -2 degrees celcuis, was fatal to Titanic. |
|
|
|
 |
|
|
|
|
|
The final section of this report is a summary of my findings and my own conclusions about the research and information that I have presented. |
|
|
|
Conclusions |
|