|
|
INSTITUT TADBIRAN AWAM NEGARA |
|
| A service delivery approach to measuring facility performance in local government | ||
|
Nicola Brackertz, Russell Kenley |
||
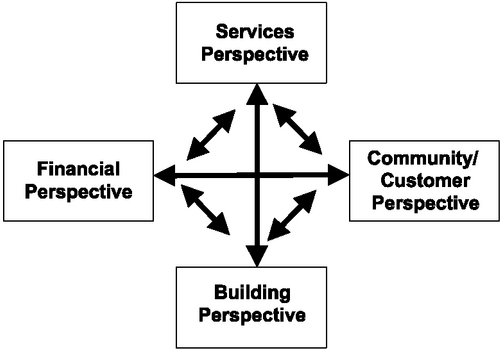
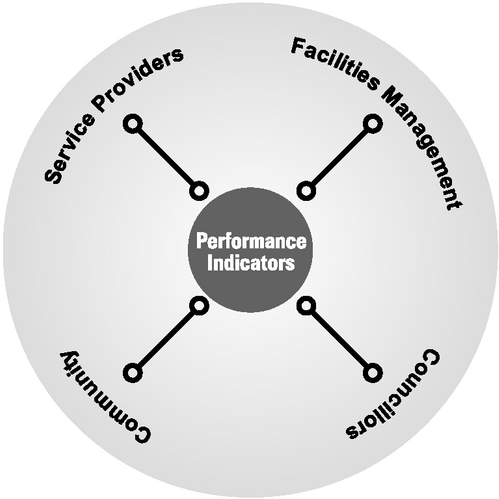
IntroductionLocal government authorities (LGAs) have difficulties managing their property and facilities strategically. On the surface, this problem is one of being able to persuade stakeholders to accept management decisions about the best way to deliver services through facilities, persuasion being required because of an inherent distrust in the system and the persistent belief in the community that changes in facility management equate to reductions in service. However, communication difficulties do not only occur with stakeholders external to the organisation. Internal stakeholders, too, have difficulties making themselves heard and communicating their needs as well as the reasons for their decision making. The problem is therefore one of communication of motives in an environment of distrust. The problem is exacerbated by the dichotomous structure of LGA management. Traditionally, those who service the community (the librarians, the health workers and the recreation coordinators) are separated from those who support the servers (the fleet and facility maintenance, central administration and strategic management). In fact, in recent times this split is often deliberately expressed, with terms such as the "client-provider split" becoming common in local government. Pivotal to these systems is the facility. Most services are provided through facilities, from town halls, through libraries to sports fields. It is in these facilities that LGAs' services and infrastructure intersect. Their management of such facilities therefore is crucial to the successful management of the LGA. Their strategic management is, in turn, vital to the strategic management and future performance of the authority. Conflict can arise in the satisfaction of strategic objectives when there are differences in view between stakeholders: the management, the maintenance, the service providers and the community. In an environment of distrust, such conflict seems inevitable. LGAs hold a large number of facilities that place demands on resources. They have a responsibility to use and maintain a wide range of property assets including classified and heritage buildings, single purpose facilities and state of the art multipurpose facilities. In addition, amalgamations may have caused many authorities to have surplus property assets that duplicate functions. Resources allocated to running and maintaining under-performing or superfluous facilities directly restrict the authority's ability to provide the community with better services. However, communities often perceive closures as a reduction in service and resist the closing of facilities. Perhaps driven by a distrust of economic rationalism, communities often doubt the motives of managers who wish to close or combine facilities. Councils often have difficulties communicating the reasons for decisions about facility closures to the community with accountability. This project arose in response to the question: "How do we remove the environment of distrust and provide information to the stakeholders which will empower management to make strategic decisions about the future of facilities?". The paper describes a pilot study conducted through a consultative process within an LGA in Melbourne, Australia. The aim was to develop a method to measure the performance of property assets in relation to the LGA's strategic aim of service delivery to the community. In other words, the authors set out to measure how successful the LGA's property assets were in supporting the delivery of services such as child care, libraries and sporting facilities to the community. Strategic management of facilities in the LGAIt is now generally considered best management practice to align the real estate function with the organisation's overall strategic aims and objectives. This idea first arose in the 1980s (Roulac, 1986; Roulac and Cameron, 1987), but only gained prominence in the early 1990s (Duckworth, 1992; Nourse and Roulac, 1993; Joroff et al., 1993; Weatherhead, 1997; O'Mara, 1999). The American term for this strategic way of managing real estate assets is "corporate real estate"; in Australia, the term "corporate property" may be more widely understood, particularly in a local government context. Aligning the management of property and facilities with the organisation's overall strategic aims and objectives can support the strategic aims in a proactive way, rather than being confined to the traditional role of providing space as the need arises - a reactive approach. To manage property assets in a strategic environment effectively, one must measure how well they support the organisation's overall aims and objectives. Traditional measurements of property performance are primarily financially based. Typically, such popular metrics[1] relate occupancy cost to m2, full-time employees, lease cost, lease income, capital expenditure, total revenue, total expenditure and so on. Another set of metrics is space related, for example, vacant space as percentage of total space, m2 per person, subleased space as percentage of total space and hours the facility is utilised. While these measures provide some indication of how the property asset is performing in financial terms, they are not able to indicate whether property contributes to the organisation's desired strategic outcomes. Traditional financially based metrics for property are particularly limiting when the organisation's strategic aims extend beyond increasing bottom line performance and improving shareholder value. LGAs, for example, primarily aim to deliver services to the community, rather than to make a profit. Simply measuring how property assets are performing financially will give no indication of how well they are suited to the LGA's strategic service delivery aims. It has been suggested that facility performance measures should relate to the main business indicators for the primary task, such as customer satisfaction or service delivery (Walters, 1999; Tranfield and Akhlaghi, 1995). However, applied models that link facility performance measurement to organisational strategy have, to date, been limited. Hinks and McNay (1999) have done work towards a management by variance tool, which identifies gaps in the perception of facility performance between the facilities management function and its internal customers. However, this tool does not address the issue of how facilities can support the processes that allow the organisation to fulfil its strategic aims. Pilot studyIn order to answer the question raised, the authors undertook a pilot study within a Victorian inner city LGA. The objective of the study was to develop a method of assessing non-profit driven facilities in LGAs, taking into account the strategic aim of service delivery. The aim was not only to develop a new model to measure facility performance according to strategic objectives, but also to provide a system that would allow informed, transparent and accountable decisions about property assets to be made. In line with this reasoning, the project involved an examination of community facilities to ensure their strategic and effective use. The underlying purpose was to ensure that facilities were held for strategic rather than political reasons, and to identify facilities that were under-performing in a number of key areas important to the LGA and the community. The focus of the facility evaluation was on service provision as a return on investment, with particular regard to the authority's key result areas (KRAs). The involvement of stakeholders was essential to the success of the project. As discussed, authorities tend towards a division of roles between facilities management and service providers. The pilot study involved representatives from each of these groups to canvass different views and to maximise transfer into management systems at the completion of the project. DesignIt has already been mentioned that performance measurement in a strategic environment must take into account financial as well as non-financial measurements. The approach developed for this study may be termed the service balanced scorecard (SBS) (see Figure 1). The SBS has its origins loosely in a tool from the general field of performance measurement. The balanced scorecard developed by Kaplan and Norton (1992) is a management tool that allows organisations to assess their overall performance in relation to strategic aims. It has become popular with industry because of its ability to combine a diverse set of performance measures that are aligned with the corporate mission. The central tenet is quite simple: performance must be measured against corporate aims balancing financial and non-financial perspectives. The balanced scorecard departs from traditional approaches to performance measurement in another way. Perhaps as a result of their financial basis, traditional measures are geared towards control; the balanced scorecard, however, is goal oriented and has vision and strategy at its centre. This study adopts the balanced scorecard's fundamental principle - namely, that performance must be assessed against the organisation's strategic aims - and applies it specifically to property. However, the implementation is quite different, in that the balanced scorecard scores by management opinion on a range scale, whereas the approach adopted here is to remove the reliance on management opinion (and potential bias) and seek independent quantitative and qualitative indicators of facility performance that have an open range. Another approach to real estate performance measurement using a scorecard system that integrates strategic aspects of real estate management has previously been developed by Apgar (1995a). However, his method differs from the SBS approach as it restricts itself to property and building related metrics, and does not include outcome oriented performance indicators (Apgar, 1995a, b; Apgar and Bellew, 1995). The SBS selects measures of performance to specifically reflect facility performance from a services context. Performance is evaluated from four different perspectives, balancing financial and non-financial measures to assess how property supports the delivery of services through the organisation's facilities. The SBS differs from Kaplan and Norton's model in another significant way. While they consider the generation of appropriate strategic performance measures to be a senior management function, the SBS takes a stakeholder approach. LGAs have a number of powerful stakeholder groups, with sometimes diverging interests and knowledge as to what constitutes facility performance. In order to provide a successful set of metrics, the SBS must account for the viewpoints of all of these stakeholder interests[2]. The main stakeholder groups are:
Figure 2 illustrates the mechanism required for maximum stakeholder input in developing performance indicators for each of the SBS's four perspectives. In designing facility performance measures, all stakeholder views should be considered equally; thus a great emphasis is placed on independent, quantifiable metrics. In a further departure from traditional attempts to measure facilities performance, data is not collected by facilities managers only - rather, all stakeholders provide information in a centralised database linked to the council's asset register. In this way, existing information about facilities can be linked to the new set of data required for the SBS, thereby minimising duplication of data entry. Once data collection is completed, each building is evaluated for each of the four perspectives: services, community, building and financial. From this the SBS develops a profile of each facility's performance which can be compared to like facilities within the organisation in a process similar to internal benchmarking. Balancing and evaluation of the four perspectives depends on the organisation's strategic objectives and is achieved through a process of weighting the four areas. The successful implementation of the SBS depends on:
Differential weighting of measures is a policy task that should be conducted by senior management with reference to the organisation's business goals. The weighting should reflect how important each of the four perspectives is in relation to the organisation's business aims, as such decisions influence how the performance of a facility is evaluated after the data collection has been completed (e.g. financial 20 per cent, building 20 per cent, services 30 per cent, customer 30 per cent). Potentially this weighted evaluation could also affect the design of new facilities. When implementing the SBS, the organisation must decide on a suitable set of performance indicators that reflect its corporate mission for each of these perspectives. It must therefore take into account stakeholder interests and consider that each stakeholder group has a view of the needs of the facility that incorporates different aspects of the four perspectives. For this pilot study, the stakeholders participated in a series of unstructured interviews designed to derive appropriate metrics to be tested on real facility data. The organisation's published KRAs were used as triggers for these sessions. In consultation with the LGA, a range of facilities were chosen for assessment with the SBS, including art galleries, reserves, community centres, playgrounds, elderly citizens' centres, child care centres, maternal and health care centres, club rooms and libraries. The resulting metrics combine qualitative and quantitative measures of facility performance. Taken together, these provide a comprehensive performance measurement system. It was determined that the desired attributes of a facility that performed well in terms of service delivery were:
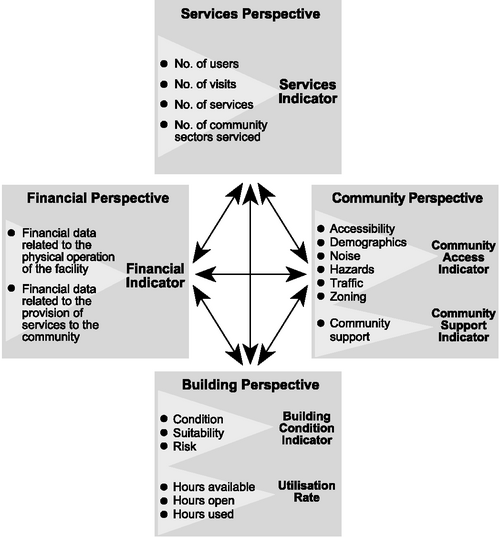
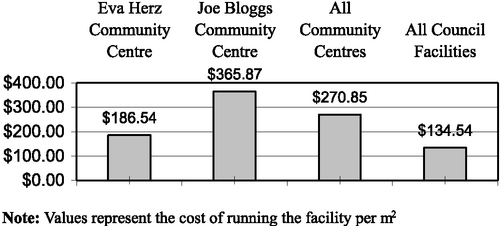
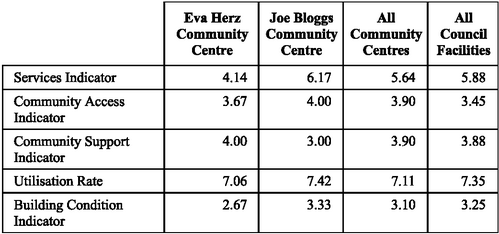
From these desired performance outcomes, a set of corresponding metrics was designed. After an initial period of testing, the system and the metrics were reviewed and revised in accordance with stakeholder feedback. ResultsAnecdotal evidence suggests that facility managers normally undertake facilities performance evaluation. However, for this study, the managers of the services being provided through the facilities were asked to provide the information about facility performance. The data was entered directly into a Microsoft Access database linked to the LGA's asset register. The database interface was designed like a questionnaire, and managers were prompted by questions regarding their facility at each data entry point. In this way, data could be collected in a central database, making use of already existing information on council's property[3]. The following is a description of the indicators used grouped by the four perspectives of the SBS. A discussion of the results obtained is included in each section (see also Figure 3). Financial perspectiveInitially, metrics in the financial perspective were broken down into:
This was done because stakeholders felt that it was important to account separately for the cost of running the building and the cost of running the service. This financial information was then calculated as a ratio of the gross building area (GBA). However, the first review of the pilot model found that, in collecting data about facilities, it was difficult to separate costs associated with the building and the service. Furthermore, it was decided that it was not useful to measure cost as a ratio of the GBA, as services were provided largely from existing building stock and as space rationalisation was not considered a high priority. As a result, the financial indicator was pared back to reflect only the total cost to council of providing the facility. Building perspectiveThe building perspective brings together several tangible aspects of facility performance. Utilisation rateThe utilisation rate assesses how well the facility is used in terms of time. This score does not include space-related measurements. Data collected are:
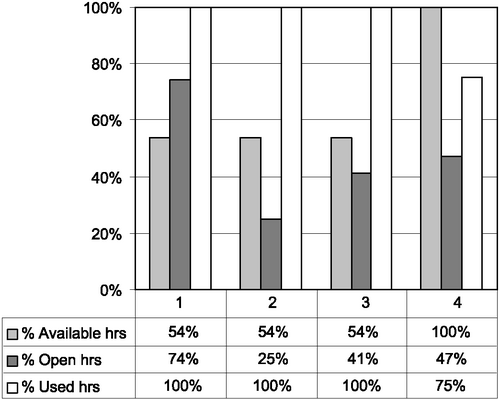
From these figures, the utilisation rate was calculated as a score out of ten. The review of the pilot showed that council considered it more useful to graph the three components of utilisation as a bar chart. In this way, the utilisation rate did not merely indicate whether or not a facility was performing well from the point of view of utilisation, but it was immediately obvious which aspect of utilisation was the cause of good or bad facility performance. The utilisation rate was revised to be recorded accordingly (see also Figure 4). Building condition and trend indicatorsThe building condition indicator assesses the physical condition of the facility, the associated risk, and its suitability in physical terms for the services it delivers. Managers were asked to rate for the following factors on a five-point scale ranging from "very poor" to "very good":
Averaging these three scores derives the building condition indicator. The building condition indicator is supplemented by the building condition trend indicator, which measures expectations of how the facility will develop in each of the three areas over the next five years on a similar five-point scale ranging from "get much worse" to "get much better". Averaging these three scores derives the building condition trend indicator. In combination, the building condition and building condition trend indicators show the state of current building factors and how these are expected to develop over the next five years. Services perspectiveThe aim of the services indicator is to determine how well the facility delivers services to the community in line with the LGA's objectives. The services indicator is a composite score that is derived from data relating to:
The above data was then measured as a ratio of the facility's GBA. The review of the initial measure showed that the LGA did not consider it useful to measure service performance as a ratio of space used. Some services (e.g. recreational facilities) require larger amounts of space to operate well. Because the services indicator was initially calculated as a ratio of service delivery to GBA, the relationship between service measurements and GBA was an inverse one. For example, if comparing the service indicators for two facilities, both of which have similar figures for service performance, but one of which operates from smaller premises, then the smaller facility appears to be performing better from a service perspective. LGA stakeholders felt that this distorted an evaluation of service performance, and preferred to measure service delivery as an absolute number independent of GBA. The measure was consequently revised to reflect only service performance in line with the LGA's strategic aim, disregarding the GBA. Another challenge encountered was that community groups often do not keep adequate records of their membership and usage patterns, and consequently the data provided is sometimes inadequate, thereby limiting the accuracy of the performance evaluation. Community/customer perspectiveTwo sets of metrics make up the community/customer perspective, both of which include indicators of expected future developments. Community access and trend indicatorsThe community access and trend indicator measures how well the facility and its location are matched to community needs and the services provided, and how accessible the facility is to the community. Managers were asked to evaluate the facility on a five-point scale ranging from "very good" to "very poor", for each of the following six factors:
Averaging the scores for the above six factors derives the community access indicator. In a second step, the community access indicator is complemented by the community access trend indicator, which measures how the facility would be expected to perform over the next five years. Managers were asked to estimate on a five-point scale ranging from "get much worse", to "get much better" how the facility would develop in relation to each of the six factors discussed above over the next five years. In conjunction, the community access and trend indicators provide a snapshot of how the facility is currently performing, and the anticipated direction of change over time in relation to its suitability and accessibility to the local community. Community support and trend indicatorsThe community support indicator measures the level of community involvement in terms of volunteer contribution. This score is considered to be an important measure of how well the service and the facility are accepted by the community, that is, how much ownership the community feels it has over the service and the facility. Managers are asked to assess the community's volunteer contribution on a five-point scale ranging from "very poor" to "very good". The community support trend indicator supplements the community support indicator. Managers were asked to estimate how the community's volunteer contribution would develop over the next five years on a five-point scale ranging from "get much worse" to "get much better". After the initial piloting period it was found that "volunteer contribution" was considered to be a confusing concept that was difficult to measure. Initially this was designed to gauge the level of community involvement; however, it was felt that "volunteer contribution" was not an adequate reflection of the community's acceptance of a council service. Aspects that were considered to be equally important were flow-on effects in terms of community building and the building of informal networks within the community. This confusion highlighted the need for concise descriptions and definitions that are understood by all parties contributing data to the service balanced scorecard. EvaluationOnce all relevant data was collected, facilities' performances were evaluated from a set of metrics centred on the desired performance outcomes. Based on the data collected above, facilities were evaluated by comparing the performance of facilities of a certain type with one another, as well as comparing facilities against the averages for all facilities surveyed in the study. In this way it can be established how one asset group is performing against all assets, and a ranking for facility performance within the asset group may also be established (see also Figure 5). An overall evaluation of how well a facility is performing against stated objectives depends on the weighting, mentioned earlier, that is attached to each of the four perspectives. This process of weighting the importance of each of the perspectives is conducted by senior management with reference to council's strategic goals. The weighting should be reflective of the importance of each of the four perspectives in relation to the organisation's business aims. The weighting influences how the performance of a facility is evaluated after the data collection has been completed. For example, the LGA may decide that the services perspective is the most important of the four perspectives, on an equal par with the community perspective, followed by the building perspective and finally the financial perspective (see also Table I). Consequently, a facility (or group of facilities) that is performing well on the financial and building perspectives, but not so well on the services and community perspectives, would be considered to be performing below its capacity. Conversely, a facility that rates well on the community and services perspectives, but that was losing money on the financial perspective, would still be considered to be performing well. Further researchIn its present state of development, the SBS allows performance to be evaluated only through a process of internal benchmarking of facilities. However, the research reported here is currently being expanded through cooperative support from other Victorian councils to further refine the indicators and method of the SBS. The expanded project develops a variation of the SBS called Logometrix (local government facilities - strategic performance measurement). It will develop and test the technique further and ultimately lead to a tool incorporating a centralised database that will allow councils to benchmark the performance of their facilities against other councils. There is also considerable potential to apply the technique in the corporate environment. Here the balanced scorecard is being adopted; however, there is interest in the application of this new approach because it allows for independent indicators and open-ended scales of assessment. ConclusionThe service balanced scorecard, piloted in this study, assists LGAs to remove the environment of distrust and to provide information to stakeholders that will empower management to make strategic decisions about the future of facilities. The SBS provides a new method for evaluating facilities linked to an authority's strategic aims. Performance measures derived using a stakeholder approach provide measures that are meaningful across business units and management levels. The advantage of this approach is that facilities are considered in line with the LGA's overall objectives, and performance indicators are reflective of the facilities' desired function. This means the SBS is not merely a tool that measures performance in building related terms, but it also provides the LGA with metrics that are reflective of the facilities' service function, and therefore a means of making accountable decisions. The involvement of the stakeholders in the development of the tool and the designed independence in scoring the indicators all act to reassure that strategic planning is based on sound strategy rather than political machinations. The benefit of this approach is that future facility-related decision making has a greater chance of receiving support from those it is intended to serve - the community. Notes
Figure 1 The SBS
Figure 2 Balancing stakeholder views
Figure 3 The SBS in action
Figure 4 Utilization rate
Figure 5 Financial indicator
Table I Weighted importance of indicators |
||
|
Taken from Emerald Fulltext Website |
||