|
|
INSTITUT TADBIRAN AWAM NEGARA |
|
| Supporting the balanced scorecard | ||
| Mark Sanger | ||
| Tunnel
vision is only useful in tunnels! On any journey, we need to know
where we have been, where we are going and how to get
there. The balanced scorecard concept, developed in the early 1990s,
recognizes the incompleteness of many business measurement processes
- too often totally reliant on financial measures. Financial
measures are useful - but they tend to measure the past - and they
tend to measure the easily-measurable. They are thus unbalanced
measures taking a particular view of a situation. They also often
tell us what has happened but fail to explain why it has happened.
They may suggest where things are going wrong, but again often fail
to highlight where things are going well. To analyze causes, it may
require managers to sift through significant amounts of data. This
inevitably means that some critical issues will not be identified,
and may mean that by the time causes are identified, it is too late
to make changes before the next measurement and reporting cycle. This suggests that a measurement regime, to be really effective, should include predictors of future behavior and performance, as well as offering comments on the past. Thus the measurement regime has to identify the "drivers" of performance in any situation. It also suggests that a measurement regime should include effective presentation of results as a key component; data should be presented in a simple, consistent form which allows readers to focus on the important issues. More data is not necessarily better! The data should highlight issues and help in assessing priorities. The balanced scorecard attempts to overcome the deficiencies of existing measurement systems - it is used to measure performance and develop strategies by analyzing results across a range of activities. At the very heart of the balanced scorecard method is the belief that organizational success can best be achieved and measured when viewed objectively from four perspectives:
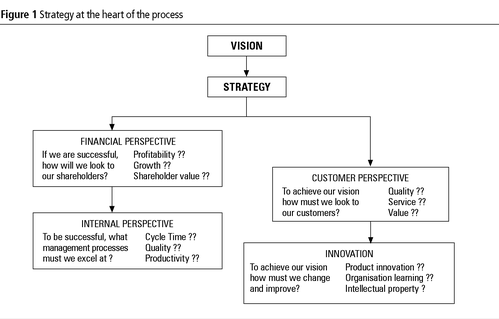
This well-rounded assessment provides management with a "balanced" view of the business. The concept was developed by Robert Kaplan of Harvard Business School and David Norton of the Renaissance Group. It was titled to reflect its attempt to provide a balanced presentation of both financial and non-financial measures. Unlike many management techniques and methodologies, the balanced scorecard concept avoids the over-dependence on simple "bean counting" - using only financial measure to determine success. It recognizes that operational measures - such as on-time delivery, order cycle time, product returns, etc. - should have an equal status with these more traditional financial measures. Often referred to as "leading indicators", these operational measures can often identify performance trends well in advance of crude profit and loss results. Derived from an organization's vision and mission, strategy is at the heart of the process (see Figure 1). The strategy determines what is to be measured. Measures - often referred to as key performance indicators (KPIs) - are those things which will be used to determine progress towards achieving the strategic aims. For example, if an organization's strategy is to improve customer relations, one thing it may wish to measure is the amount of face-to-face time its salespeople spend with customers each month. Or, if another includes improving employee skills, it may wish to measure the hours of continuing education and training undertaken each year per employee. The key to success with the balanced scorecard concept is the appropriateness and quality of the measures. Identifying measures which can track progress towards goals is often as hard as reaching the goals themselves. Some might ask why it is necessary - if we are making progress towards the goals, do we need to know? The important point, of course, is that we definitely need to know if we are not making progress towards our goals. However, as is true with most things in life, things of real value are often not easily attained. If the balanced scorecard has received criticism, it is related to the effort involved in its implementation. On completion of the identification of the KPIs, the organization must begin an ongoing cycle of measuring the KPIs, and analyzing the performance results data. Thus, implementing a balanced scorecard presents a set of challenges. However, as is also true in life, modern technology has risen to the occasion to provide the ability to automate both the implementation and maintenance of a balanced scorecard. This is a natural evolution of the concept - since it involves an iterative cycle of measurement and analysis of a relatively static set of indicators, it is natural to use technology to automate parts of the process. The technique has been around for several years, but only in the past year has interest in automating the process grown as many companies have established centralized in data warehouses that provide the corporate information necessary for a balanced scorecard analysis. Performance dataThe process of measuring performance data encompasses several tasks. The first step is to identify the sources of performance data. Such data may be of two kinds - internal and external. Internal data is information about internal financial and operational activities. It is captured throughout the course of day-to-day operations and is often contained within existing computer applications and databases. For example, financial, sales, service and other types of operational transaction-based data arise naturally in the daily routine of operations. Measures should be part of an identified cause and effect chain that represents the strategy of the organization. Productivity is a key objective under the internal process quadrant of the system and it is important to include reliable productivity measures as part of the overall regime. External data is information about the industry, about competitors, etc. Although reasonably easy to identify, capturing this data can present some interesting challenges. It usually comes from external industry analysis, and can increasingly be found on the World Wide Web. It also arises from benchmarking activity. Of course, the fact that performance data has been captured by an operational system does not mean that it is usable by scorecard software. The scorecard software may not be able to access data contained within the inventory files of a manufacturing application. Some balanced scorecard solutions require that all data be fed into a proprietary database before it can be used by the scorecard software. So, even though an inventory transaction captured important information, that information will have to be re-captured (re-entered) into the scorecard software. This is typically a manual process and only serves to exacerbate the difficulty and complexity of implementing a balanced scorecard solution. It will also deter the continued use of the scorecard since the tedium and cost of continually recapturing the data will take its toll on the enthusiasm for the technique. Therefore, it is highly desirable to implement a scorecard system that provides direct connections into your existing computer applications and databases. This allows the scorecard to retrieve such performance data automatically at regularly scheduled intervals. External data may be more difficult. While it will typically comprise only 10 per cent to 20 per cent of the input to the scorecard, it may be the most strategic in nature. External data is often not available electronically - in a standard database or file format. In such cases, it must be entered into a database or spreadsheet before it can be used by the scorecard system. If such data is available electronically, it can usually be imported by most scorecard systems. Again, it is highly desirable to select a scorecard system that can accept data from standard spreadsheet and ASCII file formats : this will dramatically reduce the amount of overhead required to implement the solution. Once performance data has been identified and captured, the "measurement" must be determined. This "model" will reflect the organizational strategy. The measurement model will:
Performance targetsThese should be flexible and determined by the strategy: for example, it may be desirable in some cases to establish targets based on a range of acceptable performance; in others it may be more appropriate to measure actual performance against planned performance. Normalize scores to agreed scalesBecause all balanced scorecards will possess a variety of disparate measures using different units, it is necessary to provide an easy way to integrate these. This is normally done by using a simple (say, 0-10) scale for each factor - and using a conversion process to convert actual measures to these normalized scores. The setting of the normalized score conversion points is very important. It does however make the results much more easily viewed by those with little detailed knowledge of the actual situation. For example, an average floor-to-floor time for a manufacturing cycle of four days is only good or bad when compared to some target - whether an internally imposed target, or a benchmark from competitors. When the actual is compared to the target and converted to a score of 8 out of 10, the performance can easily be assessed. Establish relative importance of, and weightings for, KPIsAs the scorecard is designed, there are obviously many factors which can be measured. Although many of these may be useful measures, some will be more important than others in determining overall wellbeing. This importance must be assessed and represented in a weighting. This weighting is applied to the score to establish the contribution of the activity/measure to the overall balanced score. Establish time periods for summariesSince performance targets are typically based on values for a given period, it is important that the scorecard system allow such periods to be specified within the measurement model. This enables performance targets to be set by day, week, month, etc. It also ensures that all KPIs are measured over the same period of time. Provision of commentaryCommentary is very important in ensuring a shared understanding and interpretation of results. Among other things, it will explain formulas that are used to calculate the various KPIs; describe the weightings used in compiling composite scores; and specify individual(s) who are accountable for each measure or area of measurement. A commentary may be provided in a variety of forms : the key is that it must be easily accessed and understood. Interpreting resultsThe balanced scorecard is not an end in itself: it exists only to show the way to future action. This requires interpretation of the results and the identification of what is good, what is bad, and what needs changing. This requires the data to be analysed and presented in a variety of ways. Scorecard automation systems normally provide the ability to view a variety of standard graphical formats. Each graphical format is particularly useful but in different ways. For example, bar charts are useful in comparing multiple values side-by-side, such as actual versus budget. Line graphs are particularly helpful for viewing trends over time. Pie charts can highlight percentage measurements very well. Additionally, some scorecard solutions offer the ability to view individual KPIs as a gauge or speedometer metaphor. Such graphical representation of the data is not, of itself, analysis. Analysis begins when the user is able to examine or investigate the data from a variety of perspectives. For example, when analyzing sales information, managers may need to view the data by region - and then by vendor - and then by salesperson - and then by month - and so on. This ability to investigate the data interactively by a few simple clicks of the mouse is very important. It provides the manager with a clearer understanding of why sales performance is good or bad. It will enable him/her to identify specific time periods, vendors, regions, etc. which are contributing to or detracting from successful attainment of performance targets. This knowledge will enable the manager to make better-informed decisions - a good diagnosis will lead to the right prescription. The technique is bound to become even more popular now that there are more efficient ways of implementing it. The major enterprise resource planning vendors, such as SAP, Baan and PeopleSoft, are all developing balanced scorecard applications. These will roll out in the next 12 months to provide easier routes to successful implementation. Additionally, the burden of applying the concept has been eased with the launch of a Web site that focuses on best practices for automation of the technique. Gentia Software and Renaissance Worldwide, a US consulting company, have started the Balanced Scorecard Technology Council, a virtual users' group hosting a Web site (www.balancdscorecard.com) that provides research, product information and a forum for ideas on successful implementations. IT managers can now use the Web site to enhance their use of balanced scorecard by other company executives. The time seems set for the balanced scorecard to be used more commonly and more effectively.
Figure 1 Strategy at the heart of the process |
||
| Taken from Emerald Fulltext Website | ||