Methods
As mentioned in the general introduction the experimental design behind the investigation, that of a post-impact assessment, involved setting up a sampling protocol within tourist and control areas at lodges of varying ages and with varying trail traffic histories. Rainforest mammals are difficult to observe, due to the thick vegetation and the inherently restricted visibility levels imposed by it. To investigate the diversity and abundance of mammals in such a way as to allow comparisons to be made between lodges a variety of direct and indirect sampling techniques were used; these included: transect censuses, quadrat sampling of mammal sign such as forage scrapings, and surveys of their tracks.
Transects
Transect sampling is a common technique for studying mammal populations, and received greatest effort in this study due to its ability to generate reliable comparative estimates of abundance. It can also provide a means of measuring differential visibility levels between different locations, and provides opportunities to collect ecological and behavioural data. Standard texts exist to help guide the investigator and provide informed critiques of the method (Buckland et al. 1993, Burnham et al. 1980, Brockelman et al. 1987, Peres 1999a). Furthermore, the data generated by transect censuses can now be rapidly and effectively analysed and compared to other studies using relatively new and powerful statistical and computational resources (Laake et al. 1994, Krebs 1999).
At each of the five lodges, parts of the trail system used for tourist excursions were identified and marked for use as transects, here-on referred to as tourist transects or T. A series of complementary transects were cut, here-on referred to as control transects or C, allowing us to sample forest well away from the tourist trails. Care was taken to site all transects within floodplain forest (mainly types B, D, E and F). C transects were traversed by humans very infrequently in comparison to T transects, which received almost daily visits of between 1 and 80 people throughout the period of the study. Variation in traffic intensity is related mainly to the season and the characteristics of the tour programs at each lodge.
Lodges were visited on 5 or 6 occasions for 18 days at a time between January 1997 and November 1998. The initial set of C transect censuses were conducted 48 hours after they were originally opened. During repeated visits over the entire study period very limited clearing of vegetation was required to maintain the C transects. The action of initially opening these transects had no apparent effect on mammal encounters.
2-3 T transects and 3-5 C transects were identified at each of the 5 lodges and marked at 25 m intervals, for a total of 11 and 17 transects, respectively. The total combined lengths were 18.7 km (T) and 20.7 km (C), respectively (Table 3.1). Peres (1999a) identified 4 km per transect as a standard practice for investigating Neotropical primate species. However in this study the average transect length was only 1.4 km. Smaller transect lengths were required because in most cases it was difficult to site long tourist transect within the floodplain forest types available.
Table 3.1. Number and total length of tourist and control transects at each lodge.
| Lodge | Tourist | Control | ||
No. of Transects |
Combined Length (km) | No. of Transects |
Combined Length (km) | |
| CAPH | 2 |
3.589 | 3 |
4.325 |
| EI | 3 |
3.000 | 3 |
3.000 |
| ECO | 2 |
4.700 | 5 |
5.725 |
| SACHA | 2 |
3.600 | 3 |
3.950 |
| TRC | 2 |
3.850 | 3 |
3.700 |
| Total | 11 |
18.739 | 17 |
20.700 |
The line-transect method (Burnham et al 1980, Brockelman et al. 1987) with slight alterations pertinent to rainforest environments [identified by Janzen & Terborgh (1980), Terborgh (1983), Whitesides et al. (1988), Buckland et al. (1993) and Peres (1999)], was implemented. The method involved two observers (although occasionally only one) who walked slowly and quietly along the centre-line of a transect at a rate of approximately 1 km/hr, stopping periodically to listen for the presence of mammals. On observing an individual, whether solitary or part of a group, up to 10 minutes was spent in situ recording data, such as: species; principal detection method (visual or auditory); time of day; height of the individual observed above the forest floor (m), in the case of arboreal species; distance along transect (m); straight-line observer-animal distance (m), to first animal sighted; sighting angle (degrees); number of individuals in group; group width (m); duration of visual contact (minutes); behaviour; presence or absence of young juveniles; and general comments. Some of these variables are illustrated in Figure 3.1.
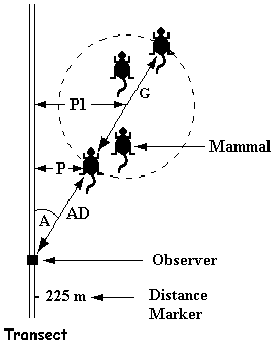 Figure 3.1. Schematic diagram of an encounter with a hypothetical mammal
group of four individuals, depicting key data types: AD = Straight-line observer-animal
distance to first animal sighted; A = Angle between transect and nearest mammal; G = Group
Spread (m); P = Perpendicular detection distance from transect to nearest mammal, P1 =
Perpendicular detection distance from transect to centre of mammal group, determined
through trigonometry (Equation 3.1).
Figure 3.1. Schematic diagram of an encounter with a hypothetical mammal
group of four individuals, depicting key data types: AD = Straight-line observer-animal
distance to first animal sighted; A = Angle between transect and nearest mammal; G = Group
Spread (m); P = Perpendicular detection distance from transect to nearest mammal, P1 =
Perpendicular detection distance from transect to centre of mammal group, determined
through trigonometry (Equation 3.1).
An individual was considered solitary if no other conspecifics were detected by sight during the 10 minute period it took to collect data. Distances were measured accurately to the nearest metre using a 50 m tape measure, although later in the study, as experience increased, distance estimation by eye was just as reliable for animals detected within 15 m of the observer. Surveys were initiated between 0500 - 0800 hrs and ended between 0700 – 1100 hrs, depending on the location and length of the transect. A survey was abandoned if rain fell continuously for more than 30 minutes, although data collected on distance travelled and mammals encountered before the rain was included in the dataset. During short interruptions for rain (<30 minutes) the observers remained stationary and completed the census after the rain had stopped. Consecutive censuses along any one transect were initiated at least 24 hours apart and direction of travel was reversed where possible.
During opportunistic encounters along the transects, which occurred whilst travelling to the starting point of a census or returning to the lodge afterwards, some of the aforementioned data was also collected, including: species; principal detection method (visual or auditory); distance along transect (m); straight-line observer-animal distance (m) to first animal sighted; sighting angle (degrees); number of individuals in group; and group width (m). This data was only used to analyse habitat visibility levels, species’ group spreads, and species’ group size (see Results).
Habitat and Fruit Resources
In any investigation of animal populations there is a need to study variations in the habitat in order to help account for variations in abundance. We chose to study the abundance of thirteen plant genera so as to get a better idea of the food and refuge resources available. Ten of the genera were of fruiting trees, of which four (*) are considered "keystones" providing important dry-season food resources for many mammals (Terborgh, 1983, 1986). These are: Iriartea* (Palmae), Scheelea* (Palmae), Astrocaryum* (Palmae), Ficus* (Moraceae), Pseudolmedia (Moraceae), Brosimum (Moraceae), Dipteryx (Fabaceae), Caryocar (Caryocaraceae), Jacaratia (Caricaceae), and Spondias (Anacardiaceae). The remaining three genera were observed to be important resources to many mammals under investigation either as an alternative food resource or as refuge. These included: Salacia (Hippocrateaceae), a fruiting liana; Phyllocarpus (Fabaceae), a red-flowering tree rich in nectar; and Guadua a genus of giant bamboo which in some areas can form tight impenetrable stands.
The absolute density of the genera selected was calculated by censusing trees in 25 x 50 m quadrats placed end-to-end along the transects. Only trees that had reached at least mid-canopy level were recorded. The sampling regime was adjusted for two genera: for Phyllocarpus the quadrat size was reduced to 25 x 25 m as the tree was difficult to identify visually from other genera at distances of more than 12.5 m; for Guadua, which has multiple stems per plant we only recorded the presence or absence of stems within the quadrats of 25 x 50 m.
Forage Scrapings
Along the length of the T and C transects a number of randomly placed rectangular shaped quadrats, each 100 m long and 4 m wide (area = 400 m2), were identified, marked, and monitored for forage scrapings. In total, 110 quadrats were distributed between all available transects. A forage scraping, was characterised by a small earth digging, a result of mammals foraging for below-ground resources such as roots, buried fruit and invertebrates. If less than 1 m separated a group of scrapings they was counted together. Each quadrat was searched independently by eye by walking slowly down the middle of the quadrat. The types of mammals that were most commonly responsible for these scrapings (from direct observation or track data) were: peccaries (Tayassu tajacu and T. pecari), south american coati (Nasua nasua), armadillos (Dasypus sp.), paca (Agouti paca), and brown agouti (Dasyprocta variegata).
Track Census
The nocturnal and elusive behaviour of many terrestrial mammal species made it necessary to study indirect signs of their presence by monitoring their tracks. Firstly, a selection of near-permanently muddy points along the length of the transects were identified, as these areas guaranteed adequate conditions for track surveying throughout most of the year. These we term track traps. In total, 102 track traps, distributed between all available transects, were identified and monitored for the duration of the study. Fallen leaves and debris were cleared from track traps on a regular basis to ensure that the ground conditions were optimal. Every time an observer passed one of these track traps during the course of a transect survey up to a minute was spent recording data on the tracks present, including: the species, the number of individuals (where possible), and whether the tracks were directed along or across the axis of the transect. After having collected the data all tracks were erased.
Tourists and Trail Traffic
Data on tourist visits per month to each lodge (except for ECO), and the characteristics of the tour programs available, for the period 1994-1998 were kindly provided by the administrative staff. Data from official registers kept by the local offices of INRENA and MITINCI regarding declared tourist visits to each lodge was also collected. Furthermore, at four lodges (CAPH, ECO, EI and TRC) a system of formal trail-use monitoring, consisting of daily records of excursions and trails used, was already in place or else developed to obtain more precision regarding tourist related traffic. Such data along with knowledge of trail-use patterns associated with each type of tour program was used to determine in detail the underlying traffic intensity along the tourist transects under investigation at each lodge.
Permanent Settlements and Hunting Pressure
The four lodges closest to Puerto Maldonado (CAPH, ECO, EI, SACHA) are located within an area of the TCRZ influenced by human colonisation and are relatively close to permanent settlements. Such colonisation of riparian habitats for agricultural purposes began about 25 years ago although the majority of the local farmers have settled the banks only in the last 10 years or so. A major implication associated with this process of colonisation, and which cannot be ignored in this investigation, is pressure from hunting. The TRC on the other hand is relatively isolated, has no permanent human settlements within 40 km, and is assumed not be affected by hunting. The impacts of hunting on Neotropical mammals have been widely documented (Peres 1990, 1996, 1999b, Ayres et al. 1991, Fragoso 1991, Mittermeier 1993, Bodmer et al. 1994, 1997, Hill et al. 1997, Maglianesi 1998, Noss 1998) and there is little doubt that it is one of the most significant impacts reducing local abundance of several species.
To determine the importance of tourist traffic as an impact variable, it was necessary first to establish which lodges and which species were most heavily affected by hunting. To measure relative hunting pressure, data was collected on the number of spent cartridges found near the transects and the number of encounters with local inhabitants armed with firearms, normally shotguns, along or near the transects during the course of the investigation. Such data were used to produce a hunting pressure index for each lodge. These indices would be compared against data gathered by Ascorra (1997) and against abundance data of the Spix’s Guan (Penelope jacquacu), a large cracid species reputedly very sensitive to hunting pressure (Peres 1990, Robinson et al. 1991, Silva & Strahl 1991). Data on this bird was collected in a similar fashion to that undertaken for mammals.