Habitat Data
A total of 1,386 trees were recorded and measured during the habitat surveys. Table 5.1 shows the mean values for all the habitat variables recorded in each forest type. All habitat variables differed significantly between the five sites (one-way ANOVA, * p < 0.05. Sample sizes unequal, harmonic mean values used). Density of trees was greatest in type F forest and type E/F forest (177 trees per hectare for both SACHA and TRC) while type B forest (ECO) had the lowest tree density. Larger and taller trees were recorded in type B forest, while the shorter trees with smaller dbh were recorded from type H forest. Type H forest also had the more open canopy vegetation cover and most dense mid-canopy vegetation cover. Canopy cover was more closed in type E/F forest (TRC), which also had a more open ground cover.
The E/F forest site at TRC had the highest overall percentage of palm trees recorded (31.9%), consistent with the findings in the mammal chapter, while type H forest contained the least number of palm trees (10.2%). Fewer trees, 28.8% of the total number recorded at TRC, supported dense tangles of vines or woody lianas, whilst 51.9 % or trees in type B forest did so.
Type F forest at SACHA showed the most dense ground and understorey vegetation cover. The dense understorey vegetation is probably due to the presence of Guadua weberbaueri bamboo stems. Table 5.2 summarises the bamboo understorey habitat at SACHA. This habitat covers approximately an area of 1.63 sq. km at this site. With a mean of 5.4 stems per 8 m x 8 m quadrat, bamboo stems account for 6.3 % of all plant stems > 0.02 m in dbh in each quadrat. This suggests that the bamboo is less dense here than at floodplain forest bamboo habitats at the EI and TRC (Kratter, pers. com.). The mean dbh of bamboo stems at SACHA was 0.03 m, also suggesting that the bamboo here is younger than the bamboo of E/F floodplain forest at the TRC (see Kratter, 1995b). This does not mean that it’s less structurally mature than the bamboo at TRC, given the full complement of bamboo indicator species recorded here (see Table 5.16) and at TRC but which are not recorded in the bamboo habitats of the EI.
Table 5.3 shows the results of the tree architecture classification. Type B forest at ECO shows the highest level of disturbance. Trees with scars from previous branch fall were more abundant in this forest type, as were the number (and overall percentage) of regenerating trees. Type H forest at the EI shows the second highest level of trees growing under more open canopy cover and loss of major branches, while the B/F forest at CAPH shows the third highest level. The forest types at SACHA and the TRC are structurally more indicative of primary forest habitats following the classification system. Fewer trees at both sites branch below half their height and fewer trees also have major scarring on their trunks.
Further evidence supporting the notion that type B forest experiences the highest level of disturbance can also be seen in table 5.4. On each of the repeat visits to the type B forest site during the last 12 months of the project, a few marked and monitored trees had died since the previous visit. Although an increase in the number of dead trees was recorded in four of the five forest types during the latter 12 months (Tables 5.5 to 5.7), in type B forest were new dead trees recorded at every return visit. The highest number of dead trees was recorded in type H forest (Table 5.8), which, along with the type B forest, showed the highest overall percentage of dead trees (5% for both sites). Only two repeat visits were allowed to the study site at EI, which were five months apart. In this time no trees were found to have died in this forest type (Table 5.8), whereas in type B forest, there was an increase in tree mortality (with the overall percentage of dead trees increasing from 3% to 4%).
Subsequent visits to CAPH were over a longer time period. Over a six month period between January and June 1998 there was a large increase in the number of new dead trees, and thus the overall percentage of dead trees in the study plot (Table 5.7). Its not known if this increase in the number of dead trees would have been recorded in an earlier visit to the site. This emphasises the one point of caution from drawing conclusions based on the small number of return visits to these plots and the time between each visit (see Discussion).
Table 5.1. Results of habitat variables associated with the point count stations within each type of forest; 1 Tree density is expressed in terms of large woody trees per hectare; * p < 0.05 (one-way ANOVA).
| Variable | . | CAPH |
EI |
ECO |
SACHA |
TRC |
| Predominant forest type | . | B/F |
H |
B |
F |
E/F |
| Total number of trees sampled | * |
240 |
300 |
289 |
297 |
260 |
| Tree density 1 | * |
160 |
177 |
119 |
128 |
177 |
| Number of palm trees | * |
52 |
32 |
44 |
85 |
83 |
| Trees with vines (%) | * |
41.7 |
43.0 |
51.9 |
35.4 |
28.8 |
| Distance from p. c. station (m) | * |
8.7 |
10.1 |
10.0 |
8.5 |
8.2 |
| Dbh (m) | * |
0.48 |
0.40 |
0.56 |
0.55 |
0.43 |
| Height (m) | * |
19.1 |
18.5 |
23.4 |
19.4 |
20.6 |
| Ground cover (%) | * |
29.8 |
19.5 |
20.3 |
35.0 |
17.1 |
| Low cover (%) | * |
39.2 |
41.5 |
37.2 |
50.3 |
29.4 |
| Mid-canopy cover (%) | * |
48.1 |
62.5 |
55.5 |
58.2 |
28.8 |
| Canopy cover (%) | * |
67.1 |
56.0 |
57.5 |
58.8 |
68.6 |
Table 5.2. Mean values of habitat variables per 8m x 8m quadrat, recorded in bamboo understorey of type F forest at SACHA.
| Variable | . | . | Variable | . |
| Number of quadrats | 30 | . | Number of non-bamboo stems | 80.7 |
| Total area surveyed (m2) | 1,926 | . | Live non-bamboo stems | 76.0 |
| Number of bamboo stems | 5.4 | . | Dead non-bamboo stems | 2.4 |
| Live bamboo stems | 4.0 | . | Dbh of bamboo stems | 0.03 |
| Dead bamboo stems | 1.4 | . | . | . |
Table 5.3. Results of tree architecture classification for each site.
| Variable | CAPH |
EI |
ECO |
SACHA |
TRC |
| Forest type | B/F |
H |
B |
F |
E/F |
| Total no. of trees measured (N) | 240 |
300 |
289 |
297 |
260 |
| No. of trees with branches above half height | 215 |
249 |
235 |
276 |
234 |
| % of trees with branches above half height | 90 |
83 |
81 |
93 |
90 |
| Above and with scars. No. (%) | 2 (1) |
11 (4) |
17 (6) |
2 (1) |
1 (1) |
| Above and without scars. No. (%) | 213 (89) |
238 (79) |
218 (75) |
274 (92) |
233 (90) |
| No. of trees with branches below half height | 24 |
36 |
46 |
11 |
16 |
| % of trees with branches below half height | 10 |
12 |
16 |
4 |
6 |
| Below with scars. No. (%) | 3 (1) |
3 (1) |
38 (13) |
0 (0) |
2 (1) |
| Below without scars. No. (%) | 21(9) |
33 (11) |
8 (3) |
11 (4) |
14 (5) |
Table 5.4. Summary of fruiting data and number of dead trees recorded from census stations in type B forest, during September 1997 to September 1998, at ECO.
| . | Oct. 97 |
Mar. 98 |
Jun. 98 |
Sep. 98 |
| Total number of fruiting trees (incl. palms) | 10 |
12 |
20 |
21 |
| Total number of flowering trees | 10 |
4 |
10 |
12 |
| Total number of fruiting palm trees | 4 |
8 |
8 |
4 |
| Number of dead trees | 8 |
11 (+3) |
13 (+2) |
14 (+1) |
Table 5.5. Summary of fruiting data and number of dead trees recorded from census stations in type F forest, during November 1997 to July 1998, at SACHA.
| . | Nov. 97 |
May 98 |
Jul. 98 |
| Total number of fruiting trees (incl. palms) | 24 |
42 |
35 |
| Total number of flowering trees | 15 |
14 |
36 |
| Total number of fruiting palm trees | 19 |
22 |
22 |
| Number of dead trees | 10 |
10 (+0) |
13 (+3) |
Table 5.6. Summary of fruiting data and number of dead trees recorded from census stations in type E/F forest, during December 1997 to August 1998, at the Tambopata Research Centre.
| . | Dec. 97 |
Feb. 98 |
Aug. 98 |
| Total number of fruiting trees (incl. palms) | 38 |
44 |
36 |
| Total number of flowering trees | 11 |
11 |
28 |
| Total number of fruiting palm trees | 32 |
35 |
18 |
| Number of dead trees | 7 |
11 (+4) |
11 (+0) |
Table 5.7. Summary of fruiting data and number of dead trees recorded from census stations in type B/F forest, during only two visits to CAPH during 1998.
| . | Jan. 98 |
Jun. 98 |
| Total number of fruiting trees (incl. Palms) | 1 |
13 |
| Total number of flowering trees | 2 |
5 |
| Total number of fruiting palm trees | 1 |
2 |
| Number of dead trees. | 1 |
5 (+4) |
Table 5.8. Summary of fruiting data and number of dead trees recorded from census stations in type H forest, during only two visits to EI, between October 1997 and April 1998.
| . | Oct. 97 |
Apr. 98 |
| Total number of fruiting trees (incl. palms) | 12 |
29 |
| Total number of flowering trees | 10 |
8 |
| Total number of fruiting palm trees | 5 |
19 |
| Number of dead trees. | 15 |
15 (+0) |
Tables 5.4, 5.5 and 5.6 show the data regarding the number of trees in fruit and flower during 3 or more visits to ECO, SACHA and TRC sites, respectively. As already mentioned, only two visits were made to the other two sites. Although the data is displayed in tables 5.7 and 5.8, the number of visits was judged to be unsatisfactory to build up a basic picture of the timing of fruiting in trees, in these forest types, during the last 12 months of the study.
In type B forest, at ECO, the number of fruiting trees was greatest during September 1998, which also corresponded to the greatest number of trees in flower (Table 5.4). 19% of all the trees recorded fruiting were palm trees. The number of fruiting trees recorded between each of the visits to the plot were almost significantly different (one-way ANOVA, F = 2.232, p = 0.08), while there was no significant difference in the number of trees recorded flowering (F = 1.493, p = 0.215). In type F forest at SACHA, the greatest number of fruiting trees was recorded in May 1998, while most trees seem to be in flower in July. Of the fruiting trees, 52% of them were palm trees. The number of fruiting trees recorded between each visit again was almost significantly different between each visit (F = 2.480, p = 0.08), while there was a significant difference in the number of trees flowering, between each visit (F = 6.698, p < 0.05). A significant difference in the number of flowering trees between each visit to the study plot in E/F forest at the TRC was also found (F = 5.777, p < 0.05), while there was no significant difference in the number of fruiting trees (F = 0.368, p = 0.692). The number of fruiting trees was highest in the second visit, in February 1998, 80% of these trees were palms. The highest number of trees in flower was recorded in August 1998.
Similarity between Forest Types
Figure 5.1 shows the results of a Discriminant Function Analysis on the measured habitat variables from each of the five forest types, as shown in table 5.1. DFA was used since all five forest types were predefined based on Phillips (1993). In order to test the similarity of the forest types based on the habitat variables mentioned, all variables were analysed for significant differences (one-way ANOVA, p < 0.05 see Table 5.1). Principle Component Analysis (PCA) was then used to compress the set of variables into a smaller set of derived components (Fielding, 1997). The result of the PCA analysis was the reduction of the data set to five components, explaining up to 65.4% of the variability. DFA was then conducted on these five components to give a final indication of the associations between each forest type.
The DFA produced four discriminant functions. The first two scores, DFA1 and DFA2 accounted for 60.0% and 26.4% of the variance respectively. DFA1 had high positive scores for the PCA components dominated by tree height (very tall trees), estimated % canopy cover (dense, closed canopy cover), estimated % understorey cover (dense understorey) and number of palm trees (high number of palm trees), while having a high score also for the height of the tree crown (point of bifurcation). DFA2 had high positive scores for tree height (very tall trees), and high negative scores for tree crown height (high number of trees developed under open canopy), estimated % canopy and understorey cover (open canopy cover and open understorey vegetation cover), and number of palms (small number of palm trees).
The PCA components were finally plotted against these two functions to produce Figure 5.1. By examining the clusters and the group centroids, it shows that the three floodplain forest types, type B/F at CAPH; type F forest at SACHA, and type E/F forest at the TRC, are the most similar, based upon the habitat variables mentioned. The two most distinct forest types are the Terra Firme Sandy Clay Forest (type H) of EI, and the Seasonally Flooded Swamp forest (type B) at ECO.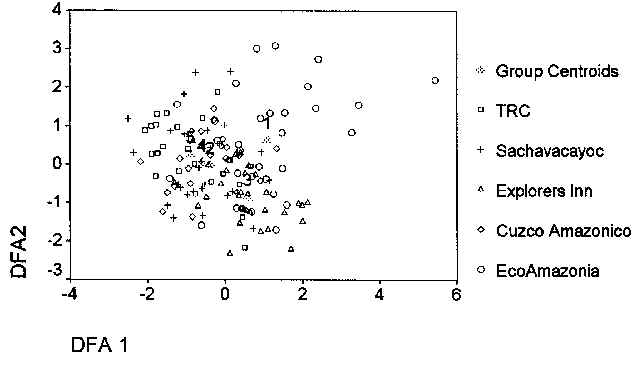
Figure 5.1. Habitat profiles, DFA 1 vs. DFA 2.
Bird Census
A total of 259 species were recorded over approximately 336 days of VCP and VDLT surveys, mist-netting and visual counts within the study plots and habitats under study at the five lodges. Of this total, 233 species were recorded during VCP surveys, corresponding to 18,107 contacts of 21,453 individual birds. Of these contacts, 94.4% were vocal contacts; visual contacts totalled just 1.1%, while birds that were seen and heard made up 4.5% of all contacts. 29.8% of contacts were birds recorded at mid-canopy level, 23.0% were birds located in the canopy, 21.7% were understorey contacts, while terrestrial bird contacts constituted 18.1%. The remaining 7.5% of birds were recorded flying above the canopy. [Species lists for the five lodges which include ad hoc observations of birds throughout the lodge are given in Appendix 2]. At the TRC, 180 bird species were recorded during VCP sampling, while 179, 177, 172 and 144 bird species were recorded at SACHA, EI, ECO, and CAPH, respectively. Figure 5.2 shows the species accumulation curves for VCP surveys over the number of repeated visits to each site. The number of new species recorded increases at each visit to each site, with the curve just failing to reach a significant plateau for any of the forest types.
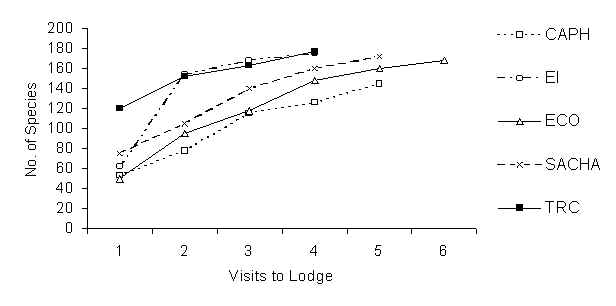
Figure 5.2. Species accumulation curves using VCP data only.
Table 5.9 shows the number of individuals recorded at the different times of the 21-month survey period. The greatest number of individual birds was recorded during the month of May 1997 and 1998, in the type B and F forests of ECO and SACHA. The greatest number of individual birds were recorded in April 1997, in type B/F forest of CAPH, in February 1998 in type E/F forest (TRC) and in October 1997, in type H forest, EI Reserve.
Table 5.9. Total number of individual birds recorded during VCP surveys, during each visit, for each of the five lodges.
| Lodge | Month |
Year |
Visit |
Number of Individuals |
| ECO | Jan. |
1997 |
1 |
562 |
| . | May |
1997 |
2 |
1389 |
| . | Oct. |
1997 |
3 |
758 |
| . | Mar. |
1998 |
4 |
1275 |
| . | Jun. |
1998 |
5 |
777 |
| . | Sep. |
1998 |
6 |
1144 |
| CAPH | Feb. |
1997 |
1 |
525 |
| . | Apr. |
1997 |
2 |
970 |
| . | Aug. |
1997 |
3 |
779 |
| . | Feb. |
1998 |
4 |
315 |
| . | Jun. |
1998 |
5 |
605 |
| EI | Mar. |
1997 |
1 |
537 |
| . | Jul. |
1997 |
2 |
697 |
| . | Oct. |
1997 |
3 |
1125 |
| . | Apr. |
1998 |
4 |
939 |
| SACHA | Mar. |
1997 |
1 |
782 |
| . | Jun. |
1997 |
2 |
1128 |
| . | Nov. |
1997 |
3 |
1233 |
| . | May |
1998 |
4 |
1306 |
| . | Jul. |
1998 |
5 |
512 |
| TRC | Aug. |
1997 |
1 |
629 |
| . | Dec. |
1997 |
2 |
1018 |
| . | Feb. |
1998 |
3 |
1186 |
| . | Aug. |
1998 |
4 |
684 |
Population Densities
Tables 5.10-17 show the absolute population densities of the indicator bird species for each of the forest types surveyed. Of the indicator species representative of seasonally flooded forest habitats, all 13 species were recorded at ECO although only 11 were actually observed in type B forest during the legal census periods the site, of these only 5 species had sufficient data to determine their density (Table 5.10). In the type B/F forest at CAPH, a total of 8 species were observed although only 7 species were recorded during legal censusing. Five species were not recorded at all in this forest type, during the five visits. Again, densities were calculable only for 5 species, the same four species found at ECO (Table 5.11). Of these four species, only C. cinereus is more abundant in type F/B forest.
Of the 35 lowland forest indicator bird species, more species were recorded during surveying in the more mature forests of SACHA and the TRC (31 and 30 respectively; 33 species in total for the two sites) than the other two sites, although the difference is small (Tables 5.12-15). The greatest number of measurable population densities were calculated from type H forest at EI (21 species, Table 5.13), with the lowest figure calculated from B/F forest at CAPH (Table 5.12). The lower population densities of bird species at CAPH is probably due to the smaller area of available habitat and the presence of the type B forest component in the habitat mosaic.
By examining the tables of population densities and from what we know of each of the forest habitats as described above, we can draw some raw conclusions regarding the abundance of the individual lowland forest indicator species, which are summarised below (other information is given in the section ‘Species Accounts’).
A number of indicator species clearly have a preference for Terra Firme Sandy-Clay forest (type H). These are T. guttatus, C. variegatus, S. rutilans, T. aethiops, P. rubrocapilla, while other species, M. menetriesii, M. myotherinus, although found in all the four forest types, are far more abundant in type H forest. Two other species, C. nobilis and M. campanisoma, have high estimated population densities in the more mature forests of SACHA and TRC. These species prefer floodplain forest types and are far more abundant in mature primary floodplain forests than disturbed forests. C. torquata, although abundant in all forest types, also has a higher population density in the two primary forest sites. However, O. stellatus was much more abundant in the other two more disturbed forest sites. D. cincta occurs at a naturally low population density in all forest types, and is naturally ‘rare’ Other species show a preference for floodplain forest types (D. certhia, S. caudacutus, F. colma, P. coronatus, H. rubrica) while some avoid forest mosaics with type B flooded forest (D. fuliginosa, X. spixii, M. marginatus).
A total of 14 and 13 bamboo indicator species were recorded during VCP surveys in Guadua bamboo habitats at SACHA and TRC, respectively (overall number of species totalled 17 and 19, respectively, Table 5.16 and 5.17). One species was not recorded at either site, Sporophila schistacea, due to the fact that the ecology of this rare seedeater is closely tied to the seeding ecology of Guadua bamboo thickets. Population densities were calculable for 12 bamboo indicator species at SACHA, while it was only possible to calculate densities for half that number at TRC. The simple reason for this was that only 5 census stations were located in E/F forest bamboo habitat at TRC, whereas over half the number of census stations at SACHA contained bamboo stems. This resulted in fewer contacts for bamboo indicator species at TRC. Of the six comparable densities, C. sanctaemariae and S. ucayalae were found to be denser in the E/F forest bamboo habitat, than in type F forest bamboo.
Table 5.10. Population densities of Flooded Tropical Evergreen Forest indicator species, in type B forest, ECO. Densities are expressed as number of individuals per km2; + recorded during VCP surveys, but insufficient number of contacts to produce density estimate; - not recorded during VCP sampling, but recorded elsewhere at the lodge, during general observations; X recorded during mist-net captures only; NR not recorded at this site. Census Method: VCP Variable Circular Plot Method; VDLT Variable Distance Line Transect Method; MN Mist-netting; DC Direct Counts; GO General Observations.
| Indicator Species for Flooded Tropical Evergreen forest at ECO – Type B forest | Population Density |
Census Method |
| Crypturellus bartletti | 25.9 |
VDLT |
| C. cinereus | 0.6 |
VCP |
| Agami agami | - |
GO |
| Leucopternis schistacea | + |
DC |
| Aramides cajaena | + |
VDLT |
| Eurypyga helias | - |
GO |
| Phaethornis hispidus | 6.7 |
MN |
| Hypocnemoides maculicauda | + |
VCP |
| Sclateria naevia | + |
VCP |
| Hylophylax punctulata | X |
MN |
| Schiffornis major | + |
VCP |
| Pipra fasiicauda | 35.2 |
VCP, MN |
| Turdus hauxwelli | 30.7 |
VCP |
Table 5.11. Population densities of Flooded Tropical Evergreen Forest indicator species, in type B/F forest, CAPH lodge
| Indicator Species for Flooded Tropical Evergreen forest at CAPH – Type B/F forest | Population Density |
Census Method |
| Crypturellus bartletti | 19.9 |
VCP |
| C. cinereus | 0.6 |
VCP |
| Agami agami | NR |
GO |
| Leucopternis schistacea | + |
DC |
| Aramides cajaena | - |
GO |
| Eurypyga helias | NR |
GO |
| Phaethornis hispidus | 4.6 |
MN |
| Hypocnemoides maculicauda | NR |
VCP |
| Sclateria naevia | + |
VCP |
| Hylophylax punctulata | NR |
MN, GO |
| Schiffornis major | NR |
VCP |
| Pipra fasiicauda | 9.8 |
VCP, MN |
| Turdus hauxwelli | 9.4 |
VCP |
Table 5.12. Population densities of Lowland Forest indicator species, in type B/F forest habitat, at CAPH lodge.
| Indicator Species for Lowland forest at CAPH – Type B/F forest | Population Density |
Census Method |
| Tinamus guttatus | - |
GO |
| Crypturellus strigulosus | NR |
VCP, GO |
| C. variegatus | + |
VCP |
| Micrastur gilvicollis | + |
DC |
| Mitu tuberosa | NR |
VCP |
| Odontophorus stellatus | 11.0 |
VCP |
| Psophia leucoptera | - |
GO |
| Phaethornis phillipii | x |
MN |
| Malacoptila semicincta | 1.3 |
MN |
| Dendrocincla fuliginosa | 1.3 |
VCP, MN |
| D. merula | 15.8 |
MN |
| Dendrocolaptes certhia | 1.5 |
VCP |
| Xiphorhynchus spixii | + |
VCP, MN |
| Synallaxis rutilans | + |
VCP |
| Automolus infuscatus | 1.3 |
VCP |
| Sclerurus caudacutus | 2.0 |
VCP |
| Thamnophilius aethiops | NR |
VCP, GO |
| Thamnomanes ardesiacus | 31.4 |
VCP |
| Myrmotherula haematonata | 4.6 |
MN |
| M. hauxwelli | 7.0 |
VCP |
| M. leucophthalma | 4.1 |
VCP, MN |
| M. longipennis | 4.6 |
VCP |
| M. menetriesii | 14.7 |
VCP |
| Dichrozona cincta | + |
VCP, MN |
| Myrmoborus myotherinus | 10.5 |
VCP |
| Gymnopithys salvini | 12.5 |
MN |
| Formicarius colma | NR |
VCP, GO |
| Chamaeza nobilis | - |
GO |
| Myrmothera campanisoma | + |
VCP |
| Conopophaga peruviana | 5.3 |
MN |
| Corythopis torquata | 14.7 |
VCP |
| Platyrinchus coronatus | 10.5 |
VCP |
| Pipra rubrocapilla | NR |
VCP, GO |
| Microcerculus marginatus | 0.5 |
VCP |
| Habia rubrica | 5.3 |
VCP |
Table 5.13. Population densities of Lowland Forest indicator species, in type H forest habitat, at EI.
| Indicator Species for Lowland Forest at EI – Type H forest | Population Density |
Census Method |
| Tinamus guttatus | 13.3 |
VCP |
| Crypturellus strigulosus | NR |
GO |
| C. variegatus | 1.8 |
VCP |
| Micrastur gilvicollis | + |
DC |
| Mitu tuberosa | - |
GO |
| Odontophorus stellatus | 40.8 |
VCP |
| Psophia leucoptera | - |
GO |
| Phaethornis phillipii | X |
MN |
| Malacoptila semicincta | + |
MN |
| Dendrocincla fuliginosa | 2.7 |
VCP, MN |
| D. merula | 10.5 |
MN |
| Dendrocolaptes certhia | 0.6 |
VCP |
| Xiphorhynchus spixii | 1.9 |
VCP |
| Synallaxis rutilans | 7.4 |
VCP |
| Automolus infuscatus | 2.5 |
VCP |
| Sclerurus caudacutus | 3.0 |
MN |
| Thamnophilius aethiops | 8.0 |
VCP |
| Thamnomanes ardesiacus | 15.8 |
VCP |
| Myrmotherula haematonata | NR |
VCP, MN, GO |
| M. hauxwelli | 8.9 |
VCP |
| M. leucophthalma | 3.5 |
MN |
| M. longipennis | 10.9 |
VCP |
| M. menetriesii | 11.1 |
VCP |
| Dichrozona cincta | + |
VCP |
| Myrmoborus myotherinus | 48.0 |
VCP |
| Gymnopithys salvini | 16.0 |
VCP, MN |
| Formicarius colma | 3.7 |
VCP |
| Chamaeza nobilis | NR |
VCP, GO |
| Myrmothera campanisoma | 2.5 |
VCP |
| Conopophaga peruviana | + |
MN |
| Corythopis torquata | 12.9 |
VCP |
| Platyrinchus coronatus | + |
VCP, MN |
| Pipra rubrocapilla | 5.7 |
VCP |
| Microcerculus marginatus | 12.3 |
VCP |
| Habia rubrica | 2.2 |
VCP |
Table 5.14. Population densities of Lowland Forest indicator species, in type F forest habitat, at SACHA.
| Indicator Species for Lowland Forest at SACHA – Type F forest | Population Density |
Census Method |
| Tinamus guttatus | + |
VCP |
| Crypturellus strigulosus | NR |
GO |
| C. variegatus | + |
VCP |
| Micrastur gilvicollis | + |
DC |
| Mitu tuberosa | - |
GO |
| Odontophorus stellatus | + |
VCP |
| Psophia leucoptera | + |
VDLT, VCP |
| Phaethornis phillipii | - |
GO |
| Malacoptila semicincta | + |
VCP, MN |
| Dendrocincla fuliginosa | 1.2 |
VCP, MN |
| D. merula | 4.0 |
MN |
| Dendrocolaptes certhia | 1.0 |
VCP |
| Xiphorhynchus spixii | 1.3 |
VCP |
| Synallaxis rutilans | + |
VCP |
| Automolus infuscatus | + |
VCP |
| Sclerurus caudacutus | 1.4 |
VCP, MN |
| Thamnophilius aethiops | + |
VCP |
| Thamnomanes ardesiacus | 16.2 |
VCP |
| Myrmotherula haematonata | NR |
VCP, MN |
| M. hauxwelli | 7.4 |
VCP |
| M. leucophthalma | 2.3 |
MN |
| M. longipennis | 13.0 |
VCP |
| M. menetriesii | 33.6 |
VCP |
| Dichrozona cincta | + |
VCP |
| Myrmoborus myotherinus | 11.8 |
VCP |
| Gymnopithys salvini | 3.3 |
MN |
| Formicarius colma | 15.8 |
VCP |
| Chamaeza nobilis | 1.4 |
VCP |
| Myrmothera campanisoma | 6.0 |
VCP |
| Conopophaga peruviana | 4.5 |
MN |
| Corythopis torquata | 28.6 |
VCP |
| Platyrinchus coronatus | 3.9 |
VCP |
| Pipra rubrocapilla | + |
VCP |
| Microcerculus marginatus | 10.7 |
VCP |
| Habia rubrica | 4.2 |
VCP |
Table 5.15. Population densities of Lowland Forest indicator species, in type E/F forest habitat, at Tambopata Research Centre.
| Indicator Species for Lowland Forest at TRC– Type E/F forest | Population Density |
Census Method |
| Tinamus guttatus | 1.6 |
VCP |
| Crypturellus strigulosus | NR |
GO |
| C. variegatus | NR |
VCP |
| Micrastur gilvicollis | + |
DC |
| Mitu tuberosa | 8.2 |
VDLT |
| Odontophorus stellatus | + |
VDLT, VCP |
| Psophia leucoptera | + |
VDLT, VCP |
| Phaethornis phillipii | - |
GO |
| Malacoptila semicincta | + |
VCP, MN |
| Dendrocincla fuliginosa | 1.4 |
VCP, MN |
| D. merula | 1.8 |
MN |
| Dendrocolaptes certhia | 0.6 |
VCP |
| Xiphorhynchus spixii | 5.8 |
VCP |
| Synallaxis rutilans | + |
VCP |
| Automolus infuscatus | 3.0 |
VCP |
| Sclerurus caudacutus | 1.8 |
MN |
| Thamnophilius aethiops | + |
VCP |
| Thamnomanes ardesiacus | 11.4 |
VCP |
| Myrmotherula haematonata | + |
MN |
| M. hauxwelli | 11.1 |
VCP |
| M. leucophthalma | 1.8 |
MN |
| M. longipennis | 14.8 |
VCP |
| M. menetriesii | 20.1 |
VCP |
| Dichrozona cincta | 0.3 |
VCP |
| Myrmoborus myotherinus | 26.2 |
VCP |
| Gymnopithys salvini | 10.1 |
VCP, MN |
| Formicarius colma | 5.4 |
VCP |
| Chamaeza nobilis | 1.6 |
VCP |
| Myrmothera campanisoma | 5.1 |
VCP |
| Conopophaga peruviana | 1.8 |
MN |
| Corythopis torquata | 30.1 |
VCP |
| Platyrinchus coronatus | + |
VCP |
| Pipra rubrocapilla | - |
GO |
| Microcerculus marginatus | 11.4 |
VCP |
| Habia rubrica | 6.7 |
VCP |
Table 5.16. Population densities of Bamboo indicator species, located in type F forest bamboo habitat, at SACHA (* = number of pairs)
| Indicator Species for Bamboo at SACHA– Type F forest | Population Density |
Census Method |
| Dromococcyx pavoninus | - |
GO |
| Nonnula ruficapilla | - |
GO |
| Monasa flavirostris | - |
GO |
| Campylorhamphus trochilirostris | + |
VCP, MN |
| Simoxenops ucayalae | 4.7 |
VCP |
| Anabazenops dorsalis | + |
VCP |
| Automolus melanpezus | 12.4 |
VCP |
| Cymbiliaimus sanctaemariae | 6.2 |
VCP |
| Myrmotherula iheringi | 3.8 |
VCP |
| Myrmotherula ornata | 2.6 |
VCP |
| Microrhopias quixensis | - |
GO |
| Drymophila devillei | 42.3 |
VCP |
| Cecromacra manu * | 3.7 |
DC |
| Percnostola lophotes | 48.3 |
VCP |
| Myrmeciza goeldii | 31.1 |
VCP |
| Poecilotriccus albifacies | 4.4 |
VCP |
| Hemitriccus flammulatus | - |
GO |
| Ramphotrigon fuscicauda | 4.3 |
VCP |
| R. megacephala | 13.1 |
VCP |
| Sporophila schistacea | NR |
GO |
Table 5.17. Population densities of Bamboo indicator species, located in type E/F forest bamboo habitat, at the Tambopata Research Centre (TRC) (* = number of pairs)
| Indicator Species for Bamboo at TRC– Type E/F forest | Population Density |
Census Method |
| Dromococcyx pavoninus | - |
GO |
| Nonnula ruficapilla | NR |
GO |
| Monasa flavirostris | - |
GO |
| Campylorhamphus trochilirostris | 1.4 |
MN |
| Simoxenops ucayalae | 7.7 |
VCP |
| Anabazenops dorsalis | + |
VCP |
| Automolus melanpezus | + |
VCP |
| Cymbiliaimus sanctaemariae | 8.1 |
VCP |
| Myrmotherula iheringi | + |
VCP |
| Myrmotherula ornata | + |
VCP |
| Microrhopias quixensis | - |
VCP, GO |
| Drymophila devillei | 6.7 |
GO |
| Cecromacra manu * | - |
DC |
| Percnostola lophotes | 14.8 |
VCP |
| Myrmeciza goeldii | 21.5 |
VCP |
| Poecilotriccus albifacies | + |
VCP |
| Hemitriccus flammulatus | - |
GO |
| Ramphotrigon fusiicauda | + |
VCP |
| R. megacephala | 6.0 |
VCP |
| Sporophila schistacea | NR |
GO |
Figure 5.3. PCA profile for Flooded Forest indicator species at ECO.
Figure 5.4. PCA profile for Flooded Forest indicator species at CAPH.
Figure 5.5. PCA profile for Lowland Forest indicator species at CAPH.
Figure 5.6. PCA profile for Lowland Forest indicator species at EI.
Figure 5.7. PCA profile for Lowland Forest indicator species at SACHA.
Figure 5.8. PCA profile for Bamboo Forest indicator species at SACHA.
Figure 5.9. PCA profile for Lowland Forest indicator species at TRC.
Habitat Associations of Species
PCA profiles of the five different forest types were constructed following one-way ANOVA analysis of habitat variability in each forest type. The number of variable features of the habitat differed between the forest types as did the number of habitat components produced by the PCA. The first two PCA components in each forest type (PCA1 and PCA2) accounted for the highest percentage of habitat variability (see later). PCA1 and PCA2 for each forest type were then plotted on an X-Y axis to produce the PCA habitat profile for that site. The mean number of indicator bird species recorded at each census station were then plotted on both axes (Figures 5.3 – 5.9). Habitat associations for the bamboo indicator species at TRC were not conducted since this has already been the subject of highly detailed research by Kratter (1995b, 1997)
For the type B forest at ECO, PCA1 and PCA2 accounted for 49.2% of habitat variability. Figure 5.3 shows the habitat profile for type B forest. PCA1 axis represents the height of the canopy, while PCA2 represents estimated percentage canopy cover. Figure 5.3 shows that the greater mean number of flooded forest indicator bird species were recorded in areas where the canopy is of a medium to tall height, and where the canopy cover is more open (less dense).
In type B/F forest at CAPH, PCA1 and PCA2 accounted for 48.6% of the variation, and represented canopy height and estimated percentage canopy cover respectively. Figure 4 shows the results of the mean number of flooded forest indicator species recorded at each census station, plotted on the PCA1 and PCA2 axis. A higher mean number of indicator species were recorded in areas where the canopy height was fairly tall. Similarly to type B forest, most indicator species were recorded where the canopy cover was fairly open (less dense).
For the lowland forest indicator species, the higher mean number of species were recorded in areas of medium canopy height, with fewer species being recorded in areas where the canopy height was very low (Figure 5.5). Lowland indicator species also appear to be tolerant of varying canopy density, with high mean numbers recorded in fairly open and fairly dense canopy cover.
PCA1 and PCA2 accounted for 58.4% of the habitat variability in type H forest, at EI, with PCA1 representing the number (density) of palm trees, and PCA2 representing estimated percentage mid-canopy cover. Figure 5.6 shows that the greater mean number of indicator species in type H forest are recorded where there are fewer palm trees (low density of palm trees) but that these species are tolerant of a fairly open and fairly dense estimated percentage mid-canopy cover.
At SACHA, PCA1 and PCA2 corresponded to 56.6% of the overall habitat variation. PCA1 represented by the number of live bamboo stems, while PCA2 represented the height of the canopy. Figure 5.7 shows that the highest mean number of lowland forest indicator species were recorded in areas where the canopy height was high and bamboo density was low. The reverse is true for the bamboo indicator species. These are some of the most habitat restricted of all lowland bird species in Tambopata, and the highest mean number of these specialists were recorded where the density of live bamboo stems was high, and the low forest canopy height was very low (Figure 5.8). This indicates that these specialists are less dependant on forest cover, and more dependant on the density and structural features of the bamboo habitat (see also Kratter, 1995b).
For the final site at TRC, PCA1 and PCA2 were responsible for 56.3% of the overall variation. The first component once again represented canopy height, whilst PCA2 reflected the density of vegetation at the ground level. Figure 5.9 shows the mean number of lowland forest indicator species plotted against these two components. The higher mean number if indicator species are recorded in E/F forest where the canopy height is very tall and where the estimated percentage ground cover is very sparse (less dense).
Canopy Frugivores
Two families of canopy-dwelling frugivorous bird species, Psittacidae and Ramphastidae, are those most sought after by tourists visiting lowland forest in Madre de Dios (Munn, 1992; see Tourist Questionnaire results). A total of 1,632 contacts with parrot species, representing 9% of all bird contacts, were made during 21 months of VCP sampling. 1,251 of these were ‘flying’ contacts, above the canopy. Parrots thus made up 92.7% of all flying contacts during VCP surveys. A total of 347 contacts (21.3% of all parrot contacts) were for the three largest macaw species; Ara ararauna, A. macao and A. chloroptera. Table 5.18 shows the total number of contacts for all parrot species and those for the three largest species of macaws. The important note is that the number of visits to each site was not equal (see earlier section). This was solely due to the lack of permission from each lodge. Despite this there are some interesting results.
The highest number of contacts to parrot species over the 21 months was made in type B forest, at ECO. However, the number of large macaw contacts is quite low, a reflection of the abundance of species which prefer wetter forest types, swamps, aguajals and that feed and roost in palm trees. The most contacts were made in the two primary forest sites, SACHA and TRC, both sites recorded the highest number of contacts to the large macaw species also. The figures that give high cause for concern, are those from the two most disturbed forest areas, EI and CAPH. While fewer contacts of all parrot species were made from EI, CAPH shows an alarming lack of registrations for the large macaw species.
During the 12 month period of September 1997 to September 1998, the total number of parrot species recorded at all five sites was significantly and positively correlated with the total number of fruiting trees (Pearson’s correlation r = 0.587, p < 0 .05). The number of flying parrots was also higher and positively correlated with the number of fruiting trees (r = 0.575, p < 0.05), indicating that more parrots were visiting the region actively searching for fruiting trees. The same pattern can be seen when one examines just the three larger species of macaws. The number of macaws is positively correlated to the number of fruiting trees (r = 0.787, p < 0.05) as is the number of flying birds (r = 0.759, p < 0.05). More macaws are recorded and activity is greatest when the number of fruiting trees are more abundant. This has important consequences for surveying parrot populations in Tambopata, and also has important consequences for tourism (see Discussion).
No clear patterns emerge when one examines the number of toucans recorded during VCP surveys (Table 5.18). Number of toucan species was highest at EI, while the least number of species were recorded in both B/F forest (CAPH) and E/F forest (TRC). The highest number of individuals was recorded from type B forest, at ECO. During the same 12 month period whereby presence of absence of fruit was recorded at each site, the number of toucans recorded during VCP surveys was not significantly correlated with the number of fruiting trees (r = -0.179, p = 0.539).
Table 5.18 showing the number of large canopy-dwelling frugivores recorded during VCP sampling at all five forest sites. The number of ‘large macaw species’ refers to the three largest macaw species Ara ararauna, A. macao and A. chloroptera.
| Lodge | No. Visits |
No. parrot contacts |
No. contacts for large macaw species |
No. of toucan species |
No. of individual toucans |
| EcoAmazonía | 6 |
665 |
45 |
6 |
226 |
| Cusco Amazónico | 5 |
216 |
6 |
4 |
86 |
| Explorers’ Inn | 5 |
175 |
26 |
7 |
182 |
| Sachavacayoc | 4 |
491 |
109 |
6 |
141 |
| TRC | 4 |
519 |
161 |
4 |
79 |
Mist Net Surveys
Sampling effort ranged from 1,620 net/hours at the TRC to 2,700 net/hours at ECO (Table 5.19) for a total of 10,530 net/hours. This resulted in a total of 1,808 captures representing 126 species (Table 5.20). The three most commonly captured species were Pipra fascicauda (249), Myrmotherula hauxwelli (157) and Gymnopithys salvini (107) while 26 species were represented only by a single capture. P. fascicauda was the most frequently caught species at ECO, CAPH and the Tambopata Research Centre, G. salvini was the most frequently caught in terra firme sandy-clay forest at the EI, and Myrmotherula hauxwelli was the most frequently captured species in the old floodplain forest at SACHA. Population densities determined from capture data for some species are shown in Tables 5.10-17.
Table 5.19. Mist-net sampling effort.
| Lodge | CAPH |
EI |
ECO |
SACHA |
TRC |
| Net/hours | 2,160 |
1,800 |
2,700 |
2,250 |
1,620 |
Table 5.20. Number of captures for each of 126 species at each lodge.
| FAMILY | No. | SPECIES | CAPH |
EI |
ECO |
SACH |
TRC |
Total |
| Tinamidae | 1 | Crypturellus bartletti | 1 |
1 |
||||
| 2 | C. soui | 1 |
1 |
|||||
| Accipitridae | 3 | Leucopternis schistacea | 2 |
2 |
||||
| Falconidae | 4 | Micrastur gilbicollis | 1 |
1 |
||||
| 5 | M. ruficollis | 1 |
1 |
|||||
| Phasianidae | 6 | Odontophorus stellatus | 2 |
2 |
||||
| Columbidae | 7 | Geotrygon montana | 2 |
1 |
3 |
1 |
1 |
8 |
| Trochilidae | 8 | Florisuga mellivora | 1 |
1 |
||||
| 9 | Glaucis hirsuta | 14 |
3 |
17 |
||||
| 10 | Phaethornis ruber | 1 |
1 |
2 |
||||
| 11 | P. hispidus | 7 |
1 |
14 |
3 |
7 |
32 |
|
| 12 | Thalurania furcata | 1 |
2 |
1 |
4 |
|||
| 13 | Threnetes leucurus | 3 |
1 |
1 |
3 |
8 |
||
| Alcedinidae | 14 | Chloroceryle aenea | 1 |
5 |
6 |
|||
| Momotidae | 15 | Electron platyrhynchun | 1 |
1 |
||||
| 16 | Momotus momota | 2 |
3 |
5 |
||||
| Bucconidae | 17 | Bucco macrodactylus | 1 |
1 |
||||
| 18 | Malacoptila semicincta | 2 |
3 |
1 |
6 |
|||
| 19 | Monasa nigrifrons | 3 |
1 |
2 |
1 |
7 |
||
| 20 | Nystalus striolatus | 1 |
1 |
|||||
| Ramphastidae | 21 | Aulaconrhynchus prasinus | 2 |
2 |
||||
| 22 | Ramphastos culminatus | 1 |
1 |
|||||
| 23 | Selenidera reinwardtii | 2 |
2 |
4 |
||||
| Picidae | 24 | Picumnus rufiventris | 2 |
2 |
||||
| 25 | Veniliornis affinis | 1 |
1 |
|||||
| Dendrocolaptidae | 26 | Campylorhamphus trochilirostris | 3 |
3 |
||||
| 27 | Deconychura longicauda | 4 |
4 |
5 |
2 |
8 |
23 |
|
| 28 | Dendrocincla fuliginosa | 2 |
2 |
6 |
2 |
3 |
15 |
|
| 29 | D. merula | 24 |
21 |
22 |
7 |
4 |
78 |
|
| 30 | D. certhia | 2 |
2 |
|||||
| 31 | D. picumnus | 2 |
2 |
|||||
| 32 | Glyphorynchus spirurus | 3 |
33 |
2 |
5 |
43 |
||
| 33 | Sittasomus griseicapillus | 1 |
1 |
|||||
| 34 | Xyphorhynchus guttatus | 2 |
1 |
7 |
12 |
22 |
||
| 35 | X. ocellatus | 8 |
3 |
9 |
4 |
24 |
||
| 36 | X. spixii | 5 |
5 |
12 |
4 |
9 |
35 |
|
| Furnariidae | 37 | Ancistrops strigilatus | 2 |
2 |
||||
| 38 | Automolus dorsalis | 1 |
1 |
2 |
||||
| 39 | A. infuscatus | 2 |
9 |
8 |
19 |
|||
| 40 | A. melanopezus | 1 |
3 |
4 |
||||
| 41 | A. ochralaemus | 4 |
10 |
2 |
5 |
21 |
||
| 42 | A. rubiginosus | 1 |
1 |
|||||
| 43 | A. rufipileatus | 1 |
1 |
2 |
||||
| 44 | Hyloctistes subulatus | 4 |
4 |
|||||
| 45 | Philydor pirrhodes | 3 |
7 |
2 |
1 |
13 |
||
| 46 | Sclerurus caudacutus | 7 |
6 |
3 |
2 |
4 |
22 |
|
| 47 | Simoxenops ucayale | 1 |
1 |
1 |
3 |
|||
| 48 | Synallaxis rutilans | 3 |
3 |
|||||
| 49 | Xenops minutus | 3 |
4 |
6 |
3 |
4 |
20 |
|
| Formicariidae | 50 | Cercomacra manu | 2 |
2 |
||||
| 51 | Chamaeza nobilis | 1 |
1 |
|||||
| 52 | Conopophaga peruviana | 8 |
9 |
8 |
4 |
29 |
||
| 53 | Dichrozoma cincta | 3 |
1 |
1 |
5 |
|||
| 54 | Formicarius analis | 11 |
2 |
6 |
6 |
8 |
33 |
|
| 55 | F. colma | 2 |
3 |
2 |
7 |
|||
| 56 | Gymnopithys salvini | 19 |
32 |
28 |
6 |
22 |
107 |
|
| 57 | Hylophylax naevia | 13 |
13 |
|||||
| 58 | H. punctulata | 2 |
2 |
|||||
| 59 | H. poecilonota | 1 |
16 |
17 |
||||
| 60 | Hypocnemis cantator | 2 |
1 |
3 |
||||
| 61 | Hypocnemoides maculicauda | 1 |
1 |
|||||
| 62 | Microrhopias quixensis | 1 |
1 |
|||||
| 63 | Myrmeciza atrothorax | 1 |
1 |
|||||
| 64 | M. goeldii | 4 |
1 |
5 |
||||
| 65 | M. hemimelaena | 5 |
9 |
9 |
23 |
|||
| 66 | M. hyperythra | 4 |
6 |
3 |
2 |
15 |
||
| 67 | Myrmoborus leucophys | 1 |
1 |
5 |
6 |
13 |
||
| 68 | M. myotherinus | 8 |
11 |
3 |
10 |
6 |
38 |
|
| 69 | Myrmotherula axillaris | 2 |
7 |
2 |
5 |
16 |
||
| 70 | M. haematonata | 7 |
10 |
1 |
18 |
|||
| 71 | M. hauxwelli | 44 |
15 |
36 |
31 |
31 |
157 |
|
| 72 | M. iheringi | 1 |
1 |
2 |
||||
| 73 | M. lecophthalma | 3 |
7 |
1 |
4 |
4 |
19 |
|
| 74 | M. longipennis | 12 |
3 |
4 |
1 |
4 |
24 |
|
| 75 | M. menetriesii | 2 |
1 |
1 |
4 |
|||
| 76 | M. ornata | 1 |
1 |
|||||
| 77 | Schirtocichla leucostigma | 2 |
2 |
|||||
| 78 | Percnostola lophotes | 2 |
1 |
3 |
||||
| 79 | Phlegopsis nigromaculata | 10 |
9 |
14 |
13 |
46 |
||
| 80 | Pygiptila stellaris | 1 |
1 |
2 |
||||
| 81 | Sclateria naevia | 1 |
1 |
|||||
| 82 | Thamnomanes ardesiacus | 10 |
4 |
11 |
3 |
9 |
37 |
|
| 83 | T. schistogynus | 2 |
1 |
3 |
4 |
8 |
18 |
|
| 84 | Thamnophilus aethiops | 8 |
2 |
10 |
||||
| 85 | T. schistaceus | 3 |
2 |
1 |
1 |
2 |
9 |
|
| Cotingidae | 86 | Lipaugus vociferans | 1 |
1 |
2 |
|||
| Pipridae | 87 | Pipra chloromeros | 13 |
6 |
7 |
1 |
5 |
29 |
| 88 | P. coronata | 1 |
8 |
9 |
||||
| 89 | P. fascicauda | 69 |
9 |
85 |
22 |
64 |
249 |
|
| 90 | P. rubrocapilla | 1 |
2 |
1 |
7 |
|||
| 91 | Machaeropterus pyrocephalus | 1 |
1 |
|||||
| 92 | Schiffornis turdinus | 9 |
9 |
|||||
| Tyrannidae | 93 | Attila bolivianus | 1 |
1 |
||||
| 94 | A. spadiceus | 2 |
2 |
|||||
| 95 | Corythopis torquata | 7 |
8 |
5 |
11 |
31 |
||
| 96 | Hemitriccus flamulatus | 3 |
3 |
|||||
| 97 | H. zosterops | 2 |
1 |
3 |
||||
| 98 | Laniocera hypopyrrha | 2 |
1 |
1 |
4 |
|||
| 99 | Leptopogon amaurocephalus | 1 |
1 |
|||||
| 100 | Mionectes macconnelli | 1 |
1 |
2 |
||||
| 101 | M. oleagineus | 3 |
4 |
1 |
2 |
1 |
11 |
|
| 102 | Mionectes olivaceus | 1 |
2 |
4 |
7 |
|||
| 103 | Onychorhynchus coronatus | 1 |
2 |
1 |
8 |
12 |
||
| 104 | Platyrinchus coronatus | 26 |
17 |
9 |
3 |
55 |
||
| 105 | P. platyrhynchos | 3 |
1 |
1 |
1 |
6 |
||
| 106 | Ramphotrigon megacephala | 2 |
2 |
|||||
| 107 | Rhynchocyclus olivaceus | 1 |
1 |
|||||
| 108 | Rhytipterna simplex | 1 |
2 |
1 |
4 |
|||
| 109 | Terenotricus erythrurus | 3 |
3 |
4 |
5 |
3 |
18 |
|
| Troglodytidae | 110 | Cyphorhinus aradus | 9 |
4 |
10 |
11 |
3 |
37 |
| 111 | Microcerculus marginatus | 4 |
1 |
3 |
2 |
10 |
||
| Muscicapidae | 112 | Catharus ustulatus | 1 |
1 |
2 |
|||
| 113 | Turdus albicollis | 6 |
1 |
1 |
3 |
6 |
17 |
|
| 114 | T. amaurochalinus | 1 |
1 |
|||||
| 115 | T. hauxwelli | 4 |
10 |
3 |
17 |
|||
| 116 | T. lawrencii | 1 |
1 |
|||||
| Vireonidae | 117 | Hylophilus ochraceiceps | 2 |
1 |
3 |
|||
| Icteridae | 118 | Psarocolius oseryi | 1 |
1 |
||||
| Parulidae | 119 | Basileuterus fulvicauda | 2 |
2 |
||||
| Emberizidae | 120 | Habia rubica | 7 |
15 |
9 |
6 |
2 |
39 |
| 121 | Lanio versicolor | 2 |
2 |
4 |
8 |
|||
| 122 | Tangara schrankii | 2 |
1 |
3 |
6 |
|||
| 123 | Arremon taciturnus | 5 |
2 |
8 |
3 |
18 |
||
| 124 | Oryzoborus angolensis | 1 |
1 |
|||||
| 125 | Saltator maximus | 2 |
2 |
|||||
| 126 | Cyanocompsa cyanoides | 2 |
1 |
4 |
7 |
|||
| Total Captures | 404 |
318 |
447 |
233 |
406 |
1808 |
||
| Total No. Species | 63 |
62 |
69 |
55 |
82 |
126 |