A WETLAND DELINEATION OF THE CHAUTAUQUA ROAD SITE
Plant Biology 445 Wetland Ecology
Walker, C. H., Honu, Y. A. K., and Gann, V.
Presented on September 22, 2001
Southern Illinois University
Carbondale, IL
ABSTRACT
The 3 criteria as outlined by the Federal Manual were met. These criteria are 1) hydrophytic vegetation, 2) hydric soils, and 3) wetland hydrology. Herbaceous vegetation ranged from 78.2-100% at the three plots sampled along the transect. All trees at all 3 plots were wetland species. The soil at all 3 plots were determined to be hydric soils. Drift lines, surface scouring and oxidized rhizospheres were also observed. The Chautauqua Road Site was determined to be a wetland, but the outer boundaries were not determined.
INTRODUCTION
The Federal Manual for Identifying and Delineating Jurisdictional Wetlands (Federal Interagency Committee for Wetland Delineation 1989) uses a three-criterion approach for delineating wetlands. These three criteria are (1) hydrophytic vegetation, (2) hydric soils, and (3) wetland hydrology. All three of these criteria must be met before an area can be classified as a wetland (Mendelssohn 1995). Plant species composition, soil tests, and personal observations were utilized with the Federal Manual for making our determinations.
The dominance ratio and the prevalence index are the two procedures utilized in determining whether vegetation is hydrophytic or not (Wakeley & Lichvar 1997). The results obtained from using these 2 procedures do not always agree. Wakeley & Lichvar 1997 found disagreement between the 2 methods on 16% of actual field plots in 8 states. The dominant ratio method was used in this study.
The objective of our study was to 1) to determine whether the Chautauqua Road Site is a wetland or not and 2) to delineate the upper boundary of the wetland.
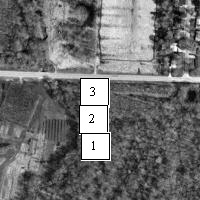
Fig 1:Map of the study site from
USGS Aerial Photograph 27 Mar 1993STUDY SITE
The Chautauqua Road delineation site is about 1 km west of the main campus of Southern Illinois University of Carbondale (SIUC, Fig.1). The early European settlers formally cultivated the site. Presently, the SIUC College of Agriculture, Horticultural Research Center, owns the land (Gibson et al 1997).
The soil is classified as Belknap soil type. The soil depth ranges from 30.5-61.0cm deep. The Chautauqua Road delineation site is often flooded (Gibson et al 1997). The site is a bottomland of the sycamore -box alder vegetation type.
METHODS
Herbaceous species
We laid 1m quadrat and identified all plant species in the quadrat. We estimated the % cover of all the species according to the modified Daubenmire scale (Abrams and Hubert 1987, Table 1).
Table 1. Modified Daubenmire Scale for estimating per cent cover.
|
Index |
Per cent Cover |
|
|
Range |
Mid point |
|
|
1 |
0.1 – 1 |
0.5 |
|
2 |
2 - 5 |
3.5 |
|
3 |
6 - 25 |
15.5 |
|
4 |
26 - 50 |
38 |
|
5 |
51 - 75 |
63 |
|
6 |
76 - 95 |
85.5 |
|
7 |
96 - 100 |
98 |
Tree species
A tape measure was used to measure the distance from the quadrat to the nearest large tree in the four cardinal directions. The diameter at breast height (d.b.h.) of the 4 trees was measured. The number of trees per hectare was calculated according to the Point Quarter Center Method (Arvanitis & Portier 1997). The average distance from the quadrat to the trees was obtained by totaling the 4 quadrat distances and dividing by 4. The average distance was squared to obtain the average ground area per tree. The density was obtained by dividing 1 by the average ground area per tree. This number is the number of trees per meter and when multiplied by 10,000 yields the number of trees per hectare.
Soil samples.
We used a shovel to dig the soil down in the soil about 20 cm and took soil samples. 1) We compared the soil color with the Munsell (Kollmorgen Corporation 2000) soil color chart, 2) We tested for the presence of lime (CaCo3) by using Hydrogen peroxide (H2O2), 3) We tested for the presence of Manganese concretions by using Hydrochloric acid (HCl), and 4) looked for oxidized rhizospheres (root channels).
RESULTS
Herbaceous species
Plot 1
Parthenocissus quinquefolia was the dominant species at our sample point and within the quadrat accounted for almost 75% of the relative cover (Table 2). Sanicula canadensis made up the bulk of the remaining relative cover. Both of these species are facultative wetland species (Table 2).
Table 2. Relative % cover of herbaceous species, Chautauqua Delineation Site, Plot 1, August 24, 2001.
|
Herbaceous Species |
Midpoint |
Vegetation Type |
Relative % Cover |
Wetland Species |
|
Parthenocissus quinquefolia (L.) Planch. |
37.5 |
FAC- |
74.26% |
74.26% |
|
Sanicula canadensis L. |
10 |
FACU+ |
19.80% |
|
|
Lonicera japonica L./tatarica L. |
1 |
FACU |
1.98% |
|
|
Polygonum virginianum L. |
1 |
FAC |
1.98% |
1.98% |
|
Viola striata Ait. |
1 |
FACW |
1.98% |
1.98% |
|
Total |
|
|
100% |
78.22% |
Plot 2
Boehmeria cylindrica accounted for 43% of the relative cover and it is classified as an obligate wetland species. Asimina triloba and Partenocissus quinquefolia, making up another 43% of the relative cover, are both facultative species (Table 3).
Table 3. Relative % cover of herbaceous species, Chautauqua Delineation Site, Plot 2, August 24, 2001.
|
Herbaceous Species |
Wetland Indicator Status |
% cover (Mid-points) |
Relative % cover |
Wetland species |
|
Asimina triloba (L.) Dunal |
FAC |
10 |
21.5 |
21.5 |
|
Geum canadense Jacq. |
FAC |
1 |
2.2 |
2.2 |
|
Parthinocissus quinquefolia (L.) Planch. |
FAC- |
10 |
21.5 |
21.5 |
|
Sanicula canadensis L. |
FACU |
1 |
2.2 |
|
|
Solidago canadensis L. |
FACU |
2.5 |
5.4 |
|
|
Boehmeria cylindrica (L.) Dunal |
OBL |
20 |
43.0 |
43.0 |
|
Pilea pumila (L.) Dunal |
FACW |
1 |
2.2 |
2.2 |
|
Leersia sp. |
FACW/OBL |
1 |
2.2 |
2.2 |
|
Total % Cover |
|
46.5 |
100.0 |
92.6 |
Plot 3
Asimina triloba accounted for 90.4 % of the relative % wetland cover and is classified as a facultative species. Lindera benzoin made up another 7.2 % of the cover and it is classified as facultative wetland species (Table 4).
Table 4. Relative % cover of herbaceous species, Chautauqua Delineation Site, Plot 3, August 24, 2001.
|
Herbaceous Species |
Wetland Indicator Status |
% Cover |
Relative % Wetland Cover |
Wetland species |
|
Lindera benzoin (L.) Blume |
FACW- |
3.0 |
7.2 |
7.2 |
|
Asimina triloba (L.) Dunal |
FAC |
37.5 |
90.4 |
90.4 |
|
Smilax hispida Muhl. |
FAC |
1.0 |
2.4 |
2.4 |
|
Total |
|
41.5 |
100.0 |
100.0 |
Tree species
Plot 1
Quercus imbricaria and Acer rubrum were the 2 tree species found in the north, south, east and west quadrants (Table 5). The average distance between these trees and the quadrat was 6.21 m (Table 5). The average ground area per tree was 38.60 sq m. Therefore, the average density was 0.026 trees per meter or 259 trees per hectare.
Table 5 Relative cover of tree species, Chautauqua Delineation Site, Plot 1, August 24, 2001.
|
Tree Species |
Wetland Indicator Status |
Direction |
Quadrat Distance (m) |
d.b.h. (m) |
Wetland species |
|
|
Quercus imbricaria Michx. |
FAC- |
|
North |
4.70 |
0.72 |
25.0 |
|
Acer rubrum L. |
FAC |
|
South |
4.85 |
0.26 |
25.0 |
|
Quercus imbricaria Michx. |
FAC- |
|
East |
6.1 |
1.5 |
25.0 |
|
Acer rubrum L. |
FAC |
|
West |
9.2 |
2.05 |
25.0 |
|
Totals |
|
|
|
|
|
100.0 |
Plot 2
Acer negundo was present on 3 sides of the quadrat; it is classified as a facultative wetland species (Table 6). Data was not collected for quadrat distance and d.b.h. of the tree species.
Table 6. Relative cover of tree species, Chautauqua Delineation Site, Plot 2, August 24, 2001.
|
Tree Species |
Wetland Indicator Status |
Direction |
Quadrat Distance (m) |
d.b.h. (m) |
Wetland species |
|
Acer negundo L. |
FACW- |
North |
|
|
25 |
|
Ulmus americana L. |
FAC |
South |
|
|
25 |
|
Acer negundo L. |
FACW |
East |
|
|
25 |
|
Acer negundo L. |
FACW |
West |
|
|
25 |
|
Totals |
100.0 |
Plot 3
Acer negundo was present on 2 sides of the quadrat; it is classified as a facultative wetland species (Table 6). The other 2 tree species were Ulmus americana and Platanus occidentalis. These are also classified as facultative wetland species. Data was not collected for quadrat distance and d.b.h. of the tree species.
Table 7. Relative cover of tree species, Chautauqua Delineation Site, Plot 3, August 24, 2001.
|
Tree Species |
Wetland Indicator Status |
Direction |
Quadrat Distance (m) |
d.b.h. (m) |
Wetland species |
|
Acer negundo L. |
FACW- |
North |
|
|
25.0 |
|
Ulmus americana L. |
FACW- |
South |
|
|
25.0 |
|
Platanus occidentalis L. |
FACW |
East |
|
|
25.0 |
|
Acer negundo L. |
FACW- |
West |
|
|
25.0 |
|
Totals |
|
|
|
|
100.0 |
Soil samples.
Plot 1
We differentiated 2 soil color types within the 1m quadrat (Table 3). Immediately below the A-horizon the soil was gray in color (Chroma gley 2) and below this it was pinkish-red in color (Chroma 6).
Table 8. Soil characteristics based on the Munsell Color Chart, Chautauqua Delineation Site, Plot 1, August 24, 2001.
|
Hue |
Chroma |
Value |
|
10B |
Gley 2 |
5 |
|
10R |
6 |
4 |
Plot 2
One soil color type was observed within the 1m quadrat (Table 9). It was light brown in color.
Table 9. Soil characteristics based on the Munsell Color Chart, Chautauqua Delineation Site, Plot 2, August 24, 2001.
|
Hue |
Chroma |
Value |
|
10YR |
3 |
5 |
Plot 3
As in Plot 2, one soil color type was observed within the 1m quadrat (Table 9). It was also light brown in color.
Wetland Hydrology
Plot 1
Conspicuous oxidized rhizospheres (root channels) were present in the soil samples taken from within the 1 meter quadrat.
Plot 2
Drift lines and surface scouring were observed in the area, but no oxidized rhizospheres were present.
Plot 3
Oxidized rhizospheres were also present in the soil samples taken from within the 1 meter quadrat. Surface scouring and drift lines were observed in the area.
DISCUSSION
1) Hydrophytic Vegetation
The herbaceous layer was composed of 78.22% of wetland species at Plot 1, composed primarily of Parthenocissus quinquefolia (Table 2). The 4 trees found at the 4 cardinal directions from the quadrat were also classified as wetland species (Table 5).
Wetland species made up 92.6% of the vegetation found at Plot 2. Boehmeria cylindrica, an obligate wetland species, made up 43% of this total (Table 3). The 4 trees found at the 4 cardinal directions from the quadrat were also classified as wetland species (Table 6).
Wetland species made up 100 % of the total at Plot 3 (Table 4). The 4 trees found at the 4 cardinal directions from the quadrat were also classified as wetland species (Table 7).
Herbaceous vegetation ranged from 78.2-100% at the three sites. All the trees at all 3 sites were wetland species. Section 3.6, number 2, of the Federal Manual for Identifying and Delineating Wetlands states that if 50% or more of the dominants are OBL, FACW, or FAC (including FACW+, FACW-, FAC+, and FAC-) then hydrophytic vegetation is present.
2) Hydric Soil
Soil color is the most diagnostic indicator of hydric soils in wetlands (Federal Interagency Committee for Wetland Delineation -FICWD 1989). Chroma 2 or less is an indicator for hydric soils (FICWD 1989). Black, various shades of gray, and the darker shades of brown and red are low chroma colors (FICWD 1989). The soil color observed at plot 1 was chroma 2 (gley 2). This equals the value needed for classification as a hydric soil. The soil type at plots 2 and 3 was chroma 3. All three plots were of the Belknap soil type. This soil is subject to frequent flooding from January to June with a high water table that is 30.5-61.0cm deep.
Orange or reddish brown colors along living root channels are the result of soil saturation for a long period during the growing season (FICWD 1989). We visually found conspicuous rust colored areas along root channel (oxidized root channels) in the soil sample taken from 20 cm below the surface. Root plaques and oxidized root channels indicate that anaerobic conditions were present during the growing season by virtue of their association with living roots. Therefore, the presence of root plaques and oxidized root channels is a good indicator of wetland hydrologic conditions (Mendelssohn 1995). Oxidized root channels were observed at plots 1 and 3, indicating wetland hydrologic conditions.
3) Wetland Hydrology
The water table was not observed to be within 0.5 feet of the surface as required by the Federal Manual. The soil may be inundated by water at our sampling point earlier in the year. According to Gibson et al (1999) the study site is subject to seasonal flooding.
The presence of rust-colored areas along root channels (redox conditions) would indicate that anaerobic conditions (flooded) were present during the growing season.
The 3 criteria as outlined by the Federal Manual were met. In conclusion the Chautauqua Road Site was determined to be a wetland, but the outer boundaries were not determined. Further studies at the Chautauqua Road Site should try to determine the outer boundaries of this wetland. A plot should be set up south of Plot 1 to try to delineate the outer boundary of this wetland site.
BIBLIOGRAPHY
Abrams, M and Hulbert, L. 1987. Effect of topographic position and fire on species composition in a tall grass prairie in northeast Kansas. The American Midland Naturalist 117:442-445.
Arvanitis, L.C. & Portier, K. M. 1997. Point Quarter Center Method. http://www.ifasstat.ufl.edu/nrs/PQC.htm Institute of Food and Agricultural Sciences, University of Florida, Gainesville, FL USA.
Federal Interagency Committee for Wetland Delineation. 1989. Federal Manual for Identifying and Delineating Jurisdictional Wetlands. Cooperative Technical Publication. U.S. Army Corps of Engineers, U.S. Environmental Protection Agency, U.S. Fish and Wildlife Service, and U.S.D.A. Soil Conservation Service, Washington, D.C. USA 107 pp.
Gibson, D. J., Middleton, B. A., Saunders, G. W., Mathis, M., Weaver, W. T., Neely, J., Rivera, J., and Oyler, M. 1999. Learning Ecology by doing ecology. The American Biology Teacher. 61: 217-222.
Mendelssohn, A., Kleiss, B. A., and Wakeley, J. S. 1995. Factors controlling the formation of oxidized root channels: a review. Wetlands 15: 37-46.
Munsell Corporation. 2000. Munsell soil color charts. Munsell color, GretagMacbeth, New Winsor, New York.
Porter, B.R. 1988. National list of plant species that occur in wetlands: National summary. Biological Report, 88(24). 244 pp.
USDA, NRCS. 2001. The PLANTS Database, Version 3.1 (http://plants.usda.gov). National Plant Data Center, Baton Rouge, LA 70874-4490 USA.
USDA, Soil Conservation Service. 1987. Hydric soils of the United States.
USDA, Soil Conservation Service and Forest Service. 1979. Soil Survey of Jackson County, Illinois. 192 pp.
Wakeley, J. S. and Lichvar, R. W. 1997. Disagreements between plot-based prevalence indices and dominance ratios in evaluations of wetland vegetation. Wetlands 17: 301-309.