UPPER BOUNDARY DELINEATION OF BUTTONLAND SWAMP, PULASKI COUNTY, ILLINOIS
Plb 445-Wetland Ecology
Honu, Y. A. K., Walker, C. H., and Scott-Gann, V.
Southern Illinois University
Carbondale, IL
ABSTRACT
An upper boundary delineation of Buttonland Swamp was conducted on October 12, 2001 in Pulaski County, Illinois. A transect line, along a north-south direction, was used to establish 3 sampling plots randomly located along its axis. This study utilized methods outlined by the U.S. Army Corps of Engineers Wetland Delineation Manual (1987). Plot 1 was located at the lowest elevation close to the Cache River with plots 2 and 3 progressively higher in elevation. Plots 3 and 2 were located 4, 150, and 330 m away from plot 1 (river's edge), respectively. Relative percent cover of hydrophytic herbaceous species decreases from river's edge (plot 1) to plots 2 and 3 (upland). Relative % cover ranges were 100% (plot 1), 95% (plot 2), and 0/0% (plot 3). These data suggest that the wetland boundary was located between 150 and 330 m south of the river's edge
INTRODUCTION
The Buttonland Swamp was designated a national landmark in 1972. In order to incorporate an effective wetland protection management pla, boundaries of this swamp must be quantified. Swamps are fragile ecosystems and have characteristic plant communities and function (Voight & Mohlenbrock 1964). Examples of characteristic plant species common to the Buttonland Swamp community include Salix nigra, Acer rubrum, Acer regundo, Juncus spp.), and Carex frankii).
Three criteria are used in delineating wetlands; 1) hydrophytic vegetation, 2) hydric soils, and 3) wetland hydrology (USACOE 1989, Middleton 1999). These three criteria must be met before an area can be classified as a wetland (Mendelssohn 1995).
Hydrophytic vegetation grows in water or in soil that is flooded for at least one week during the growing season. This creates a deficiency of oxygen, resulting in a hydric soil (USACOE 1989). Signs of wetland hydrology include inundations, drift lines, surface scouring, and water marks (USACOE 1989). Driftline and surface scouring are hydrological indicators that are important if delineations are conducted in the dry season, or during drought.
The objectives of this study were to delineate the upper boundary of the wetland and provide information on vegetative species growing in Buttonland Swamp.
STUDY SITE
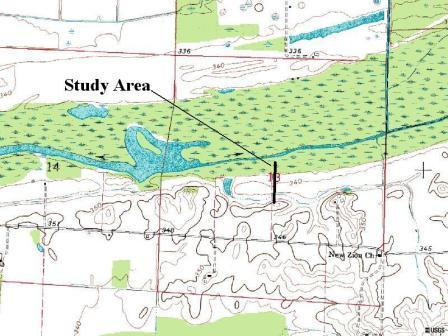
The study site is located approximately 4 miles west of Karnac, and approximately 2 miles west of the intersection of Highways 37 and 169 in Pulaski County, Illinois (Fig. 1). The area of delineation was located along the north side of the road, which is the westward continuation of Highway 169. Buttonland Swamp is located in the southwest portion of the Cache River State Natural Area, an area consisting of 11,768 acres encompasing Johnson and Pulaski counties. The area of delination is on a north-facing slope that drains into the Cache River. The Cache River flows into the Ohio River southwest of this site. Elevations at this site range from 335-350 feet above sea level in transversing from plot 1 to plot 3 along the transect line (Fig. 2).
The Cache River State Natural Area is within a floodplain formed thousands of years ago when glacial floodwaters were carried by the Ohio River. The Ohio River changed its course leaving the Cache River to meander through a vast area of wetlands. This particular site was formerly used for growing agronomic crops, but has been undisturbed and in a state of succession for approximately ten years. Numerous studies have been conducted at this site, particularly focusing on the role of flooding in seed dispersal and restoration of cypress swamps (Middleton 1995). A transect line was located in the central portion of section 13, township 14S, range 1E (Fig. 2).
METHODS
Three 1 square meter quadrats were established along a 330 m transect line. Plant species located within the quadrat were keyed and identified according to Reed (1988, Table 1) and nomenclature follow the USDA plants database ((USDA 2001). A Daubenmire scale was used to estimate the percent cover of all identified species (Daubenmire 1959, Table 2).
A shovel was used to obtain soil samples approximately 20 cm in depth. Soils were examined for color using a Munsell soil Color Chart (Munsell Corporation 2000). In addition, soil pits were examined for the presence of oxidized rhizospheres (root channels). Soil samples were also tested for the presence of iron (Fe) using alpha
,alpha-dipyridyl (National Technical Committee for Hydric Soils 2001).RESULTS
VEGETATION
Herbaceous species located in Plot 1 were identified as facultative or obligate wetland species (Table 3). Campsis radicans and Eupatorium perfoliatum were dominant species which accounted for 95% of total relative percent wetland cover. One OBL species, (Leersia oryzoides, was observed at this site. Similarly all tree species, Ulmus americana, Acer saccharinum, Crataegus viridis, observed in Plot 1 were wetland species (Table 3). Herbaceous species identified in Plot 2 were also wetland species, however no tree species were present in or in close proximity to the plot (Table 4). Andropogon virginicus and Acer negundo were dominant species in this plot, which accounted for 84.6 and 14.9 % of relative percent cover, respectively. Desmodium nudiflorum represented 15.5% of vegetative cover in Plot 2, but was not incluced in our analysis since it is an unlisted species (Red 1988).
Two herbaceous species were observed in Plot 3, which were both characteristic upland species (Table 5). Lonicera tatarica and Rubus flagellaris represented 96.2% and 3.8% cover, respectively. There were 12 species (woody and herbaceous) observed among these three plots, 70% of which were wetland species (Table 7).
SOILS
Soil color varied between plots, ranging from brown (10YR 4/3) in Plot 1, yellowish brown (10YR 5/6) in Plot 2, and dark reddish brown (5YR 3/4) at Plot 3 (Table 8). However, soil survey maps indicate that Plot 1 has Karnack soil type and Plot 2 has Ginat soil type, both of which are classified as hydric soils (USDASCS 1968). Chroma values for hydric soils in the southern United States do not always contain low color values. This is primarily due to Munsell Soil Color Charts, originally based upon northern peat soils (Middleton 2001, personal communication). Additionally, none of the soils tested positive for the presence of iron (Fe) when treated with alpha,alpha-dipyridyl. This solution is used to confirm the presence of ferrous (Fe++) in the soil. If Fe++ is present, the soil material turns either bright pink or reddish in color within a relatively shor time period, usually within seconds (N T C H S 2001).
HYDROLOGY
Drift lines, surface scouring, or watermarks were not present at the three study plots. However, inundation was observed in the southern portion of the quadrat in Plot 1. Below ground water levels located approximately 10 m from Plot 1 were less than 0.5 m in March 2001, and greater than 1.8 m in June/July of the same year (Fig. 3).
DISCUSSION
HYDROPHYTIC VEGETATION
Hydrophytic vegetation is one of the important criteria used in determining the wetland status of an area (USACOE 1989). Every plant has an equal probability of occurring in a wetland, upland, or both. Hydrophytic vegetation (OBL, FACW & FAC) has a probability of 34 % or greater of occurring in a wetland, whereas non-hydrophytic vegetation (FACU & UPL) has a probability of 67 % or greater of occurring in an upland (USACOE 1989, Table 1). If more than 50 % of the dominant species are OBL, FACW & FAC, then the site is considered to have hydrophytic vegetation. Relative percent cover is a good measure of the probability of specific tree species occurring in an area (Daubenmire 1959, Table 2).
Plot 1 had higher percentages of hydrophytic vegetation than plots 2 and 3 (Tables 3-5). Plot 1 was located in the floodplain of the Cache River. This resulted in greater species richness for Plot 1, than Plots 2 or 3, which were located at higher elevations from the river. In this particular study area, (Middleton (2000) found that the species richness was greater in the floodplain than at higher elevations not subject to flooding. All tree and herbaceous species in plot 1 were hydrophytic species (Table 3). Plot 2 contained 99.5 % hydrophytic herbaceous vegetation, whereas Plot 3 was completely devoid of such species. Therefore, plot 1 and 2 met the hydrophytic vegetation criteria while plot 3 does not. It is important to note that Plot 1 was located at the edge of the riparian-sedge marsh, which may account for its high percentages of characteristic wetland vegetation.
A high percentage of hydrophytic vegetation observed in Plot 2 may be due to the presence of a high water table during the rainy season, although the water table at this particular site appears to be extremely complex and to date, is poorly understood (Middleton 2001, personal communication). For instance, ground water levels in this area were less than 0.5 m in March 2001 (Figure 3). Plot 3 was located on the upland, which explains why this plot was lacking hydrophytic vegetation.A single obligate wetland species (Leesia oryzoides) was observed in plot 1 (Table 3). The quadrat at plot 1 was located approximately 4 m from the river's edge, which may explain why an obligate species was was observed in this quadrat.
Soil color is the most diagnostic indicator of hydric soils in wetlands (USACOE 1989). A chroma of 2 or less is an indicator for hydric soils (USACOE 1989, Munsell Corporation 2000). Black, various shades of gray, and the darker shades of brown and red are characteristic of low chroma colors (USACOE 1989, Munsell Corporation 2000). No soils from any of the 3 plots were classified as hydric soils according to the soil survey maps of Pulaski and Alexander Counties (USDASCS 1968).
We conclude that the wetland boundary at this site is located between 150 and 330 m south of the river's edge. Our results agree with a previous study conducted at this site, which suggests that the wetland boundary is located between 175 to 198 m from the Cache River (Heron & Hoyer 1999). Future studies at Buttonland Swamp should include establishing quadrats between Plots 2 and 3, in order to further quantify the outer boundary of this wetland. In addition, incorporation of wetland hydrology may also elude to the mechanisms of seed dispersal and riparian forest regeneration in this complex ecosystem.
BIBLIOGRAPHY
Daubenmire, R. F. 1959. A canopy-coverage method of vegetation analysis. Northwest Science 33:43-47.
Heron, S. and Hoyer, E. 1999. The Buttonland boundary: delineations define the wetland. PLB 445 Student Project.
MapQuest.com, Inc. 2001. http://maps.yahoo.com/, (Denver, CO).
Mendelssohn, A., Kleiss, B. A., and Wakeley, J. S. 1995. Factors controlling the formation of oxidized root channels: a review. Wetlands 15: 37-46.
Middleton, B. A. 2000. Hydrochory, seed banks, and regeneration across landscape boundaries in cypress swamps. Plant Ecology 146: 169-184.
Munsell Corporation. 2000. Munsell soil color charts. Munsell color, GretagMacbeth, New Windsor, New York.
National Technical Committee for Hydric Soils. 2001. Hydric Soil Tech. Note 8: Use of alpha-alpha-dipyridyl. http://www.statlab.iastate.edu/soils/hydric/hstn.html, Ames, Iowa.
Reed, P. B. 1988. National list of plant species that occur in wetlands: National summary. Biological Report, 88(24), Washington, D. C.
U.S.A.C.O.E. 1989. Federal manual for identifying and delineating jurisdictional wetlands. Cooperative Technical Publication. U.S. Army Corps of Engineers, U.S. Environmental Protection Agency, U.S. Fish and Wildlife Service, and U.S.D.A. Soil Conservation Service, Washington, D.C.
USDA, NRCS. 2001. The PLANTS Database, Version 3.1
U. S. Department of Agriculture Soil Conservation Service. 1968. Soil Survey, Pulaski and Alexander Counties, IL. U. S. Department of Agriculture in cooperation with Illinois Agricultural Experiment Station, Washington D.C.
U.S. Geological Survey. 2000. http://www.usgs.gov/, (Reston, VA).
Table 1. Wetland vegetation classification (USACOE 1989).
|
Vegetative Classification |
|
Symbol |
|
Estimated probability of occurrence in wetlands (percent) |
||
|
Obligate Wetland |
|
OBL |
|
|
> 99 |
|
|
Facultative Wetland |
|
FACW± * |
|
|
67 - 99 |
|
|
Facultative |
|
FAC± * |
|
|
34 - 66 |
|
|
Facultative Upland |
|
FACU± * |
|
|
1 - 33 |
|
|
Obligate Upland |
UPL |
< 1 |
||||
*
A plus sign indicates that a species will fall towards the upper end of the range, a negative sign denotes that a species will fall towards the lower end of the range.
Table 2. Daubenmire Scale for estimating per cent cover (Daubenmire, 1959).
|
Index |
Percent Cover |
|||
|
Range |
|
Mid point |
||
|
1 |
|
0 – 1 |
|
0.5 |
|
2 |
|
2 - 5 |
|
3.5 |
|
3 |
|
6 - 25 |
|
15.5 |
|
4 |
|
26 - 50 |
|
38 |
|
5 |
|
51 - 75 |
|
63 |
|
6 |
|
76 - 100 |
|
88 |
Table 3. Relative per cent cover of herbaceous and tree species, Plot 1, delineation of Buttonland Swamp, Pulaski County, Illinois, October 12, 2001.
|
A. Herbaceous Species |
|
Vegetation Type |
|
% Cover |
|
Relative % cover |
|
Wetland Species |
||||||||||||||||||
|
Campsis radicans (L.) Seem. ex Bureau |
|
FACW |
|
38 |
|
47.5 |
|
47.5 |
||||||||||||||||||
|
Eupatorium perfoliatum L. |
|
FACW+ |
|
38 |
|
47.5 |
|
47.5 |
||||||||||||||||||
|
Ipomoea hederacea Jacq. |
|
FAC |
|
0.5 |
|
0.6 |
|
0.6 |
||||||||||||||||||
|
Leersia oryzoides (L.) Sw. |
|
OBL |
|
3.5 |
|
4.4 |
|
4.4 |
||||||||||||||||||
|
Total % cover |
|
|
|
80 |
|
100.0 |
|
100.0 |
||||||||||||||||||
|
B. Tree Species |
|
|
|
|
|
|
||||||||||||||||||||
|
Acer saccharinum L. |
|
FACW |
|
|
25.0 |
|
25.0 |
25.0 |
||||||||||||||||||
|
Crataegus viridis L. |
|
FACW |
|
|
25.0 |
|
25.0 |
25.0 |
||||||||||||||||||
|
Ulmus americana L. |
|
FACW- |
|
|
25.0 |
|
25.0 |
25.0 |
||||||||||||||||||
|
Ulmus americana L. |
|
FACW- |
|
|
25.0 |
|
25.0 |
25.0 |
||||||||||||||||||
|
Total |
|
|
|
|
100.0 |
|
100.0 |
100.0 |
||||||||||||||||||
Table 4. Relative per cent cover of herbaceous species, Plot 2, delineation of Buttonland Swamp, Pulaski County, Illinois, October 12, 2001.
|
Herbaceous Species |
|
Vegetation Type |
|
% Cover |
|
Relative % Cover |
|
Wetland Species |
|
Acer negundo L. |
|
FACW- |
|
15.5 |
|
14.9 |
|
14.9 |
|
Allium canadense L. |
|
FACU |
|
0.5 |
|
0.5 |
|
|
|
Andropogon virginicus L. |
|
FAC- |
|
88.0 |
|
84.6 |
|
84.6 |
|
Total % cover |
|
|
|
104.0 |
|
100.0 |
|
95.5 |
Desmodium
nudiflorum (L.) DC. made up 15.5 per cent of the cover at Plot 2, but since it is not listed (Reed, P. B. 1988), it was not included in the per cent cover calculations.
Table 5. Relative per cent cover of herbaceous species, Plot 3, delineation of Buttonland Swamp, Pulaski County, Illinois, October 12, 2001.
|
Herbaceous Species |
|
Vegetation Type |
|
% Cover |
|
Relative % Cover |
|
Wetland Species |
||
|
Lonicera tatarica L. |
|
|
FACU |
|
|
88.0 |
|
96.2 |
|
|
|
Rubus flagellaris Willd. |
|
|
FACU- |
|
|
3.5 |
|
3.82 |
|
|
|
Total % cover |
|
|
|
|
|
91.5 |
|
100.0 |
|
|
Table 7: Combined plant species list of
Buttonland Swamp, Pulaski County, Illinois, October 12, 2001.|
Name of Species |
Indicator |
|
Acer negundo L. |
FACW- |
|
Acer saccharinum L. |
FACW |
|
Allium canadense L. |
FACU |
|
Andropogon virginicus L. |
FAC- |
|
Campsis radicans (L.) Seem. ex Bureau |
FACW |
|
Crataegus viridis L. |
FACW |
|
Eupatorium perfoliatum L. |
FACW+ |
|
Ipomoea hederacea Jacq. |
FAC |
|
Leersia oryzoides (L.) Sw. |
OBL |
|
Lonicera tatarica L. |
FACU |
|
Rubus flagellaris Willd. |
FACU- |
|
Ulmus americana L. |
FACW- |
Table 8. Soil characteristics based on the Munsell Color Chart, Buttonland Swamp delineation site, Pulaski County, Illinois, October 12, 2001 * Indicates wetland color chroma.
|
Plot |
|
Hue |
|
Value |
|
Chroma |
|
1 |
|
10YR |
|
4 |
|
3* |
|
2 |
|
10YR |
|
5 |
|
6 |
|
3 |
|
10YR |
|
7 |
|
6 |
Figure 1. Highway map showing the location of the delineation site in Buttonland Swamp, Pulaski County, Illinois, October 12, 2001 (MapQuest 2001).
Figure 2. Topographic map showing the location of the delineation site in Buttonland Swamp, Pulaski County, Illinois, October 12, 2001 (USGS 2000).