| a. |
Given
a velocity-time (v-t) graph, explain how you can work out the following
quantities:
i) the
displacement in a given time interval
ii) the average
speed of the whole journey
iii) the instantaneous
acceleration |
3
marks |
|
|
|
|
 |
no diagram (-1) |
|
The displacement in a given time interval is given by the
area under the v-t graph. In the example shown in Fig.1.2.1, the
displacement is the algebraic sum of the areas 1 to 3, i.e. (Area
1 - Area 2 + Area 3). |
1 |
|
The average speed is the total distance travelled
per unit time. Thus, in the above example, the distance travelled is the
numeric sum of the areas 1 to 3, i.e. average speed = (Area 1 +
Area 2 + Area 3)/T |
1 |
|
The instantaneous acceleration is given by the slope of
the v-t graph at that particular instant as shown in Fig.1.2.2. |
1 |
|
|
|
| b. |
Draw
displacement-time (x-t) graph, v-t graph and acceleration-time (a-t) graph
for each of the following motions:
i) An
MTR train travelling between three successive stations, being both initially
and finally at rest. You may assume that, most of the time, the train is
travelling at a constant speed. |
13
marks |
|
|
|
|
Starting from a station, the train accelerates up to a
certain speed and then keeps on moving with that speed. Before it reaches
another station, it slows down (decelerates). Note that the train would
state a certain period before moving on. |
|
|
 |
2,2,2 |
|
|
|
| b. |
ii)
An elastic ball is dropped from a height above the ground. The ball bounces
for three times. For each rebound, the height reached is reduced by 50%. |
|
|
|
|
|
Since the ball is released from rest, its speed is zero
at t = 0.
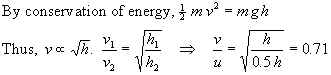
After each rebounds the speed is 0.71 times as before.
Also, note that, between two rebounds, the time for moving up is equal
to the time for moving down. |
2 |
|
 |
2,2,1 |