
Isotopic Sorting and the Noah's Flood Model
Last edited: 08/20/2001
Stable isotope stratigraphy is made possible by the fact that the isotopic composition of seawater varies or "evolves" over time, as a result of several different processes. Since marine organisms build themselves using atoms from ocean water, variations in the isotopic composition of ocean water are reflected in variations in the isotopic composition of inorganic minerals and organic material such as calcerous shells. If sufficient samples of known age and isotopic composition are studied, an isotopic curve can be constructed, and new samples can then be dated by correlation with the isotopic curve. Fairly high-resolution isotopic curves have now been constructed for most of the Phanerozoic. Boggs (1987 p. 688) writes:
Variations in the relative abundance of certain stable, nonradioactive isotopes in marine sediments and fossils can be used as a tool for chronostratigraphic correlations of marine sediments. Geochemical evidence shows that the isotopic composition of oxygen, carbon and sulpher in the ocean has undergone large fluctuations, or excursions, in the geological past -- fluctuations that have been recorded in marine sediments. Because the mixing time in the oceans is about 1000 years or less, marine isotopic excursions are considered to be essentially isochronous throughout the world. Variations in isotopic compositions of sediments or fossils allow geochemists to construct isotopic composition curves that can be used as stratigraphic markers for correlation purposes.
For instance, in the shells of foraminifera deposited in the oceans during the last ice age, there are fluctuating changes in the ratio O18/O16, reflecting changes in the isotopic composition of the water from which the carbonate was extracted. These excursions are primarily a function of the volume of light O16 locked in ice during glacial periods. Below is a diagram illustrating the changes in the ratio O18/O16 observed in oceanic forminifera shells for the past several hundred thousands years, showing *very good* correlation between many widely seperated oceanic cores.
SPECMAP data sets correlated by del18O records. Linked from: Proxies: Oceanic records of Pleistocene climatic change
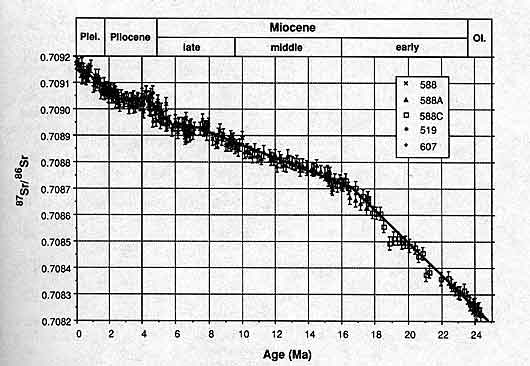
Here's another example, on a longer time scale, this time using Sr87/Sr86 ratios in shells from the past 24My (Miocene to present), from several widely seperated oceanic locations. Bars indicated error margins. From Hodell et al., 1991.
Now for the interesting part. We see the same types of isotopic changes throughout the geologic record, both in the shells of individual organisms and in inorganic marine sediments. It is now possible to construct isotopic curves for the entire Phanerozoic, documenting changes in seawater isotopic ratios during the past 500+ million years. Veizier et al. (1999) review a massive isotopic dataset spanning all the way from the Cambrian to the Cretaceous:
A total of 2128 calcitic and phosphatic shells, mainly brachiopods with some conodonts and belemnites, were measured for their del 18O, del 13C and 87Sr/86Sr values. The dataset covers the Cambrian to Cretaceous time interval. Where possible, these samples were collected at high temporal resolution, up to 0.7 Ma (one biozone), from the stratotype sections of all continents but Antarctica and from many sedimentary basins. . . These datasets are complemented by extensive literature compilations of Phanerozoic low-Mg calcitic, aragonitic and phosphatic isotope data for analogous skeletons. The oxygen isotope signal exhibits a long-term increase of del 18O from a mean value of about -8del (PDB) in the Cambrian to a present mean value of about 0del (PDB). Superimposed on the general trend are shorter-term oscillations with their apexes coincident with cold episodes and glaciations. The carbon isotope signal shows a similar climb during the Paleozoic, an inflexion in the Permian, followed by an abrupt drop and subsequent fluctuations around the modern value. The 87Sr/86Sr ratios differ from the earlier published curves in their greater detail and in less dispersion of the data. The means of the observed isotope signals for 87Sr/86Sr, del18O, del13C and the less complete del34S (sulfate) are strongly interrelated at any geologically reasonable (1 to 40 Ma) time resolution. All correlations are valid at the 95% level of confidence, with the most valid at the 99% level. [87Sr/86Sr, del 13C and del 18O evolution of Phanerozoic seawater. Chemical Geology, Vol. 161 (1-3) (1999) pp. 59-88]
Fairly abrupt isotopic changes can often be correlated across the entire earth, for example a large del 13C excursion at the base of a specific conodont zone correlated with an extinction event. This implies that growth and deposition of the shells and sediments in the geologic record occured at a rate that is fairly slow compared to the rate at which oceanic mixing occurs, about ~10^3yrs or so (Holser, Magaritz, and Wright 1986; Kump 1991). This is entirely inconsistent with models in which a substantial portion of the geologic record is deposited by a single catastrophe lasting only months. On the flood model, all the shelly fossils in the geologic record are the remains of animals that lived in a panthalassic preflood ocean during a period of only 1600yrs or so. Thus, in order to produce the patterns seen in the geologic record, the flood would have to transport and sort brachiopod shells, conodonts, forams and other calcerous fossils, by very sutle but consistent differences in C, O, S, and Sr isotopic ratios! And it would have to work virtually in real time across millions of square miles. The difficulties entailed by trying to fit these data into a flood-model are mind-boggling.
Silurian Isotope Stratigraphy
Since flood geology theories agree that Paleozoic sediments are flood deposits, we'll focus first on several examples from the Silurian. Some of these studies use del 13C, some use del 18O, and some use the ratio 87Sr/86Sr. First up is a study of 87Sr/86Sr in Silurian conodont elements.
Stephen C. Ruppel, Eric W. James, James E. Barrick, Godfrey Nowlan and T. T. Uyeno. High-resolution 87Sr/86Sr chemostratigraphy of the Silurian: Implications for event correlation and strontium flux. Geology: Vol. 24, No. 9, pp. 831–834.
Analyses of 87Sr/86Sr in Silurian conodonts recovered from localities in North America and Europe representing 13 of the 14 defined Silurian conodont zones provide a high-resolution record of seawater chemistry for the Silurian Period. These data, which are characterized by little or no scatter, depict several high-frequency cycles superimposed on a gradual longer term rise in 87Sr/86Sr for the Silurian. High-frequency cycles have a duration of about one conodont zone, and many correlate with sequence boundaries recognized around the world. These data provide a much higher resolution image of secular changes in 87Sr/86Sr during the Silurian and may require a rethinking of models of strontium isotope flux in marine basins.
13C and 18O excursions in Silurian brachiopods and whole rock carbonates.
Correlating Early Silurian delta13C and delta 18O Events Within and Between Sedimentary Basins. Rachel Heath, James Marshall, and Patrick Brenchley. 11th Bathurst Meeting, Volume 4 Number 2, Journal of Conference Abstracts.
An isotopic study carried out for the purpose of investigating the nature and timing of palaeoceanographic events shows that it is possible to correlate isotope shifts between widely separate sedimentary basins. A correlation of published oxygen and carbon stable isotope records from the Baltic identified isotopic variations that occurred independently of facies and lithology. This enabled at least one major event to be identified as potentially of environmental significance on a regional scale. Large shifts (>2 per mil) in del13C and del18O were found near the Llandovery-Wenlock boundary (Early Silurian) in carbonate sequences from locations across the Baltic basin. This isotopic event coincides with extinctions and diversity changes in benthic and planktonic faunas and other indicators of climatic and oceanographic change (eustatic variations and likely glacial sediments).
To test the significance of this isotopic event further, the Baltic isotope record was compared with those available from other palaeocontinents, namely Laurentia and Gondwana. Isotopic records from different source materials and from different depositional environments were compared, specifically; whole-rock carbonate, brachiopod shell calcite and organic matter from an immature carbonate source rock. Similar positive shifts in delta13C from organic carbon and whole-rock carbonate were found in the Australian and Canadian sections and it was possible to correlate them with the Baltic isotope stratigraphy . . . From this, it is evident that stable isotope curves can be used in conjunction with biostratigraphical data to increase the accuracy of regional and inter-regional correlations. . .
It is assumed that in such widely separate basins as studied here, the sedimentary successions, and materials within those successions (such as biogenic calcite and organic matter), have completely unrelated diagenetic histories and, therefore, that any isotopic events that can be correlated between the two are primarily the result of wide-reaching environmental influences prior to deposition.
Karem Azmy, Ján Veizer, Michael G. Bassett and Paul Copper. Oxygen and carbon isotopic composition of Silurian brachiopods: Implications for coeval seawater and glaciations. GSA Bulletin: Vol. 110, No. 11, pp. 1499–1512.
We collected 236 calcitic brachiopod shells, covering the entire Silurian Period (30 m.y.), at high temporal resolution from stratotype sections from Anticosti Island (Canada), Wales (United Kingdom), the Oslo region (Norway), Gotland (Sweden), and Podolia (Ukraine), Estonia, Latvia, and Lithuania. Data from petrography, scanning electron microscopy, cathodoluminescence, isotopes, and trace elements all confirmed that there was excellent preservation in most shells, thus arguing for retention of primary isotope signals; exceptions were samples from the Oslo region.
The 18O and 13C values for the well-preserved samples range from 2‰ to 6.5‰ and from 1‰ to 7.5‰ (Peedee belemnite), respectively. In terms of temporal trends, oxygen and carbon isotopes vary in parallel, with a slight decrease with declining age of 1‰ through Silurian time, with superimposed short-term oscillations that are negatively correlated with sea-level changes. Three successive positive 18O shifts in early Aeronian, latest Aeronian, and early Wenlock time correlate with sea-level lowstands and with glacial diamictite deposits in the Amazon Basin and in Africa.
The Permo-Triassic Boundary
See:
Jin et al. Pattern of
Marine Mass Extinction Near the Permian-Triassic Boundary in
South China.
Looy et al. Life in the
end-Permian dead zone.
Looy et al. The delayed
resurgence of equatorial forests after the Permian-Triassic
ecologic crisis.
Visscher et al. The
terminal Paleozoic fungal event.
Bowring et al. U/Pb
Zircon Geochronology and Tempo of the End-Permian Mass Extinction.
Dolenec et al. The
Permian-Triassic boundary in Western Slovenia.
Martin et al. Sr and Nd
isotopes at the Permian/Triassic boundary: A record of climate
change
Musashi et al. Stable
carbon isotope signature in mid-Panthalassa shallow-water
carbonates across the Permo-Triassic boundary: evidence for 13C-depleted
superocean
Dramatic isotope shifts have been documented in shells and inorganic marine sediments at each of the 5 major phanerozoic mass extinctions. Here we will discuss the one which occurred at the 251.4My Permo-Triassic boundary (PTB). The PTB boundary is marked by a the most massive Phanerozoic extinction event. Life on earth was reduced to a level of diversity not seen since the Cambrian. An estimated 50% of families (267 out of 526. Erwin, p. 86), and perhaps as much as 90% of all species, disappear from the fossil record abruptly at the PTB (Sepkoski, 1986). These include trilobites, fusulinid foraminifera, graptolites, blastoids, acanthodians, placoderms [actually, graptolites and placoderms seem to have disappeared before PTB, perhaps at the end of the Devonian], rugose and tabulate corals, as well as many plants are animals, disappear from the geologic record. Taxa that were not wiped out altogether were nevertheless greatly reduced in diversity. This includes 98% of the crinozoans, including all of the inadunates and camerates, 96% of the anthozoans, 80% of the brachiopods, including all of the Orthids and productids, 79% of the bryozoans, including all of the fenestrates, trepostomes, and cryptostomes, 8 families of ostracods, 10 superfamilies of ammonoids, 5 families of sharks, and 8 families of bony fishes (McKinney, 1987; Lemon, 1993, p. 318). Although marine invertebrate life was by far the hardest hit, there were also large reductions amongst tetrapod families (67% of 'reptiles' and amphibians), insects (30%), and plants as well. For a thorough discussion of the PTB, see D. Erwin, 1993. In many widely-seperated P-Tr sections, there is a very abrupt but short-lived enrichment of spores and fungal material. This "fungi" spike has been reported from P-Tr sections in Greenland, the Zechstein Basin, the southern Alps, and other locations throughout the former Tethys sea (Eshet, Yoram., Rampino, Micheal., and Henk Visscher., 1995, Fungal event and palynological record of ecological crisis and recovery across the Permian-Triassic boundary, Geology 23: 967-970).
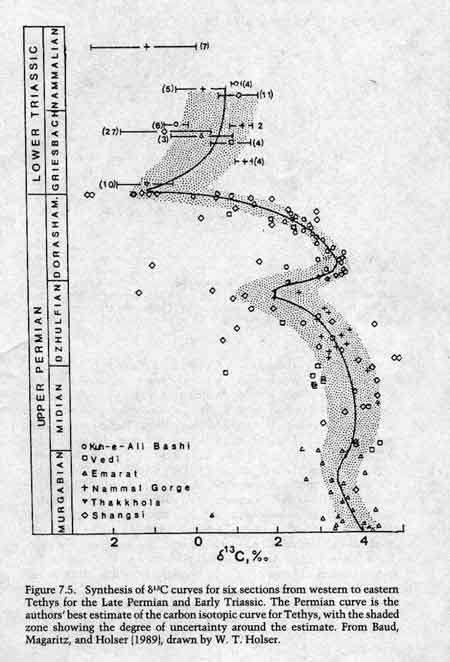
From Erwin, 1994, p. 195. del 13C curves from Kuh-e-Ali Bashi, northwest Iran, Vedi, Armenia, Emarat, Iran, Nammal Gorge, Pakistan, Thakkola, Nepal, and Shangsi, China. Note that there is very little scatter, and most of the scatter which does exist seems to be associated with the Shangsi section. del 13C curves from other PTB sections around the world document the same negative excursion.
A major and abrupt 13C isotopic excursion from about 3 per mil down to -1.5 per mil has been documented in brachiopod shells and whole rock carbonates from numerous PTB sections around the world, including the Delaware Basin, Greenland, West Spitzbergen, the Carnic Alps Austria, Slovenia, northwest Iran, Armenia, Nepal, Pakistan, New Zealand, and several locations in China (Baud et al. 1989; Magaritz et al. 1983; Dolenec 1996, 1998; Krull et al. 2000; Twitchett et al. 2001). Erwin notes that "the isotopic signatures are so similar from sections ranging from restricted basins to open marine that the only reasonable conclusion is that the major shifts are globally synchronous events" (p. 198). Large 13C excursions have also documented in terrestrial paleosols at the Permo-Triassic boundary. Krull and Retallack (2000) write:
A large carbon isotopic offset of as much as 10‰ in whole paleosol profiles across the Permian-Triassic boundary indicates significant changes in the soil biogeochemistry and the soil-atmosphere system. Early Triassic paleosols are distinctive in their extremely low 13C values (to 242‰) and often show an anomalous 13C depth distribution compared to both Permian paleosols and modern soils. (O’Brien and Stout, 1978; Stout and Rafter, 1978; Becker-Heidmann and Scharpenseel, 1990, 1992).
A pronounced shift toward more negative 13C values occurs within the last coal seam of the Late Permian Buckley Formation at 256 m (Fig. 2A), and low isotopic values continue into the overlying Early Triassic Fremouw Formation (average is 231.4‰). This shift toward negative 13C values in the terminal Permian, the persistently low isotopic values, and the lower TOC values in the Early Triassic, are consistent with results from other isotopic studies (e.g., Magaritz et al., 1992; Morante, 1996) and suggest that this excursion at the Buckley-Fremouw contact marks the Permian-Triassic boundary.
Global occurrence of such highly depleted carbon isotopic values in Earth’s history is rare. The only other time in Earth’s history when 13C values as low as the ones in these Early Triassic paleosols are detected globally was during a brief interval of the Precambrian (Hayes et al., 1983; Hayes, 1994; Holland, 1997).
The Latest Paleocene Thermal Maximum
The latest Paleocene Thermal Maximum (LPTM) saw the most abrupt warming event ever documented. It occured as a rapid warming spike about 55My, lasting >10k years, superimposed on a gradual warming trend began in the mid Paleocene and continued into the Eocene. Katz et al (1999) notes that "over a 10,000- to 20,000-year interval about 55.5 million years ago, Earth's climate and oceans warmed as deep-ocean and high-latitude surface water temperatures soared by 4° to 8°C." The effects of the this warming period are evident both on the continents and in the oceans.
For instance, between the Tiffanian (late Paleocene ~57 million years ago) and the beginning of the Wasatchian (earliest Eocene ~55 million years ago), several archaic mammal orders disappear (such as the Plesiadapidae and the Carpolestidae), and several orders of mammals (artiodactyls, perissodactyls, early primates such as Plesiadapis, and creodonts) make their first appearances in North America. There are also major perturbations in plant assemblages across the boundary. Whereas the mid Paleocene forsts of NA consisted almost entirely of deciduous trees, but by the late Palaeocene palms, cycads, and other forms not tolerant of hard frost were widespread in North America. See: Portrait of a Late Paleocene (Early Clarkforkian) Terrestrial Ecosystem and Mammal Evolution Across the Paleocene–Eocene Boundary, the LP-EE boundary in the middle east.
In the oceans, as much as 50% or all benthic forams disappear from the record at the LPTM. Crouch et al. (2001) have reported a dramatic response among dinoflagellates from the LPTM at sections in the southern (New Zealand) and northern (Austria) Hemispheres. Here, the authors report, "the dinoflagellate records are directly correlated with the CIE, benthic foraminifera extinction event, and calcareous nannofossil zonation. The results indicate that the inception of Apectodinium-dominated assemblages appears to be synchronous on a global scale, and that the event is precisely coincident with the beginning of the LPTM. Apectodinium markedly declined in abundance near the end of the LPTM. This Apectodinium event may be associated with (1) exceptionally high global sea-surface temperatures and/or (2) a significant increase in marginal-marine surface-water productivity. Such a globally synchronous acme of dinoflagellate cysts is unprecedented within the dinoflagellate cyst fossil record." Steineck and Smith (1996) report a dramatic faunal change in deeper water faunas at the LPTM from ODP site 689. Ostracodes at this site "underwent a sudden, dramatic turnover synchronous with a global extinction in deep-sea benthic foraminifers and with large-scale, short-lived negative excursions in the stable isotope record of foraminiferal calcite. A previously stable and long-lived ostracode assemblage, dominated by heavily calcified, chiefly epifaunal taxa, was replaced . . . by a taxonomically novel association of small, thin-walled opportunistic and generalist forms that persisted for ~25–40 k.y. Thereafter, ostracode faunas recovered and common bathyal forms returned, although species were smaller and/or less-heavily calcified than before the turnover."
Katz et al (1999) notes that "This extraordinary event, the latest Paleocene thermal maximum (LPTM), coincided with a remarkable decrease in the 13C/12C ratio of global carbon reservoirs that has been explained by the addition of isotopically light CO2 to the ocean, comparable to present-day fossil fuel input to the atmosphere" (Katz et al. 1999, Science. 286:5444. p. 1531). The isotopic signature of this event has been preserved in greatest detail in oceanic sediments, as a rapid negative excursion in the 18O and 13C isotopic values of the shells and calcite deposited in all the oceans during the lPTM. Dickens (2001) writes:
This latest Paleocene thermal maximum, or LPTM, coincided with profound global environmental change, including an extraordinary negative carbon isotope ( del 13C ) excursion (e.g., Thomas and Shackleton, 1996). At least 25 different Paleogene stable isotope records, including those constructed from bulk and foraminiferal carbonate of all oceans, and terrestrial carbonate and organic matter from multiple continents, now show part of a –2.5 to –3 ‰ anomaly in del 13C across the LPTM (e.g., Thomas, 1998). In high-resolution isotope records from open-ocean locations, the del 13C excursion can be described as a rapid decrease of at least –2.5 ‰ over 10 to 40 cm followed by a return to near initial values in a roughly logarithmic pattern over 100 to 400 cm, depending on sedimentation rate. Current work indicates that the main drop and gradual return in del 13C spanned less than 10,000 years and about 200,000 years, respectively (e.g., Bains et al., 1999; Katz et al., 1999; Röhl et al., 2000). The magnitude, timing, and global nature of the del 13C excursion across the LPTM implies an abrupt increase in the 12C/13C ratio of all carbon reservoirs in the exogenic carbon cycle, including deep and shallow oceans, the atmosphere and biomass (Gashydrates and methane blasts in the sedimentary record, presented at SEPM Diamond Jubilee).
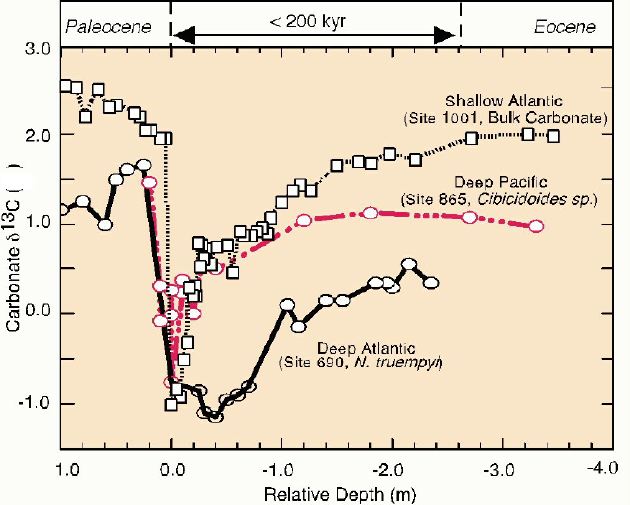
Dickens (2001) figure 2, below, shows high-resolution 13C profiles from three widely-seperated ocean cores. Note that the isotopic signal is clearly present in both the benthic forams and in the bulk carbonate measurements. Site 690 is the Maud Rise, South Atlantic (Kennett and Stott, 1991), and the 13C data is based on the shells of benthic forams. Site 865 is at the Allison Guyot, Equatorial Pacific (Bralower et al., 1995), and the curve was constructed using benthic forams Site 1001 is at the Nicaraguan Rise in the Caribbean (Bralower et al., 1997), and the curve was constructed using bulk carbonate isotopic measurements. Note the abrupt drop in 13C at the end of the Paleocene.
Although not represented on the graph, Katz et al (1999) present isotopic profiles from site 10051 at Blake Nose (subtropical western North Atlantic), using both benthic forams (Oridorsalis spp.) and bulk carbonate. The report the same isotopic profile at the LPTM section, which "display large negative excursions across the LPTM at Site 1051, with del18O and del13C decreases of ~1.5 and ~3.0 per mil, respectively, across a ~20-cm interval. . . . At Site 1051, the onset of the isotopic excursions coincides with the BFEE and is contemporaneous with similar isotopic changes in other deep-sea LPTM sections from around the world." [NOTE: BFEE= benthic foram extinction event]
Conclusion
While "uniformitarian" geology has a simple, empirically-based explanation for these isotopic variations, flood geologists will hardly be able to explain this data in terms of a single catastrophe lasting only months. For instance, why would these variations even exist in the first place, if all the marine organisms in the fossil record lived immediately prior to the flood? And even if all these marine organisms did NOT live immediately prior to the flood, instead accumulating the the 1600 or so years before the flood, there would still remain the immense problem of how the flood could possibly sort forams, brachiopod shells, conodonts and even inorganic calcite particles by *tiny* but consistent differences in O, C, and Sr isotopic composition, in virtually identical stratigraphic sequences, in basins seperated by thousands of miles?
More isotope stratigraphy
High-resolution C isotopic
variation in Chuar Group, AZ
Evolution
of the Sr and C Isotope Composition of Cambrian Oceans
The sulfur
isotopic composition of Neoproterozoic to early Cambrian seawater
C-isotope variation in the
Carboniferous
Carboniferous
isotope stratigraphy- Ural Mountains
Lower Permian 13C analyses of
teeth and charcoal
Permo-Triassic del 13C variations
in organic materials
Sr and ND isotope
stratigraphy at the PT boundary
S isotope variation in the late
Paleozoic
C isotope variations in the early.mid
Devonian
Carbon Isotopic
Evidence for Methane Hydrate Instability During Quaternary
Interstadials
Other links
Journal of
Chemical Geology
Gas Hydrates and
Methane Blasts in the Geological Record
Methane Hydrate
and Free Gas on the Blake Ridge from Vertical Seismic Profiling
Publications of
the Ocena Drilling Program
Proxies:
Oceanic records of Pleistocene climatic change
Isotope
geology text
Isotope
stratigraphy and paleooceanography
Paleoclimate and
paleooceanography
Chemostratigraphy
strontium
isotope stratigraphy
Variation in Sr
isotopic composition of seawater with time
Phanerozoic
strontium isotope curve
high-resolution
paleozoic strontium isotope stratigraphy
variation
in Sr isotopic composition of seawater with time
References
Baud, A., Magaritz, M. and Holser, W.T., 1989. Permian-Triassic of the Tethys: Carbon isotope studies. Geol. Rundsch., 78(2): 649-677.
Boggs, Sam, Jr., 1987. Principles of Sedimentology and Stratigraphy, Macmillan Press.
Crouch, E.M. 2001. Global dinoflagellate event associated with the late Paleocene thermal maximum. Geology: Vol. 29, No. 4, pp. 315–318.
Dolenec, T., Buser, S. & Dolenec, M., 1996. Stable isotope variations in the Permian-Triassic boundary sedimentary rocks from the Karavanke Mountains (Slovenia). J. Conf. Abstr. 1: 137-138.
Dolenec, T. & Ramovs, A., 1998. Isotopic changes at the Permian-Triassic boundary in the Idrijca Valley (W. Slovenia). Materiali in okolje 3–4:405–411.
Erwin, DH, 1993. The Great Paleozoic Crisis: Life and Death in the Permian. Columbia Univ. Press, New York
Gruszczynski, M., Halas, S., Hoffman, A. & Malkowski, K. 1989. A brachiopod calcite record of the oceanic carbon and oxygen isotope shifts at the Permian/Triassic. Nature.
Holser, Magaritz, and Wright. 1986. Chemical and Isotopic Variations in the world ocean during phanerozoic time. In O. Walliser, ed., Global Bio-events, pp. 63-74.
Kump, L. R. 1991. Interpreting Carbon Isotope Excursions: Strangelove oceans. Geology 19:299-302.
Holser, W.T., Schoenlaub, H.-P., Attrep, M., Boeckelmann, J., Klein, P., Magaritz, M., Orth, C.J., Fenninger, A., Jenny, C., Kralik, M., Mauritsch, H., Pak, E., Schramm, J.-M., Stattegger, K. & Schmöller, R., 1989. A unique geochemical record at the Permian/Triassic boundary. Nature, 337 (6202): 39-44.
Krull, S.J., and Retallack, J.R. 2000. 13C depth profiles from paleosols across the Permian-Triassic boundary: Evidence for methane release. GSA Bulletin, September.
Krull et al. 2000. d13Corg chemostratigraphy of the Permian-Triassic boundary in the Maitai Group, New Zealand: evidence for high-latitudinal methane release. New Zealand Journal of Geology & Geophysics, 2000, Vol. 43: 21-32
Magaritz, M., R. Y. Anderson, W. T. Holser, and E. S. Saltzman, 1983. Isotope shifts in the late Permian of the Delaware Basin, Texas, precisely timed by varved sediments. Earth and Planet. Sci. Lett., 66: 111-124.
Magaritz, M., 1989. ¹³C minima follow extinction events: a clue to faunal radiation. Geology, v. 17, p. 337-340.
Oberhänsli, H., Hsü, K.J., Piasecki, S. and H. Weissert, 1989. Permian-Triassic carbon-isotope anomaly in Greenland and in the southern Alps, Historical Biology, 2, 37-49.
Steineck, P.L., and Thomas, E. 1996. The latest Paleocene crisis in the deep sea: Ostracode succession at Maud Rise, Southern Ocean. Geology: Vol. 24, No. 7, pp. 583–586.
Twitchett RJ, Looy CV, Morante R, Visscher H, Wignall PB, 2001. Rapid and synchronous collapse of marine and terrestrial ecosystems during the end-Permian biotic crisis. Geology 29 (4): 351-354.
Wang, K., Geldsetzer, H.H.J., and Krouse, H.R., 1994. Permian-Triassic extinction: organic d 13C evidence from British Columbia, Canada. Geology, v. 22, p. 580-584.
Xu, D-Y and Yan,Z., 1998. Carbon isotope and iridium event markers near the Permian/Triassic boundary in the Meishan section, Zhejiang Province, China. Palaeogeography, Palaeoclimatology, Palaeoecology, vol. 104, pp 171-176.