10/18/09
Amid last week’s headlines about the record Federal deficit
of $1.4 trillion, there are some encouraging signs when one looks at the
trends. To do this I look at the year over year change in Gross Public Debt (http://www.geocities.com/petegersb/FederalDebt.GIF
), which provides a true picture of deficit spending without the accounting distortions
introduced by off-budget items such as the cost of the
The ratio of debt to GDP, unfortunately, will continue to
rise until the rate of debt creation falls below the level of GDP growth. That
ratio has been increasing, with only a brief interruption during the
Investors aren’t worried about the debt or much of anything else. Stocks made another higher 13-day cycle peak on Thursday - day 9 of the cycle (http://www.geocities.com/petegersb/MarketCap-Daily.GIF , http://www.geocities.com/petegersb/SP500.GIF , http://www.geocities.com/petegersb/NasdaqComposite.GIF, http://www.geocities.com/petegersb/Russell2000.GIF). Is it the October peak that I’ve been looking for? Perhaps not. With the 20-wk cycle almost 15-weeks old, and the overbought 9-mo cycles over 7 months old, they are ripe for a peak. However, the 26-day cycle is only 10-days old. Most indicators for the 10-week cycle suggest that it too is only 10-days old, but that cycle has been very irregular and poorly defined lately. Despite rising DStocs for the 26-day and 10-wk cycles, the short-term composite has turned down, and that’s been a very good precursor to each short-term correction since May. So, a short-term correction appears highly likely – especially since the rally is encountering resistance at the 50% retracement of the last two bear markets (http://www.geocities.com/petegersb/Overview-MarketCap.GIF ). But unless this 13-day cycle can move below its last low of October 2, there is no evidence that we have seen the peak of this 9-mo cycle. And even if we have, many indicators are positioned much like they were in late 2003 (http://www.geocities.com/petegersb/2003_Comparison.GIF , http://www.geocities.com/petegersb/A-D_DStoc_NYSE.GIF ) when no correction of any significance materialized until more than a year after the March bottom. I wouldn’t count on that happening again, but you have to keep that possibility in mind when tempted to sell before evidence of an intermediate peak. The peak may have occurred last Thursday, but the 26-day and 10-week cycles suggest the likelihood of at least a test of that peak during the next 13-day cycle rally. We can expect such a test in roughly 2 weeks, with a higher probability of an intermediate top at that time.
Sentiment
Advisory Services (http://www.geocities.com/petegersb/InvestorsIntelligence.GIF ) presumably remain optimistic enough to mark a 9-mo cycle peak, but the data hasn’t been updated in several weeks. Given the market action it’s unlikely that they are now less optimistic. Individual Investors (http://www.geocities.com/petegersb/AAIIsentiment.GIF ) are now moderately optimistic as well. Combined sentiment (http://www.geocities.com/petegersb/SurveysCombined.GIF ) looks a bit toppy. The increase in optimism seems to be stalling at the top of the downtrend channel, but it hasn’t yet signaled a downturn for stocks.
Fundamentals
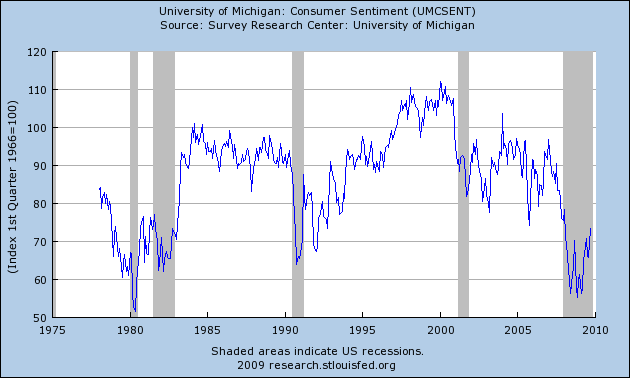
If Standard & Poor’s is on target, the trailing P/E on reported earnings peaked in the 3rd quarter at an astronomical 127, and it’s projected to drop to about 27 in the 4th quarter when abysmal earnings from 2008’s 4th quarter drop off. By contrast the average P/E from 1936 until 1991 was 13.31 (http://www2.standardandpoors.com/portal/site/sp/en/us/page.topic/indices_500/2,3,2,2,0,0,0,0,0,0,5,0,0,0,0,0.html ). Since 1991, when the P/E first breached 23, the average has been 24.5. Over the entire time span, it has averaged 16. If the S&P stays where it is now, the P/E is projected drop to about 24 by the end of 2010, and to about 18 by the end of 2011 (http://www.geocities.com/petegersb/EarnY-Y.GIF ). A fundamentalist has to wear rose-colored glasses to justify paying a higher-than-average P/E on hoped-for earnings two years in the future when the dividend yield is only 2%. But there are some reasons to be optimistic. Earnings in the 2nd quarter beat S&P’s expectations, and so far are doing so in the 3rd quarter as well. Corporations have managed this performance largely through cost cutting by using fewer workers with little or no wage increases or actual cuts for those still employed. The falling dollar has helped on foreign earnings and more robust exports. But those factors have limits, and sustained earnings improvements will eventually depend on revenue growth. Revenue growth will depend on GDP growth, and there too there is hope. The stimulus seems to be turning the economy and only about half has been spent so far. We could see more upside surprises. Coming inflation will probably also inflate nominal earnings beyond current expectations, but that effect will likely be more than offset by higher interest rates and correspondingly lower P/E’s - unless today’s irrational exuberance persists. That could happen. It seems that the Wall Street brokers and bankers that were the primary culprits in last year’s meltdown haven’t learned many lessons. But consumers appear to have stopped spending beyond their means as the savings rate has turned positive. As the recession ends and their confidence increases (http://www.geocities.com/petegersb/UMCSENT_Max_630_378.png ), they may well return to their profligate ways. If not some of those saving will find their way into stocks and bonds, thereby helping to hold P/E ratios up and interest rates down.
Treasury Bonds (http://www.geocities.com/petegersb/Treasury-20yr.GIF ) broke slightly below the 10-wk moving average. A 13-day cycle upturn couldn’t produce a rally, but it did stem the decline. The oversold 26-day cycle should soon help out and produce a short-term rally. But the 20-wk cycle has turned down. Any short term rally will probably meet resistance at the declining 9-mo moving average. Bond sentiment (http://www.geocities.com/petegersb/BondSentiment.GIF ) remains moderately favorable. Inflation expectations rose again last week (http://www.geocities.com/petegersb/CPI.GIF ). Don’t count on sentiment to rescue treasuries.
Inflation Protected Treasuries (http://www.geocities.com/petegersb/TIPs.GIF) gained a little last week on rising inflation expectations. They remain above both the 10-wk and 9-mo moving averages, and the short-term composite has turned up. The intermediate term remains unattractive, but less so than conventional treasuries.
Corporate bonds ( http://www.geocities.com/petegersb/CorporateBonds.GIF ) also drifted slightly below the 10-wk moving average, but in this case the 10-wk MA is above a rising 9-mo moving average. So the 9-mo should provide support rather than resistance. Cycles are similar to treasuries – near a short term bottom in a continuing intermediate decline.
Municipal bond’s (http://www.geocities.com/petegersb/MunicipalBonds.GIF ) continued their correction off of a right-translated 20-wk cycle peak, but established the expected short-term bottom between the rising 9-mo and 10-wk moving averages on Wednesday. It may prove to be a bottom in the 18-week-old 20-wk cycle as well.
Crude oil (http://www.geocities.com/petegersb/CrudeOil.GIF ) surged to a new recovery high last week just above the 38.2% retracement as all the short cycles helped out the aging 20-wk cycle and overbought 8-month-old 9-mo cycle. But all of the short cycles and the short-term composite are now overbought and past middle age. Look for at least a short-term peak this week and perhaps an intermediate peak as well.
Natural gas (http://www.geocities.com/petegersb/NaturalGas.GIF ) was essentially unchanged last week as the 13-day cycle bounced off of a low late in the week. The 23.6% Fibonacci retracement at $5 has provided formidable resistance during October, but the short cycles should provide support to the young and rising 20-wk cycle this week. If so, the rising 10-wk moving average should move above the declining 9-mo moving average – a necessary condition for a long-term uptrend. Natural gas may have finally turned the corner.
Energy stocks (http://www.geocities.com/petegersb/EnergySPDR.GIF) were the strongest sector last week, reaching new recovery
highs above the 38.2% Fibonacci retracement. But all cycles are now overbought
or very close to it. The 9-mo cycle is 7 months old. The 20-wk cycle is 14
weeks old. The 10-wk cycle is 7 weeks old. The 26-day and 13-day cycles are 10
days old. Both composites are overbought. The rally may have a little left, but
it’s very close to the time for a correction. When it’s over, this looks like a sector to
overweight.
Gold (http://www.geocities.com/petegersb/GoldBullion.GIF) ended essentially flat last week, but it established
another new high on Wednesday. All the cycles are overbought except the 13-day
cycle. It’s now in decline, but it’s already reached its life expectancy. The
26-day cycle is middle aged. It needs a higher 13-day cycle to establish a
right translated peak. The 10-week cycle is 9-weeks old and trending downward,
but the downtrend should end at the next 26-day cycle bottom near the end of
October. November and December are
seasonally strong for gold. If the correction holds the 10-wk moving average,
as appears likely, gold will again look like a buy.
Gold Stocks (http://www.geocities.com/petegersb/GoldStocks.GIF
) were also flat last week and established a new recovery high at a short-term
peak. The short-term correction appears likely to hold above the 10-wk moving
average as the longer cycle uptrends continue to provide support.
The Dollar (http://www.geocities.com/petegersb/Dollar.GIF) slid to another 14-month low as might be expected in conjunction with the oil and gold rally. Unsurprisingly, it established a 13-day cycle low as oil and gold made a corresponding high. It should be near a 9-mo low as stocks near a 9-mo peak. As you can see from the chart, the negative correlation has been very high.