10/11/09
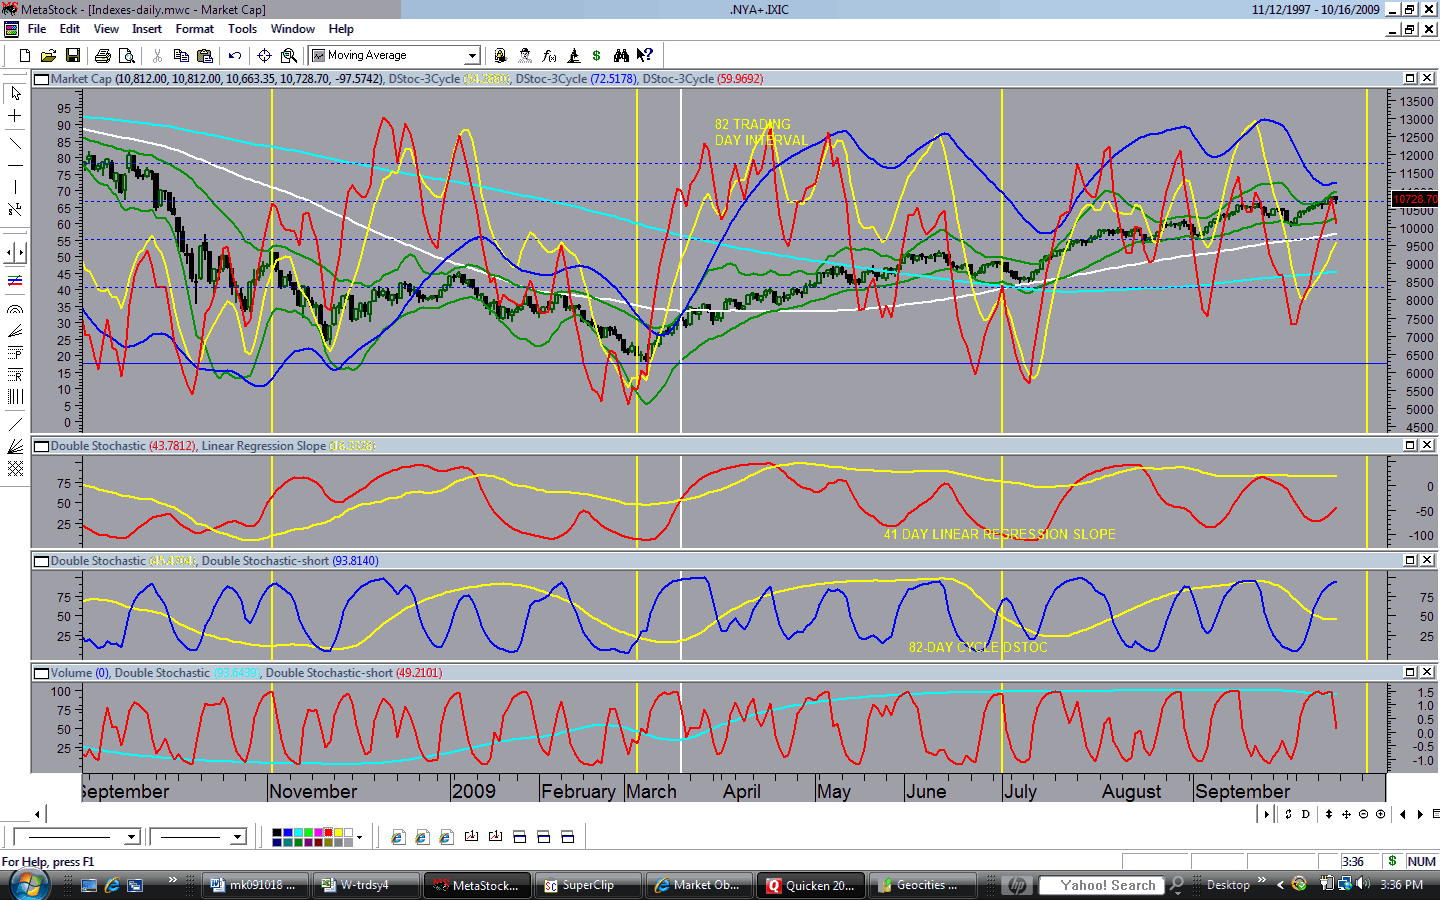
The market has held up quite well during the last 4 weeks while I was vacationing, but it remains to be seen if it will fulfill my expectation of an early October peak in the 7-month-old 9-mo cycle. While the DJIA reached a new recovery high in October, the broad-based cap-weighted indexes remain slightly below their September peaks (http://www.geocities.com/petegersb/MarketCap-Daily.GIF ). We have a 26-day cycle rally in progress that is only 5 days old after bottoming on day 22 of the prior cycle. Barring a left translated peak, it should be able to push the broader indexes to new recovery highs during the remainder of October. If it fails to do so, we can assume that 1080 on September 23 was the 9-mo cycle high as suggested by the DStoc on the weekly chart (http://www.geocities.com/petegersb/Overview-long.GIF ). But a similar downturn in October of 2003 failed to produce a meaningful correction.
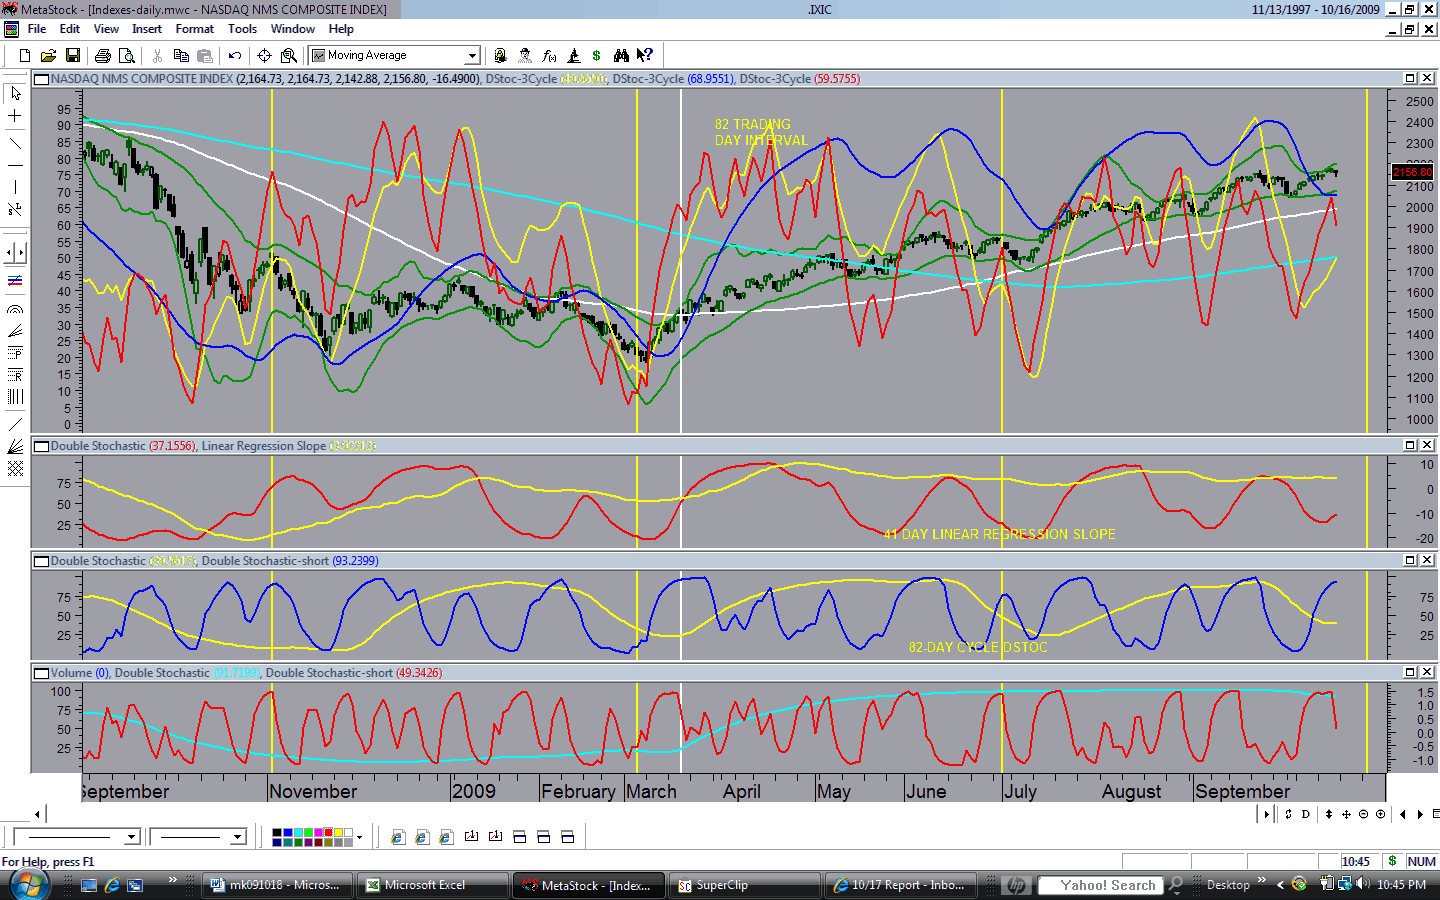
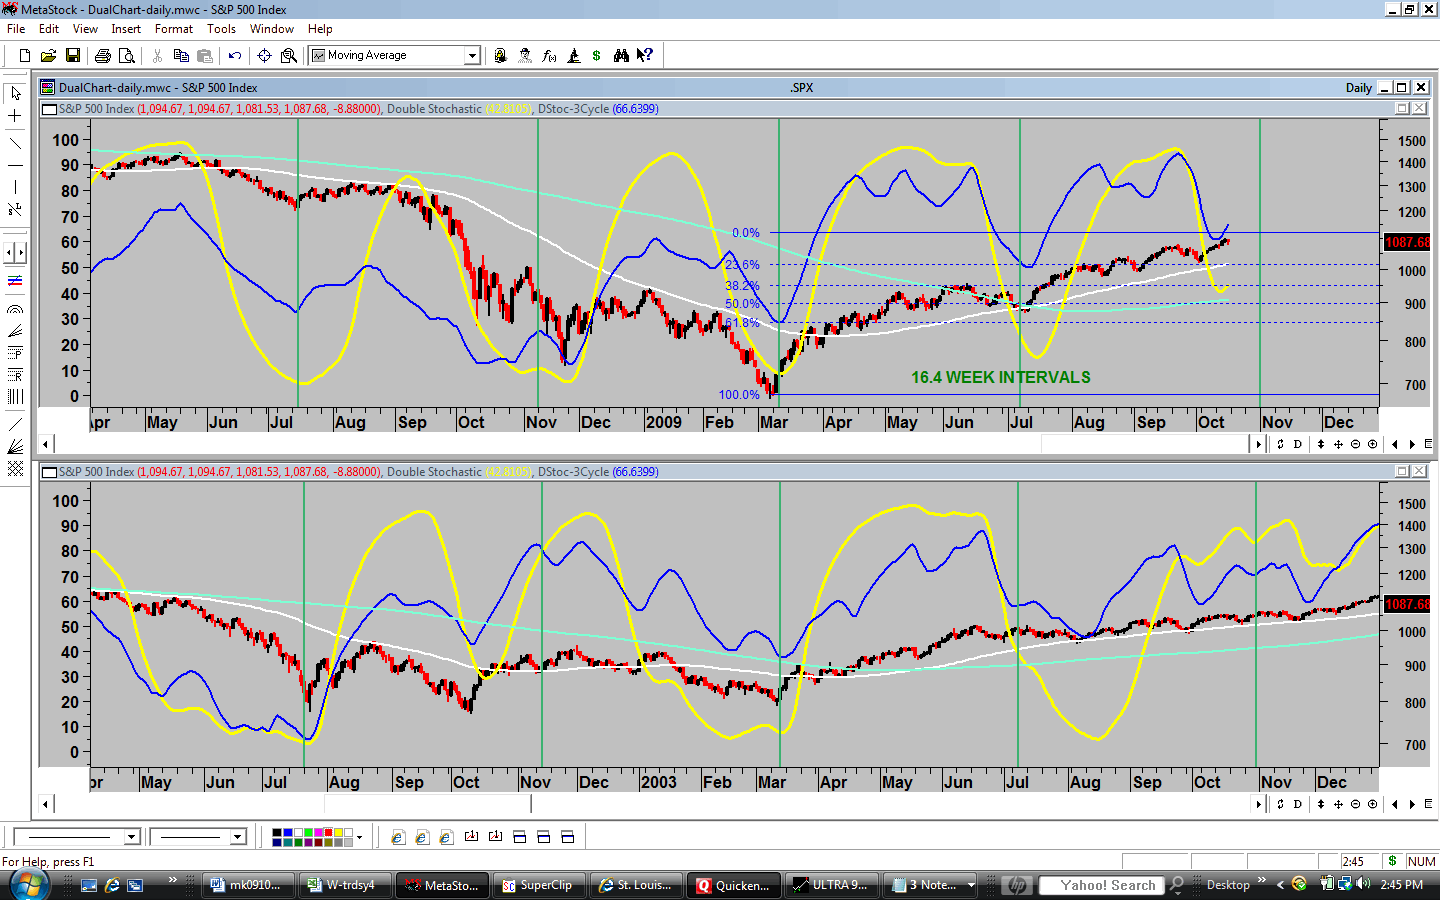
Aside from the advanced age of the 9-mo cycle, its second 20-week cycle was then 11 weeks old – probably past middle age. It’s now over 13 weeks old, and the average duration has contracted to 16.4 weeks. The 20-wk cycle DStoc has turned down from overbought territory on all of the indexes (http://www.geocities.com/petegersb/SP500.GIF , http://www.geocities.com/petegersb/NasdaqComposite.GIF, http://www.geocities.com/petegersb/Russell2000.GIF ), but it’s not unusual for that to happen in advance of an extreme right translated peak. We can conclude that stocks are very close to a 20-wk cycle peak and therefore also a 9-mo cycle peak, and that the peak either occurred near current levels in late September of will likely occur later in October.
Conventional wisdom expected a weak September. That didn’t happen despite the fairly deep 26-day cycle selloff that began on September 23. That selloff inspired expectations that October would live up to its reputation as the month that produces the most bottoms. But the cycles suggest that the market won’t reach a correction low before November (16+ weeks after the July 20-wk cycle low) or December (9 months after the March 9-mo cycle low). While both of these cycles are now marginally within their time windows for a low, the cycle indicators suggest that last week’s rally began at a short-term low, but not an intermediate-term low.
If 1080 was the peak on the SPX (http://www.geocities.com/petegersb/SP500.GIF), now is the time to sell. But the shorter cycles suggest that last week’s rally should extend a little further. Both the 13 and 26-day cycle are only 5 days old, and their DStocs are trending higher. While the 13-day cycle is moderately overbought, the 26-day cycle is far from it. Whether their peaks translate right or left probably depends on the status of the 10-wk cycle. Unfortunately, that’s not yet clear. Its DStoc turned down with the late September decline, suggesting a possible left-translated peak in the 3rd week of the cycle. But the indicator may simply not have been able to filter out the relatively deep 26-day cycle correction. Next week’s action should provide some insight. If the rising 26-day cycle can overcome the overbought 13-day cycle and follow the Dow to a new recovery high, we can conclude that the indicator was incorrect. But if the rally fails at this level, it will be indicative of left translated 13, 26 and 52-day (10-wk) cycle peaks and right translated peaks in the 20-wk and 9-mo cycles - the beginning of a decline into November or December intermediate lows.
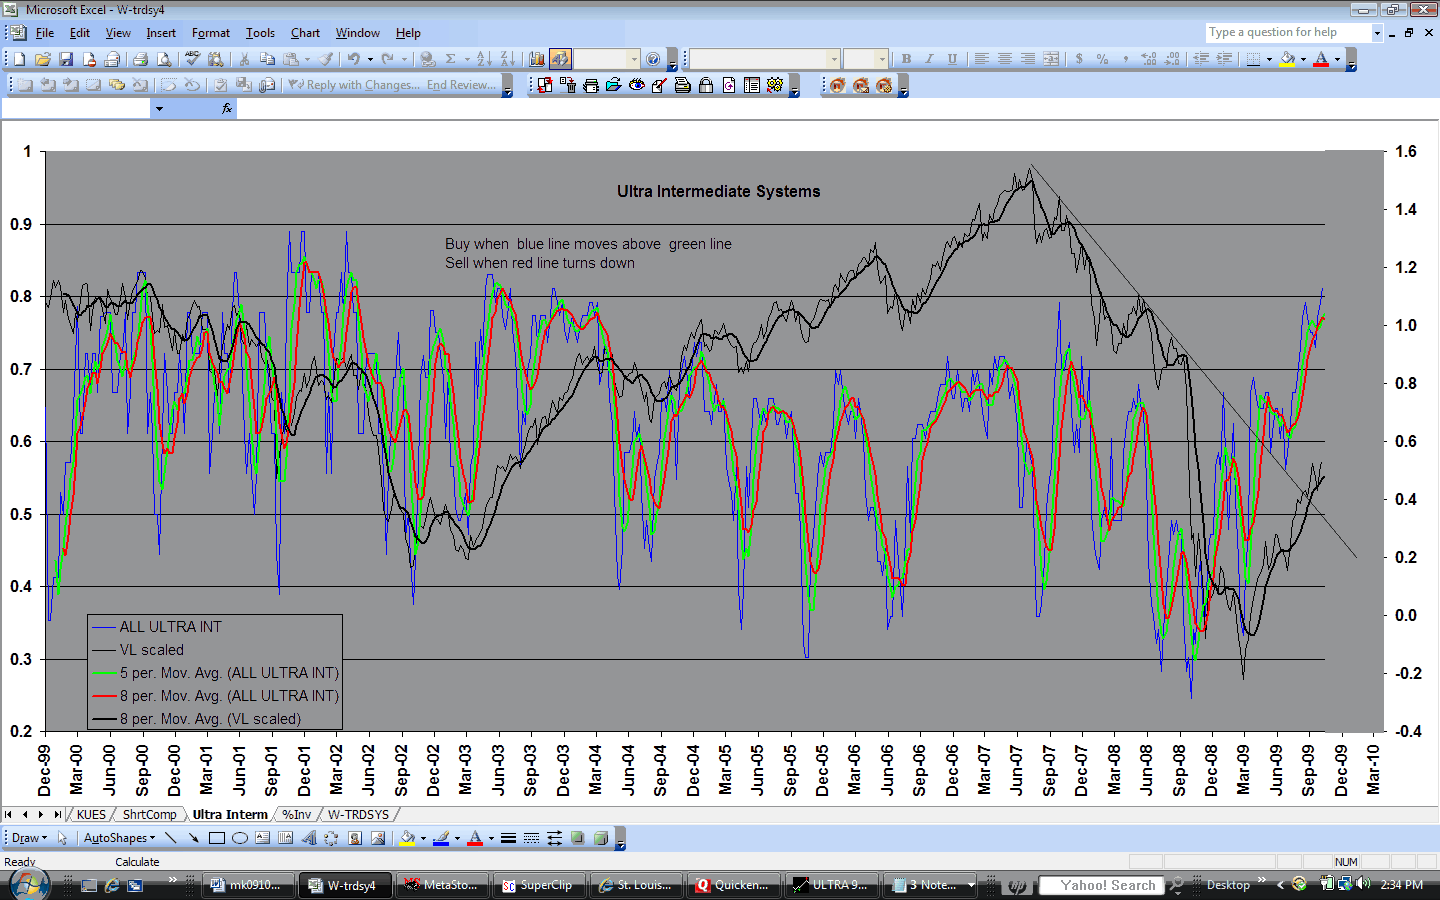
The ULTRA Intermediate Composite (http://www.geocities.com/petegersb/UltraIntermediate.GIF ) was on the verge of a 9-mo cycle sell signal a week ago, but it reversed course last week to maintain its mid-July buy signal. The McClellan Summation Indexes (http://www.geocities.com/petegersb/A-Dsummation-NYSE.GIF , http://www.geocities.com/petegersb/A-Dsummation-OTC.GIF ) also reversed course to the upside last week as they continue to form a very complex top. Another reason not to assume that an intermediate top is a done deal is the persistent similarity between the current price and cycle action and that of 2003 (http://www.geocities.com/petegersb/2003_Comparison.GIF ). There was no significant correction in the last quarter of 2003. However there is one very significant difference that suggests we will see a significant correction in the current quarter. Note that the “20” week cycle was running at a regular 20.8 weeks in 2003. Now it has contracted to a regular 16.4 weeks. If the 16.4 week interval persists, we would see a significant low near the beginning of November. If it were to expand to intervals similar to those seen in 2003, we would expect a bottom in early December. All we know now is that this cycle tends to range between 14 and 26 weeks. Its corrective phase may or may not be deep. So we will wait for the sell signals to exit and the subsequent buy signals to re-enter.
Sentiment
Advisory Services (http://www.geocities.com/petegersb/InvestorsIntelligence.GIF ) are optimistic enough to mark a 9-mo cycle peak, but Individual Investors (http://www.geocities.com/petegersb/AAIIsentiment.GIF ) remain moderately pessimistic. We need a surge of optimism from the latter group to mark a 9-mo cycle peak, and that probably will only happen with a further price advance.
Fundamentals
Standard & Poor’s has extended its top-down earnings guesstimates (http://www.geocities.com/petegersb/EarnY-Y.GIF ) into 2011. If they are reasonably accurate this time, and if the SPX sells at a 20 multiple on operating earnings in two years, it would reach 1250. Such a high multiple is a lot to ask for. Stocks are expensive.
Treasury Bonds (http://www.geocities.com/petegersb/Treasury-20yr.GIF ) rallied up to their declining 9-mo moving average where they appear to have established an intermediate peak. Last week they declined to the rising 10-wk moving average where the oversold 13-day cycle may produce temporary support. Although the aging and overbought 20-wk cycle suggests a likely intermediate decline, bond sentiment (http://www.geocities.com/petegersb/BondSentiment.GIF ) suggests otherwise. The year-over-year CPI, while still negative, has turned up http://www.geocities.com/petegersb/CPI.GIF ). It’s not yet enough to frighten bondholders, but more difficult comparisons later this year will soon show a more rapidly rising trend on this chart. Treasuries remain unattractive on both a fundamental and technical basis
Inflation Protected Treasuries (http://www.geocities.com/petegersb/TIPs.GIF) also appear to have established an intermediate peak a week ago, but their pullback has been milder than that of conventional treasuries. Unlike conventional treasuries, the price remains above both 9-mo and 10-wk moving averages and both of those averages are rising. TIPS are also unattractive, but they are more attractive than conventional Treasuries.
Corporate bonds ( http://www.geocities.com/petegersb/CorporateBonds.GIF ) experienced their worst correction in 7 months during the last two weeks. Their short-term oversold condition argues for holding at the rising 10-wk moving average, but the aging and overbought 9-mo cycle suggests it will be only a temporary reprieve. This pullback may be a harbinger of the coming correction in stocks.
Municipal bond’s (http://www.geocities.com/petegersb/MunicipalBonds.GIF ) also had a steep correction off of a right-translated 20-wk cycle peak. They closed Friday at the rising 10-wk moving average with 10-wk and shorter cycles oversold. A bounce this week appears likely and it may be the beginning of a turn in the 17-week-old 20-week cycle.
Crude oil (http://www.geocities.com/petegersb/CrudeOil.GIF ) established a 10-wk cycle bottom at the end of September and is now a week and a half into its 2nd 10-wk cycle rally within the current 20-week cycle, which is now 12 weeks old. The 9-month cycle is now 8 months old, and it has gone nowhere during the last 4 months as it forms a very broad 9-mo cycle peak. The 10-wk cycle may drive crude to a slightly higher high before it fizzles, but the 13-day cycle is 7 days old and overbought. The rally may extend a few more days, but the cycles suggest that the price will soon turn down and reach a 9-month cycle low in a month or two – along with stocks.
Natural gas (http://www.geocities.com/petegersb/NaturalGas.GIF ) surged during the last few weeks for no particular reason other than the oversold 10 and 20-wk cycles having met their normal life expectancy. From its 9/4 low of $2.41, it surged to a high of $5.12 last Tuesday – well above both the 9-mo and 10-week moving averages. The 13 and 26-day cycles have been declining since then, but the price has held up well. The 10-wk cycle is now overbought and middle aged, so a further pullback appears likely. But the 20-wk cycle is only 5 weeks old and should support a further advance after the short term correction finds a bottom. That correction should find strong support at the 9-mo moving average near $4.
Energy stocks (http://www.geocities.com/petegersb/EnergySPDR.GIF), helped by the move in Natural Gas, have recently been
stronger than crude oil, but the cyclic pattern is similar – a strong
short-term rally in a 13-week-old 20-wk cycle and a 7-month-old 9-mo cycle. Higher
prices appear likely before these longer cycles reach a peak.
Gold (http://www.geocities.com/petegersb/GoldBullion.GIF) was threatening a new high when I wrote my last report,
but success was hardly assured. Last week it broke out with gusto. In the
process it established a massive inverted head & shoulders pattern spanning
a period of 18 months. The price range between the head and the neckline
spanned nearly 300 points producing a 1300 objective for Gold. However, both
the short and intermediate composites are moderately overbought. The overbought
13-day cycle is due for a correction that probably began on Friday, but the rising
26-day cycle should support prices a little longer. It’s the second 26-day
cycle of this 8-week-old 10-week cycle, so its peak should also produce a
right-translated peak in the 10-week cycle. In the short-term, this rally is
probably near an end. But the 20-wk and 9-mo cycles are only 8 weeks old,
leaving ample time for a further strong advance after the 10-wk cycle corrects.
November and December are seasonally
strong for gold.
Gold Stocks (http://www.geocities.com/petegersb/GoldStocks.GIF
) held the 10-wk moving average as expected, and then rallied to new 2009
highs. However, they remain substantially below 2008 peaks. Short and
intermediate composites are rising and neither is overbought.
The Dollar (http://www.geocities.com/petegersb/Dollar.GIF) continued lower to support at the 76.4% Fibonacci retracement of last year’s rally, then rallied back up to the declining 12-week weighted moving average that has put a lid on each rally attempt during the 2009 decline. The subsequent decline is now testing the recent low. The price actions as well as the cycle indicators are pretty much the mirror image of the SPX. If the recent lows can hold it would reinforce indications that stocks are topping, but the indicators suggest a little more downside before the dollar reaches an intermediate bottom.