On 7/28 I will send a copy of my WCCC PowerPoint briefing to those that have requested it. If you want to be added to that mailing list, send a note to [email protected] .
7/26/09
In my last letter 3 weeks ago, I laid out 4 potential
scenarios for the 20-wk cycle correction based on the uncertain status of the
9-mo and 4-year cycles. The pattern that subsequently evolved corresponds most
closely to the scenario that I thought was second most likely with about a 30%
probability. I wrote: “If March was both
a 4-year and 9-mo cycle low, we would expect a shallow 20-wk cycle dip during
July; followed by a rally comfortably above the June highs, and then a steeper
decline into a year-end 9-mo cycle low.
Both corrections would hold well above the March lows and probably above
the November low. The strong recent 20-wk cycle rally into a right-translated
peak fits this scenario well, so we have to assign it a relatively high
probability despite November having better 9-mo cycle low credentials than
March, March being considerable outside the normal time window for a 4-yr cycle
low, and the 4-yr cycle oscillator (http://www.geocities.com/petegersb/2-YrChange.GIF
) failing to move above its 10-wk moving average. Furthermore, it’s unlikely
that the first 9-mo cycle of a new 4-year cycle would already be in decline as
so many indicators suggest (McClellan
Summation Indexes (http://www.geocities.com/petegersb/A-Dsummation-NYSE.GIF
, http://www.geocities.com/petegersb/A-Dsummation-OTC.GIF
), ULTRA Intermediate Composite (http://www.geocities.com/petegersb/UltraIntermediate.GIF
)), so this is not the highest probability scenario.”
The 20-week cycle dip, at 9%, was shallow in the context of recent volatility, and it held well above the November low. The dip ended a little early at 18 weeks, and the subsequent rally has already moved prices and the Advance-Decline Line comfortably above their June highs (http://www.geocities.com/petegersb/TotalMarket.GIF ). At an age of almost 5 months, the 9-mo cycle now promises a likely right translated peak well above the 9-mo moving average – another indication of new bull market, because that situation rarely occurs unless the 4-year cycle is rising (http://www.geocities.com/petegersb/Overview-long.GIF ). The fact that the correction found support at the 9-mo moving average further strengthens the 4-year cycle bull market hypothesis. All that is now needed to cement the deal is a move above the 2-yr weighted moving average, which is currently at 1035 on the SPX, but will be lower when the price reaches it. That level is likely to provide stiff resistance if neither the 38% retracement of the decline at 1007 or my long-term trend indicator at 990 do not first produce a peak in the overbought 9-mo cycle.
In the short-term, I expect a downturn below 1000. The 13 and 26 day cycles are overbought and both are 10 days old (SPX (http://www.geocities.com/petegersb/SP500.GIF ), (NYSE Composite (http://www.geocities.com/petegersb/NYSE.GIF), Russell 2000 index (http://www.geocities.com/petegersb/Russell2000.GIF ). The 13-day cycle should correct this week, but given the young age of the 10 and 20-wk cycles, I would expect that first correction to hold above the June high of 956. The subsequent 13-day cycle rally is likely to produce a 26-day cycle peak above current levels. The subsequent 26 day cycle correction should also be mild if my analysis is correct, and even the 10 week cycle correction, which is scheduled to bottom in late September, is likely to hold above the rising 10-wk moving average – now at 918. Subsequent corrections in the 20-wk cycle and the aging 9-mo cycle are now scheduled to bottom in early December. If the 4-year cycle bottomed in March, as I now believe is likely, those corrections would hold above the 9-mo moving average. It currently resides at 870, but will rise, probably above 900 by December, if this scenario holds. So I expect stocks to hold above 900 for the remainder of the year.
Where they peak is tougher call. The last bull market essentially defied gravity for almost a year after the March 03 low. After its first 20-wk cycle correction it rose for 6 weeks before encountering a mild 10-wk cycle correction and tacked on 10.7% before reaching the 20-wk cycle peak. We’ve already tacked on 12.6% since the July low, so that analogy isn’t much help. This market is clearly stronger than the 2003 liftoff. Once the SPX gets through about 1007, I don’t see any significant resistance until the 50% retracement at about 1120. I think it’s too late in the 9-mo cycle to reach that level on this attempt. So I expect the remainder of this year to trade between 900 and 1007 on the SPX – mostly in the upper part of that range. But if you want to take the optimistic view, a little imagination can identify an inverted head & shoulders pattern with a neckline that was broken at 960. That produces a minimum target of 293 points above that level, or 1253. That also happens to have been a congestion area in early 2008, and it is very close to the 61.8% Fibonacci retracement of the second Bush bear market at 1234. That could happen this year if the coming ecoomic recovery is much stronger than anyone expects, but more likely next year.
The NASDAQ Composite (http://www.geocities.com/petegersb/NasdaqComposite.GIF ) and NDX (http://www.geocities.com/petegersb/NDX.GIF ) have already moved through all of the overhead resistance levels mentioned, so I expect them to test the 50% retracement level at about 2070 on the Composite and 1670 on the NDX. They should remain above about 1640 and 1320, respectively. There is no H&S pattern for these indexes.
Sentiment
Advisory services (http://www.geocities.com/petegersb/InvestorsIntelligence.GIF
) and individual investors (http://www.geocities.com/petegersb/AAIIsentiment.GIF
) remain unenthusiastic about this rally. That’s a good thing for its longevity.
However, the five-week moving average is trending downward from the top of the down trending channel on the combined survey data (http://www.geocities.com/petegersb/SurveysCombined.GIF ), and that suggests a correction ahead.
Fundamentals
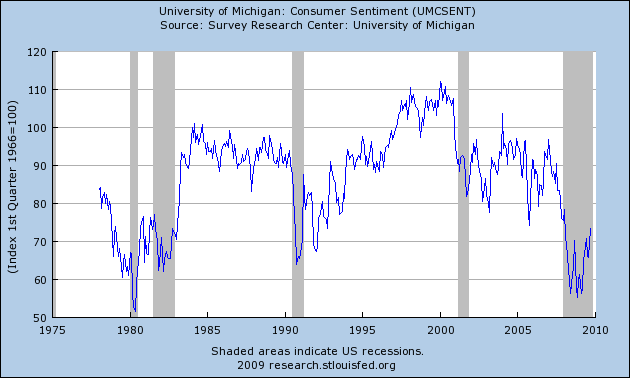
With 53% of companies reporting, S&P is estimating operating earnings for the 2nd quarter at $14.22 on a bottom-up basis (a 16.3% decline from a year ago), at $11.05 on a top-down basis (a 35.1% decline from a year ago), and reported earnings at $7.27 (a 43.5% decline from a year ago). The SPX is down 20.7% during the past year. So stocks are perhaps a little more expensive relative to earnings than they appeared to be a year ago. However, a year ago S&P was rapidly lowering future bottom-up earnings estimates to more closely conform to generally more accurate top-down estimates (which also proved to be much too high). That is not happening this year. Both top-down and bottom-up estimates have remained relatively stable in recent months. That’s the extent of the good news on earnings. The bad news is that 2010 top-down expectations (http://www.geocities.com/petegersb/EarnY-Y.GIF ) are only 3.1% better than 2009 expectations leaving a 21.2 P/E on 2010 operating earnings. Dividends as well as earnings are still declining (http://www.geocities.com/petegersb/Earn_Div_ROC.GIF ). Investors are clearly expecting better bottom-up operating estimates of a 33.5% improvement to materialize for operating earnings (a reasonable 13.2 P/E), and something better than the 23.9% improvement for reported earnings to also materialize (a bubble-like 26.2 P/E) . They have bid up the SPX price by 47% during the last 4 month while evidence accumulates that a banking meltdown has been averted and that the stimulus is slowing the rate of decline and gradually restoring confidence. Despite the fake out last summer, Consumer Confidence has proven to be a pretty good leading indicator for the end of a recession (http://www.geocities.com/petegersb/UMCSENT_Max_630_378.png ) and also a good coincident indicator for the end of a bear market (http://www.geocities.com/petegersb/MichiganConsumerSentiment.GIF ). It has now improved for 4 straight months – the approximate length of the rally in stocks.
The technical picture, which we can observe in real time, now looks much better than the apparent fundamentals, which we can observe only in hindsight. A year ago when 20-wk and shorter cycles looked much like they do now, stocks were 2 weeks into a weak 20-wk cycle rally that would culminate in a lower left-translated peak. Now stocks are 2 weeks into a 20-week cycle that has already produced a higher price than the last right-translated peak. Perhaps this time bottom-up earnings estimates will prove more accurate than top-down estimates. Investors seem to think so, or they are just desperate for a reasonable alternative to zero rate money market funds, almost zero CDs, and government bonds that are threatened by debt that is increasing as rapidly as it did at its 1983 peak rate when Reagan was in the early stages of doubling the Debt/GDP ratio (http://www.geocities.com/petegersb/FederalDebt.GIF ).
Will the current fiscal stimulus produce similar good
results for stocks and economy as it did then? Probably not.
Volker had broken the back of inflation, so stocks and the economy throughout
the 80’s had the monetary support of interest rates that were declining from
double digit rates. With interest rates already near zero and a massive supply
of new debt, we won’t have the tailwind of declining rates this time. Also Reagan inherited a record postwar low in
the ratio of Federal Debt to GDP, so there was room for increased debt without unduly
stressing the bond market. In contrast,
Obama inherited the highest ratio of Debt/GDP since 1951 – a level that is 2.4
times the level Reagan inherited despite some decline during the
Treasury bonds: The pullback in T-Bonds (http://www.geocities.com/petegersb/Treasury-20yr.GIF ) during the last few weeks moved prices back below the 10-wk moving average despite favorable trends in the 9-mo and 20-wk cycles, which are only 6-weeks old. The downtrend from a likely left-translated peak in the 6-wk-old 10-wk cycle reinforces the notion that the long-term downtrend from the beginning of this year remains intact. It appears likely that the June lows will hold on this 10-wk cycle, but will eventually be broken after the longer cycles turn down. However, Bond Sentiment (http://www.geocities.com/petegersb/BondSentiment.GIF ), which is quite negative but has begun a shift to increasing optimism, suggests that those longer cycles will not soon turn down.
Inflation Protected Treasuries (http://www.geocities.com/petegersb/TIPs.GIF) outperformed conventional treasuries by gaining very slightly during the last 3 weeks, but they continue to hold just below the downtrend line from early 2008. They also have held just above the 9-mo moving average, and the 9-mo cycle is now 9 months old and its DStoc is oversold. The 20-wk cycle appears to be 20-weeks old, so TIPs should be near an intermediate low. The 3 shortest cycles, however, are in downtrends. When they reach bottom, probably within 2 or 3 weeks, TIPS likely will be a good intermediate-term buy. Inflation expectations (http://www.geocities.com/petegersb/CPI.GIF ) are still rising in the face of lower reported inflation. Comparisons with the prior year will continue to make reported annual inflation appear to be negative until sometime this autumn, but by year-end comparisons will become increasingly difficult. Bond investors seem to already be anticipating the inflation kicker they will probably receive from the inflation protection feature next year.
Corporate bonds (http://www.geocities.com/petegersb/CorporateBonds.GIF ) continued to rise under the influence of a rising 9-mo cycle that is now middle aged. The 20-wk cycle is now 21 weeks old and overbought, but during its rise, only the 13-day cycle produced any noticeable price decline. Now prices have reached a level that precipitated substantial declines during the last year. Despite uptrends in both the short and intermediate composite, most cycles are in position for a likely decline. I expect corporate bonds to correct along with stocks in the short term. If they hold above the now rising 9-mo moving average on the correction, corporate bonds will probably be an intermediate-term buy.
Municipal bond’s
(http://www.geocities.com/petegersb/MunicipalBonds.GIF
) intermediate uptrend drove prices slightly above the 10-wk moving average,
but that uptrend appears likely to be interrupted in the near term by a
downturn in the short composite.
Crude oil (http://www.geocities.com/petegersb/CrudeOil.GIF ) almost reached my $57 intermediate target before reaching a short term bottom at $58.32. The short-term rally appears likely run a bit higher after a minor correction in the overbought 13-day cycle which is 9-days old. There is no evidence yet that the intermediate downtrend has been reversed.
Natural gas (http://www.geocities.com/petegersb/NaturalGas.GIF ) used its short-term rally to again threaten the downtrend line that has persisted for the last year – again without success. The 10-wk cycle is still supportive, but all the other cycles are either overbought or in young downtrends. It appears that another test of the lows is in store while gas continues its base building. Its only hope for a good rally in the intermediate term would appear to be a damaging hurricane season.
Energy stocks (http://www.geocities.com/petegersb/EnergySPDR.GIF) rallied back above the 9-mo and 10-wk moving averages
after reaching 10-wk cycle low in early July. The 10-wk cycle, and probably the
20-wk cycle, is only 2 weeks old, so they should support an intermediate
uptrend for several more weeks. However, the shorter cycles are very overbought
and ripe for a correction. I would expect any short-term correction to hold at
either the $47 or $49 level.
Gold (http://www.geocities.com/petegersb/GoldBullion.GIF) established a higher 10-wk cycle low on 7/8 and then
moved back above its 10-wk moving average. It continues to overcome the
downward pressure from declining 9-mo and 20-week cycles. The 13 and 26-day
cycles peaked last week, so we should see a brief correction before another
attempt at new highs by the 10-wk cycle. It may not succeed during this 10-wk
cycle, but likely will succeed after the 9-mo-old 9-mo cycle and 14-wk-old
20-wk cycle find their bottom.
Gold Stocks (http://www.geocities.com/petegersb/GoldStocks.GIF
) are similarly positioned in short and intermediate uptrends with an
overbought 26-day cycle and a 13-day cycle that has turned down from a higher
high. The 10-wk cycle rallied from a higher low. New highs will be far more
difficult than for the metal, but new 12 month highs appear likely either on
this 10-wk cycle or the next.
The Dollar (http://www.geocities.com/petegersb/Dollar.GIF), after an extreme left-translated peak in the 12-wk cycle, is threatening a new low for the year. However, the 3-wk and 6-wk cycle are oversold and due for a bottom, so a further breakdown will likely be delayed. The 62% Fibonacci retracement of last year’s second half rally ended 12-wk cycle declines in December and again in June. It’s less likely to succeed this time because the 12-wk cycle is only 8 weeks old and far from oversold. I expect a weak rally that is unable to penetrate the down trending 10-wk moving average to be followed by more new lows for the year.