5/31/09
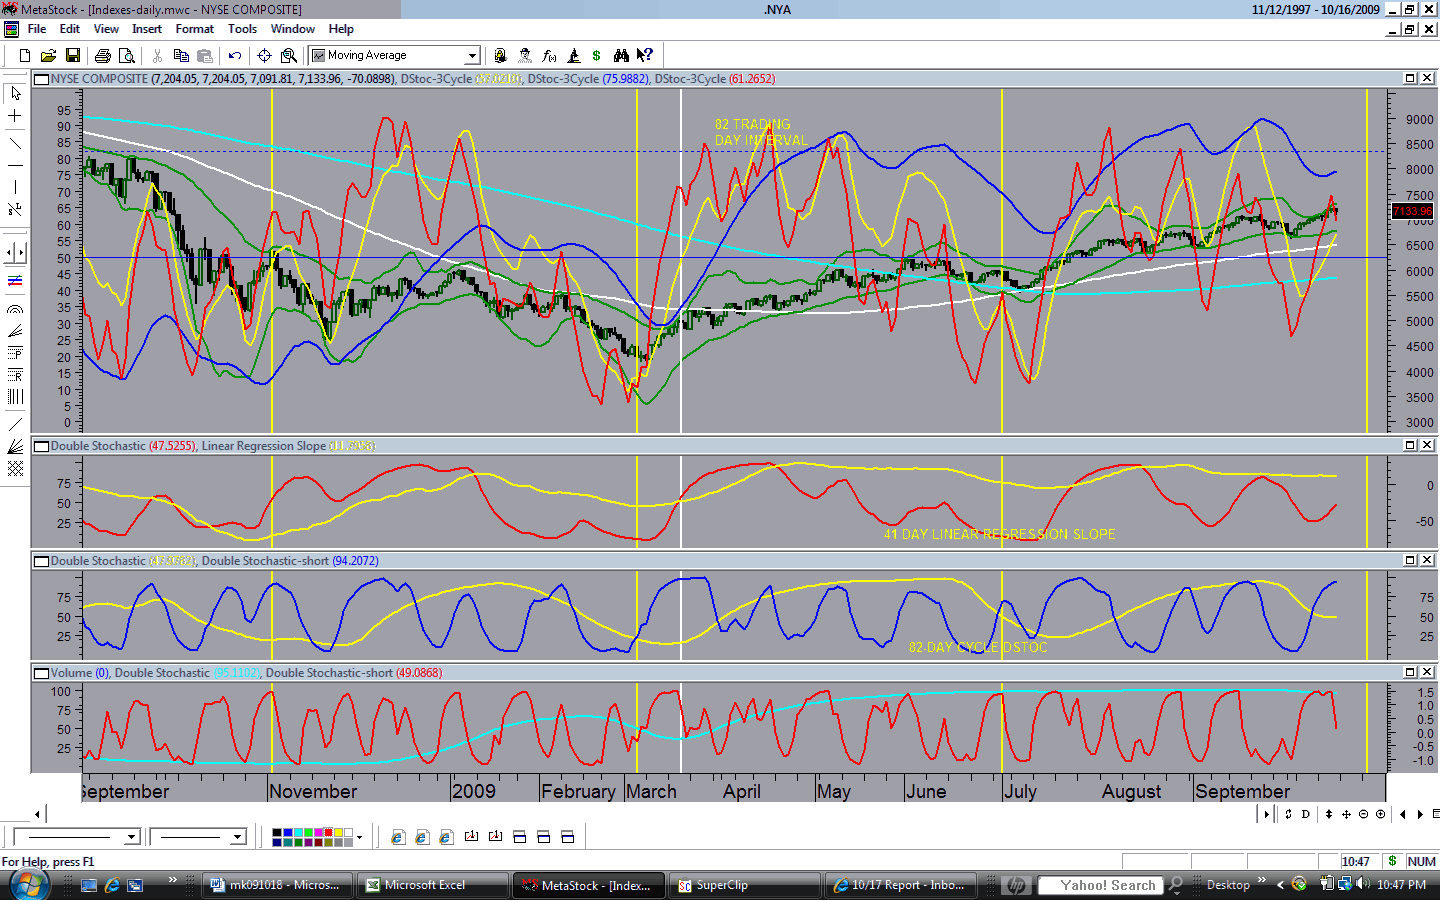
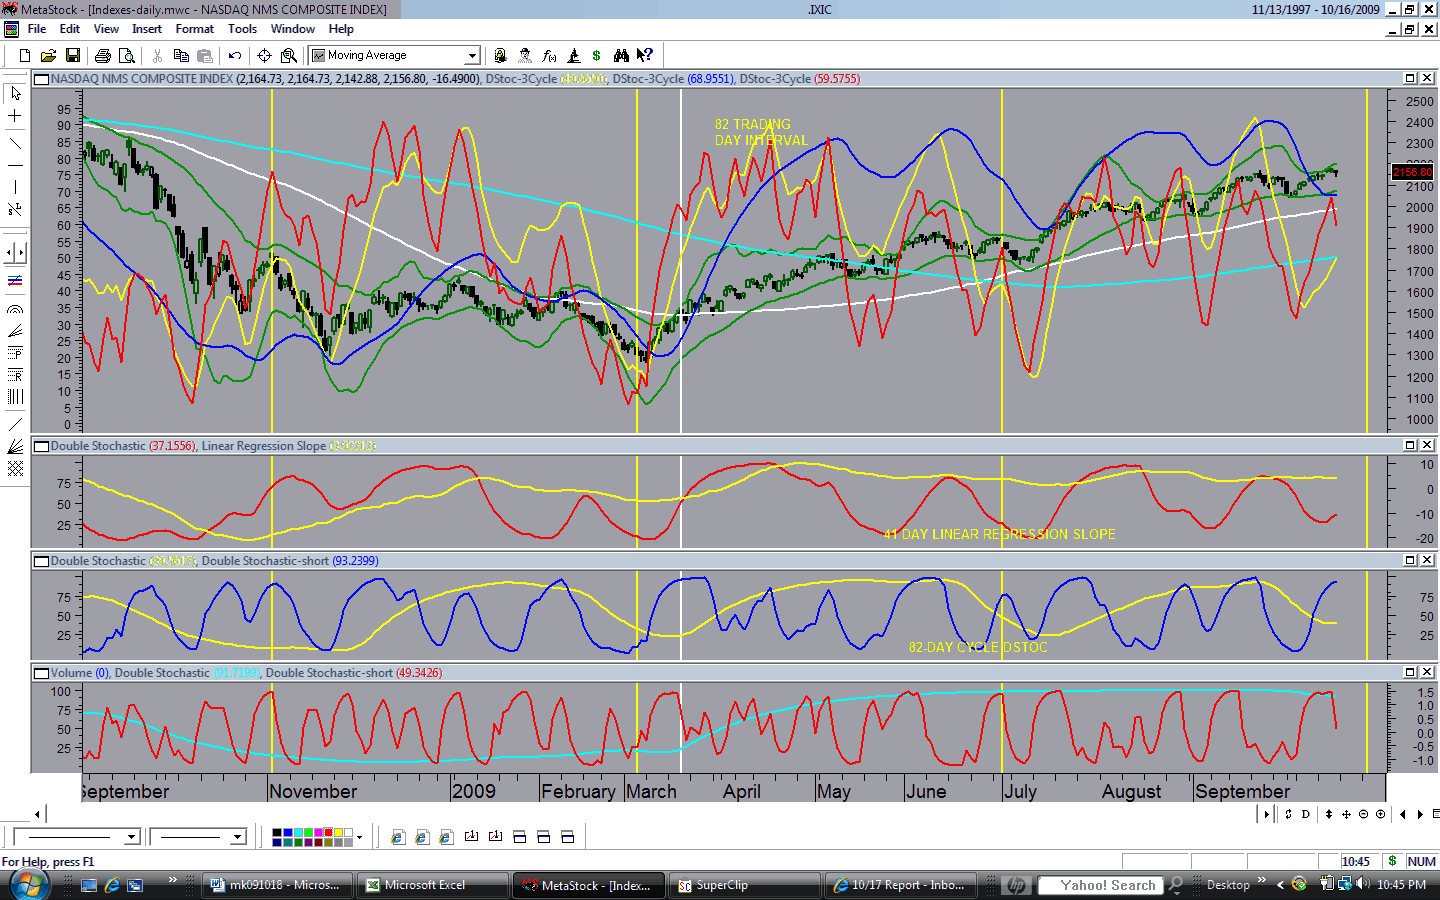
Two weeks ago I wrote regarding the May 2008 analogy: “If the analogy persists this week, stocks will remain relatively flat as the aging 13 and 26-day cycles attempt to correct their oversold conditions while the longer cycles exert downward pressure on prices.” Since then the stock indexes have had a slight upward bias, but were, for the most part (SPX (http://www.geocities.com/petegersb/SP500.GIF ), the Russell 2000 index (http://www.geocities.com/petegersb/Russell2000.GIF ), NYSE Composite (http://www.geocities.com/petegersb/NYSE.GIF)), stymied by strong resistance at the confluence of the declining 9-mo moving average, the 38% Fibonacci retracement of the decline, and the May 8 high. On the other hand, the NDX (http://www.geocities.com/petegersb/NDX.GIF ) and the NASDAQ Composite (http://www.geocities.com/petegersb/NasdaqComposite.GIF ) have penetrated all of these levels – fairly decisively except for the 38% retracement.
Now the 2008 analogy is being recognized by a growing number of market pundits. This morning, option specialist Bernie Schaeffer had the following headline on his Monday Morning Outlook: “2009 Has Been an Eerie Replay of 2008 So Far” (http://www.schaeffersresearch.com/commentary/observations.aspx?ID=93248 ). When any pattern becomes too widely recognized, the likelihood of a continuation declines. So let’s look at the status of the cycle indicators to assess the odds of it continuing.
On the NDX (http://www.geocities.com/petegersb/NDX.GIF ) and NASDAQ Composite (http://www.geocities.com/petegersb/NasdaqComposite.GIF ) all of the cycles are overbought except the 10-wk cycle, which turned up from an oversold condition just last week. The short-term composite turned up from midrange, and the intermediate composite turned up from a nearly overbought level. So, if one ignores the rising mid-range position of the DStocs on the VXN (http://www.geocities.com/petegersb/VXN.GIF ) it appears that these indexes are a week or two into the rally phase of the 2nd 10-wk cycle within the current 20-wk cycle, and a higher peak is already assured for the 10-wk cycle. Furthermore, a right translated peak in the 12-week-old 20-wk cycle appears to be a near certainty when the 10-wk cycle peaks. These are bullish indicators for the long term and suggest that the 20-wk cycle and the 6-month old 9-mo cycle will remain overbought for a few more weeks. In the short-term, however, the 26-day and 13-day cycles are overbought, and 14 trading days have elapsed since the May 8 peak. The 13-day cycle is ripe for a peak this week.
The other indexes (SPX (http://www.geocities.com/petegersb/SP500.GIF ), the Russell 2000 index (http://www.geocities.com/petegersb/Russell2000.GIF ), and the NYSE Composite (http://www.geocities.com/petegersb/NYSE.GIF)) exhibit some, but not all, of the NASDAQ characteristics. In addition to their failure to penetrate important resistance levels, the intermediate composites have not turned up and the 26-day cycle rally has reached only the middle of the range. In other respects, the patterns are similar. So near-term prospects appear marginally better, and longer term prospects appear not as positive as on the NASDAQ. The ability to penetrate overhead resistance this week depends on the outcome of a conflict between a young 10-wk cycle (again ignoring the condition of the VIX ( http://www.geocities.com/petegersb/VIX.GIF)) and the aging overbought 13-day cycle. Until a strong surge during Friday’s last half hour, it appeared that the bears would win the short-term battle. Now it appears that the bulls have the edge, and the 2008 analogy may be on the verge of collapsing.
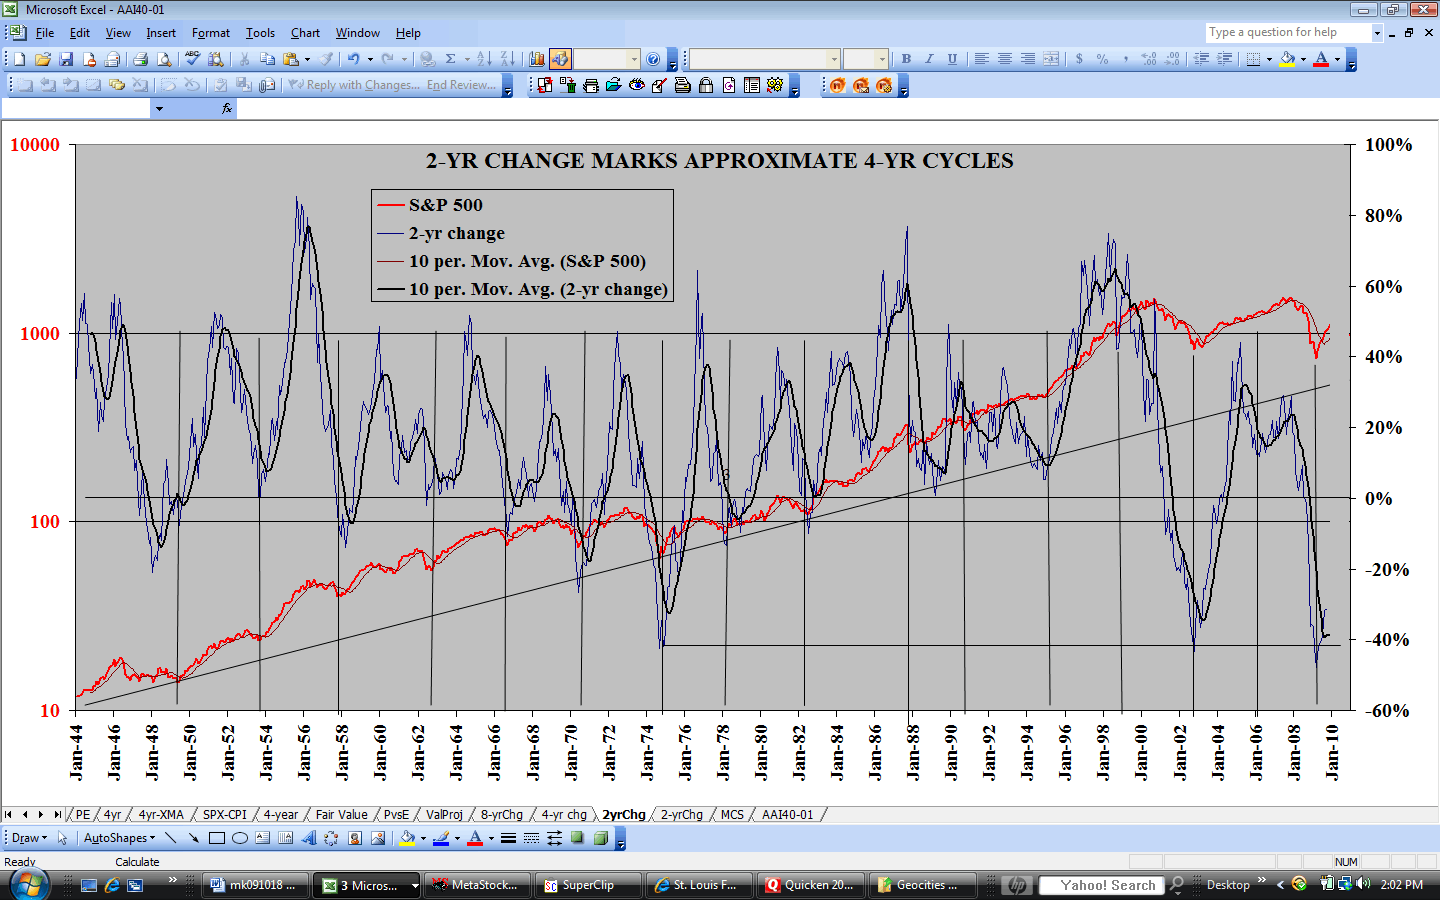
None of this changes my opinion that the indexes will have a substantial pullback soon into a summer test of the lows. It does however improve the odds that we will not see new lows. Instead, the 2002 analogy (http://www.geocities.com/petegersb/DowComp2002.GIF ) still appears likely to play out. The November low is analogous to the July 02 low. The March low is analogous to the October 02 low. The final low in March of 2003 appears likely to find a counterpart in the summer or fall of 2009 as the 4-yr cycle oscillator (http://www.geocities.com/petegersb/2-YrChange.GIF ) forms another double bottom as it did after the comparable severe declines in 1974 and 2002 (http://www.geocities.com/petegersb/Overview-long.GIF ).
The McClellan Summation Indexes (http://www.geocities.com/petegersb/A-Dsummation-NYSE.GIF , http://www.geocities.com/petegersb/A-Dsummation-OTC.GIF ), after turning down fairly decisively from the May 8 peak, turned up again almost imperceptibly on Friday. That lends credence to the expectation of a further advance before a 9-mo and 20-wk cycle top.
Sentiment (http://www.geocities.com/petegersb/SurveysCombined.GIF ) is sending mixed messages. It remains stalled at about the level one would expect if optimism is to remain confined to the declining trend channel of the last 5 years. However, the AAII survey component (http://www.geocities.com/petegersb/AAIIsentiment.GIF ) has issued a sell signal at the same level as the one in January. In contrast, the slower advisory services (http://www.geocities.com/petegersb/InvestorsIntelligence.GIF ) have prevented a sell signal by continuing to become more optimistic.
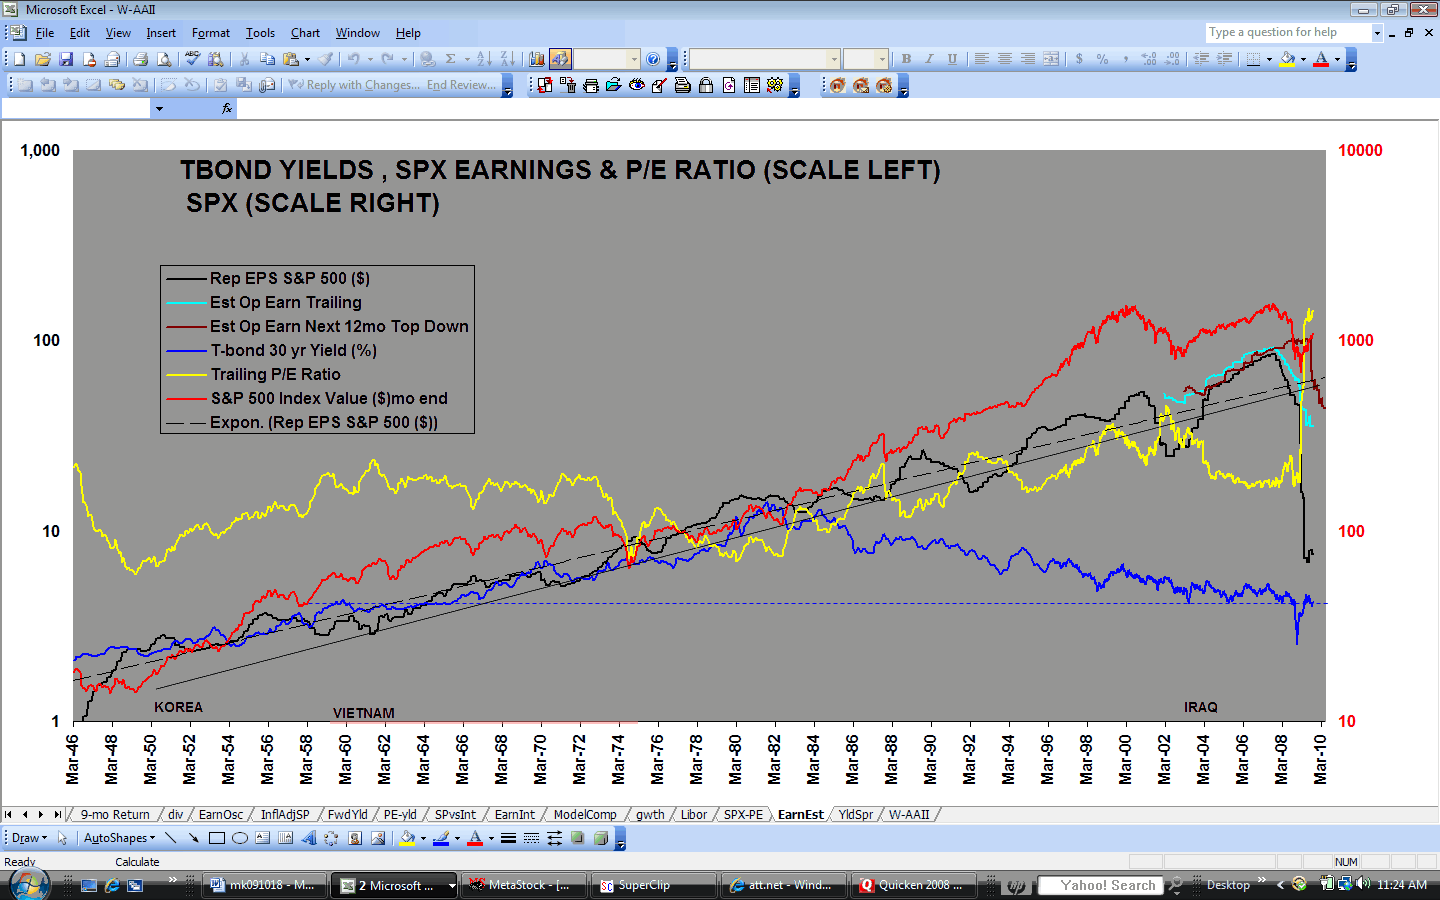
Fundamentals: Earnings expectations (http://www.geocities.com/petegersb/EarningsEstimates.GIF, http://www.geocities.com/petegersb/EarnY-Y.GIF ) are little changed from two weeks ago despite more reports of economic decline that are not quite as bad as the low recent expectations. Carl Swenlin on DecisionPoint.com gives a good rundown on the current P/E situation (http://www.decisionpoint.com/TAC/SWENLIN.html ). His last chart shows that you can make a reasonable case for stocks being fairly valued if you use the “Hussman P/E”. Hussman uses prior peak trailing GAAP earnings, and the S&P is currently at only 10.6 times the peak earnings of $86.67 in the 2nd quarter of 2007. That’s the lowest level since 1982, but not as low as during most of the time between 1930 and 1955 or the entire period from 1974 to 1982. To be an optimist on the basis of earnings, you have to believe that we are closer to a 1955 or 1982 experience than a 1930 or 1974 experience. Unfortunately, both Swenlin’s chart and the price charts bear resemblances to 1931 (http://www.geocities.com/petegersb/DowComp1931.GIF ) and 1974 (http://www.geocities.com/petegersb/DowComp1974.GIF ).
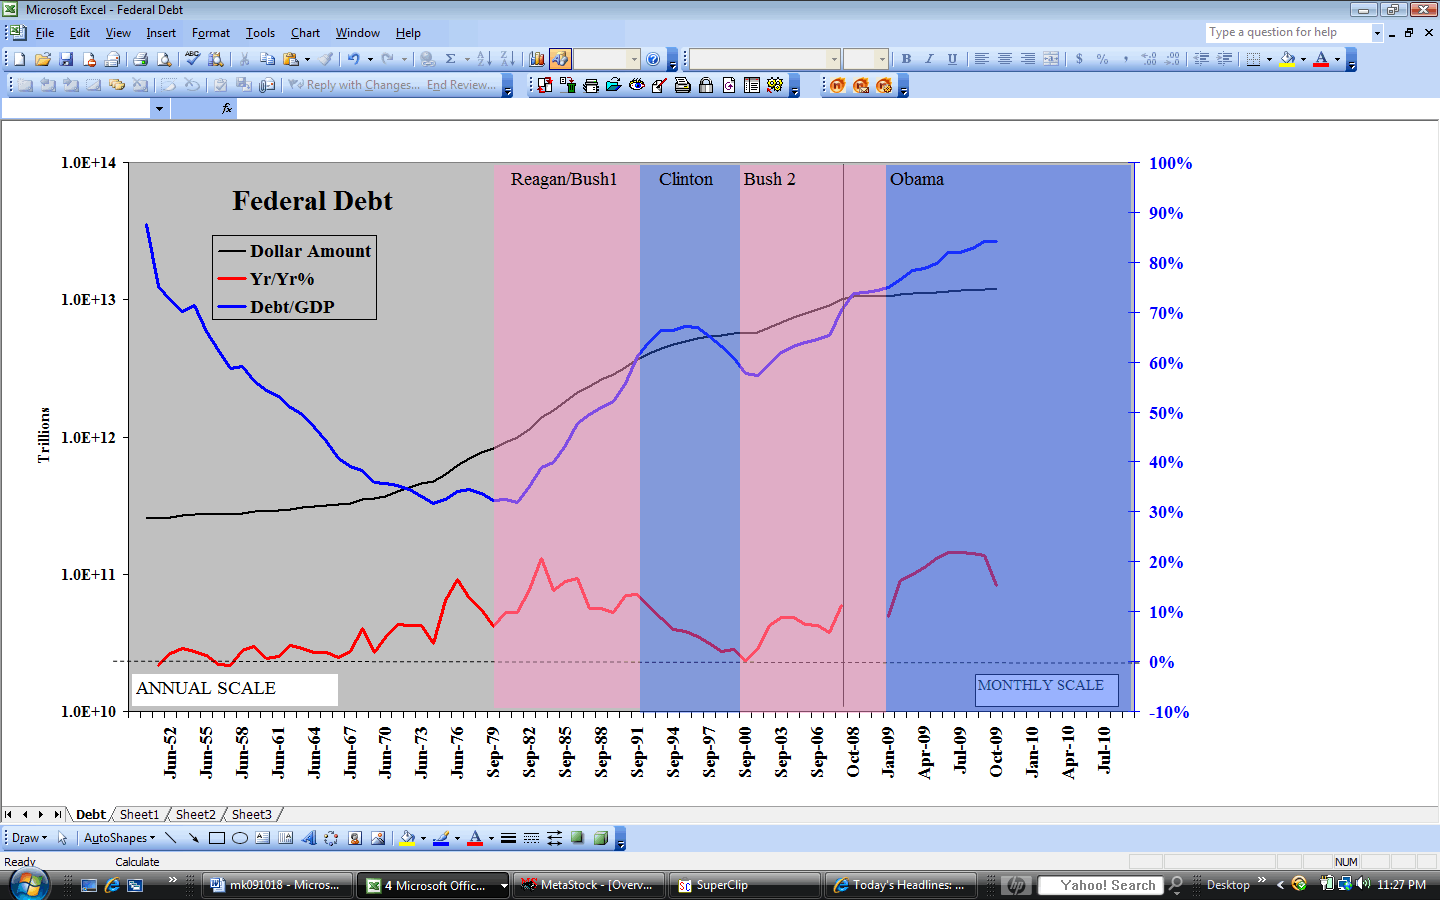
Treasury bonds (http://www.geocities.com/petegersb/Treasury-20yr.GIF ) appear to have reached a slightly premature intermediate selling climax in mid-week. They bounced strongly on Thursday and Friday from a level just above year-ago lows. Bond Sentiment (http://www.geocities.com/petegersb/BondSentiment.GIF ) is still becoming more pessimistic, which is consistent with rising interest rates, but it has now reached a level that is more pessimistic than at the point from which 10-yr Treasury rates (http://www.geocities.com/petegersb/TreasuryYield-10yr.GIF ) dropped from 4% to 2% during last year’s second half. When stocks begin to trend downward again, I expect to see a resumption of the flight to quality that will drive treasury rates lower as the cycles suggest. However, once stocks reach their final bottom the flight to quality will disappear and massive supply (http://www.geocities.com/petegersb/FederalDebt.GIF ), reduced demand and higher inflation (http://www.geocities.com/petegersb/CPI.GIF ) probably will combine to drive treasury rates higher.
Inflation Protected Treasuries (http://www.geocities.com/petegersb/TIPs.GIF) continued to outperform their unprotected counterparts (http://www.geocities.com/petegersb/CPI.GIF ). They had a very slight gain during the last two weeks as conventional treasuries plummeted. They maintained position just above the 10-wk and 9-mo moving averages and just below the downtrend line that has put a lid on all rallies during the last 15 months. It appears likely to do so again. The 13-day cycle should remain favorable early this week, but the 10-week cycle is a little overbought and the longer cycles are in downtrends that began at the beginning of April. Those cycles are scheduled to bottom in July – about when we can expect the next 10-wk cycle low - and perhaps a low in equities as well. That’s close to the time when we can expect year-over-year inflation readings to start accelerating.
Corporate bonds (http://www.geocities.com/petegersb/CorporateBonds.GIF ) also were nearly flat over the last two weeks and also maintained position slightly above the down trending 9-mo moving average and the up trending 10-wk moving average. The 13-day cycle bottomed on Thursday, but both short and intermediate composites are in downtrends that appear unlikely to end any time soon. As with stocks, the topping pattern in the 20-wk cycle appears particularly threatening.
Municipal bonds (http://www.geocities.com/petegersb/MunicipalBonds.GIF
) complete the trio of bond sectors that remained little changed as conventional
treasuries plummeted. Despite correcting overbought conditions in the short
cycles while moving sideways, Muni’s have remained above the rising 10-wk
moving average. It’s counter intuitive that they are holding up so well given
the dismal financial condition of most states and cities. But they still pay a
nice premium above taxable Treasuries, so an economic recovery should help them
as tax revenues improve and default worries abate.
Crude oil (http://www.geocities.com/petegersb/CrudeOil.GIF ) didn’t correct its overbought condition as I expected. Instead it moved above the down trending 9-mo moving average and produced overbought conditions in all of the cycles and all of the composites. Given this extreme overbought condition I’m still expecting a correction, but oil looks better for the long run than most charts. A year ago, with oil around $130 the cycles were nearly as overbought but the rally persisted for several more weeks and another $15. And, although oil has gained 104% since its low and 95% since the last of its triple bottoms in February, it has not yet retraced 38% of its prior decline as is typical even in a bear market rally. The overbought conditions may persist until it challenges that level, another $10 higher.
Natural gas (http://www.geocities.com/petegersb/NaturalGas.GIF ) is a different story, but it is now showing signs of life. It managed higher 13-day cycle highs and lows for the 1st time since last July and it’s making a serious attempt to turn the 10-wk moving average upward. The late April low was successfully tested in May. It looks like Natural Gas will make a run at the 9-month moving average, roughly 40% higher.
Energy stocks (http://www.geocities.com/petegersb/EnergySPDR.GIF) are again testing the top of their 8-month-old trading range. But for the first time since last July, they have moved marginally above the 9-month moving average. Like oil they remain well below the 38% Fibonacci retracement level. The short-term composite turned up on Friday, but the turn came at midrange and the 10-wk cycle is still trending downward. The intermediate composite is flattening at a nearly overbought level. The cycles are mimicking those of last June when the XLE was in a broad topping formation that would continue for another month. With the 9-month cycle 7.5 months old and the 20-wk cycle 12 weeks old, it looks like Energy Stocks will follow the broader market into a correction and a test of the bottom of the extended trading range.
Gold (http://www.geocities.com/petegersb/GoldBullion.GIF) did not begin the expected 10-wk cycle correction. Instead
it surged higher and is again approaching its $1000 peak. Despite a very overbought 10-wk cycle, it appears likely to reach that
level and perhaps more. The second 20-week cycle of the 7-month-old 9-mo cycle
is only 8 weeks old and far from overbought. If gold can break above its
February 20-wk cycle peak during this 20-wk cycle it will have a higher low and
a second higher high for that cycle as well as extreme right translation in the
9-mo cycle peak – a very bullish pattern for the long term. Conversely, if it
cannot breach that level, this rally will look like an unsuccessful test of a
left translated 9-mo cycle peak.
Gold Stocks (http://www.geocities.com/petegersb/GoldStocks.GIF
) were far stronger than most stocks during the last two weeks. They broke
decisively above their 2009 trading range and the 50% Fibonacci retracement
that had been acting as a lid. On Friday they went on to also break above the
62% Fibonacci retracement that impeded the advance for only a few days. That’s the good news. The bad news is that all
of the cycles except the 20-week are overbought. They should follow in the
direction of the metal, but they are considerably more volatile.
The Dollar (http://www.geocities.com/petegersb/Dollar.GIF) declined as it usually does while gold advances. It is assured of a lower 10-wk cycle low to go with its lower high. However, it made a short-term bottom a week ago when all of the cycles and composites were extremely oversold. At the time, the 10-wk cycle was 10 weeks old, the 20-wk cycle was 22 weeks old, and the 9-mo cycle was at least 10 months old, so this will probably prove to be a significant low. If so, it may inhibit the advance in gold, but they moved in tandem during January and February, so they may do so again for a period of time.
.