3/22/09
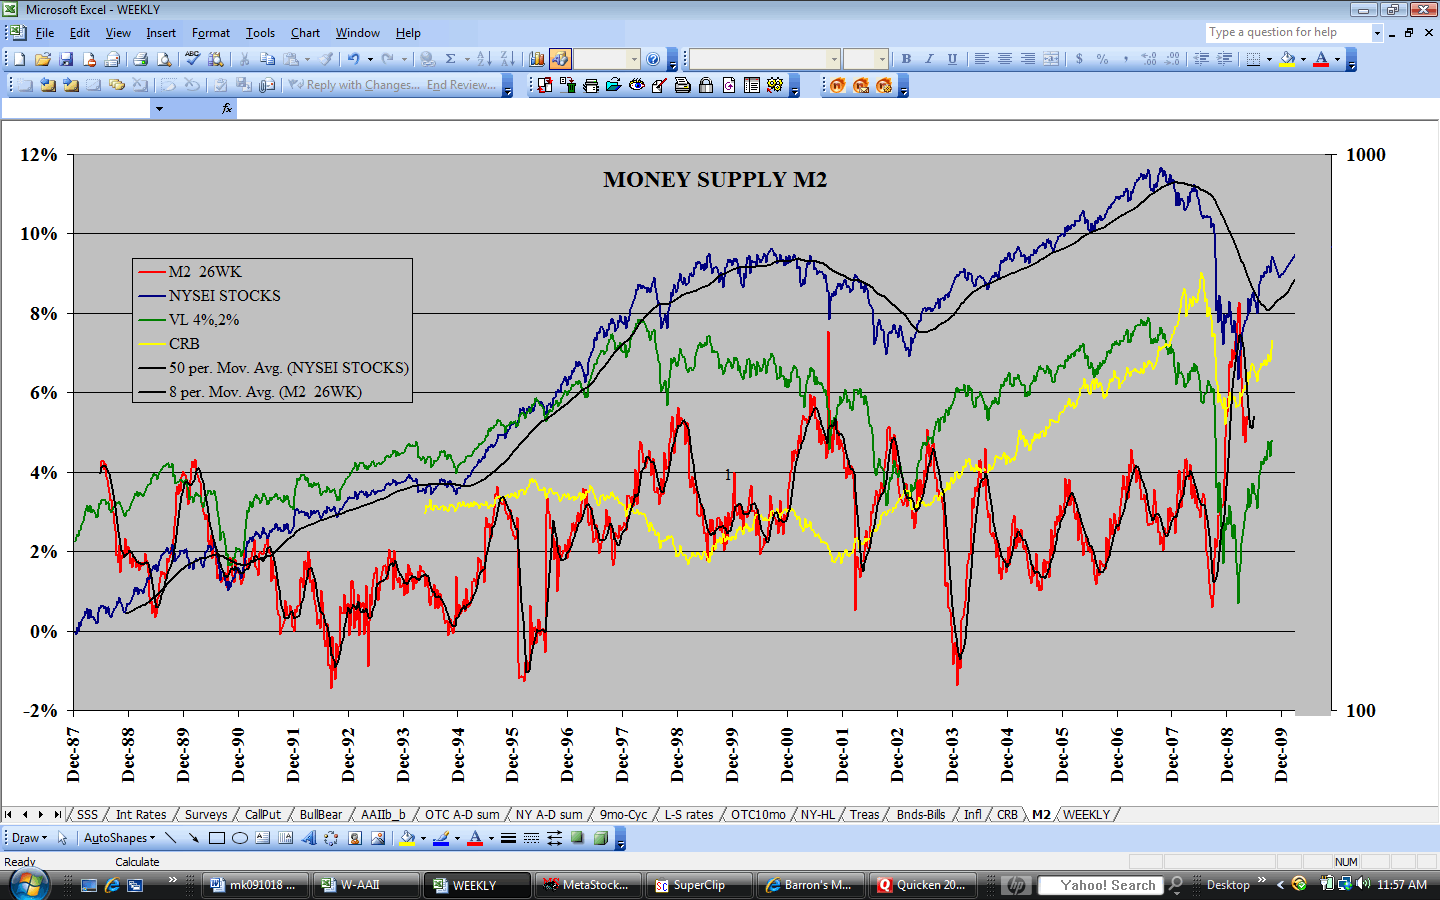
As anticipated, the short-term rally persisted during the early part of the week. Just when the 13-day cycle rally appeared to be spent on Wednesday, the Federal Reserve announced that it will be printing another trillion dollars and using it to buy mortgage-backed securities and Treasury bonds. Stocks (financials in particular) and bonds roared ahead. So did the inflation plays such as gold and inflation-protected Treasuries. Stock investors liked it because it will help the banks recover from their past indiscretions in mortgage-backed securities, thereby helping the economy to recover. Bond investors liked it because Fed buying will drive bond prices higher, while it lasts. Gold buyers liked it because the money (http://www.geocities.com/petegersb/M2.GIF ) being printed by the Fed to buy these securities will eventually find its way into the consumption economy and drive inflation higher.
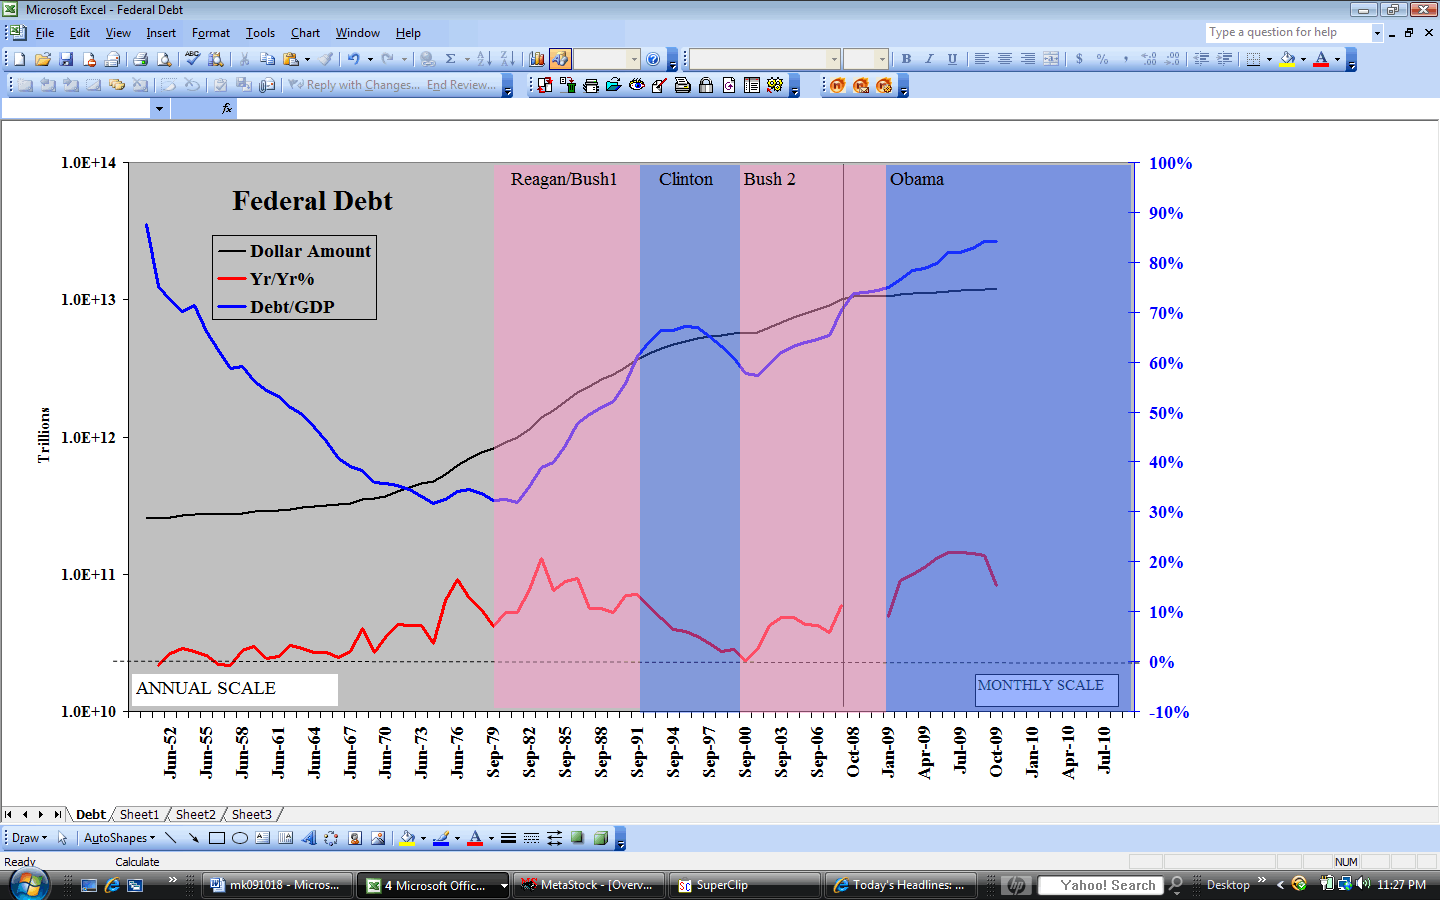
With huge unused industrial capacity and weak labor markets, the near-term inflation threat (http://www.geocities.com/petegersb/CPI.GIF ) is of little or no concern. The Fed probably applied the right medicine for current conditions. But the long-term inflation threat is huge. When the stimulus produces the intended recovery, inflation and interest rates (http://www.geocities.com/petegersb/TreasuryYield-10yr.GIF ) will soar unless the Fed reverses policy in a timely fashion. If and when it sells the securities it is now buying, it will drive interest rates higher, and higher rates will act as a drag on the economy. But without a robust recovery, the Fed will be reluctant to reverse policy. If it doesn’t, or reacts too late, inflation will soar. Historically, the Fed is late in policy reversals, so we can expect higher inflation. How much higher depends on how late the Fed responds and how quickly foreigners react to the inflation threat and take advantage of higher bond prices to lighten their exposure. If foreign selling (or reduced buying) offsets Fed buying it will reduce the stimulative effect and the inflation pressure. If future bond supply is curtailed by tax increases, some of the upward pressure on interest rates would be curtailed. Congress won’t have the courage for such unpopular action, so it’s a good bet that our children’s debt problem (http://www.geocities.com/petegersb/FederalDebt.GIF ) will be solved by high inflation. The losers will be primarily fixed income seniors and bond investors.
Stocks rallied on the news and hit the wall on day 8 of the 13-day cycle on most of the indexes. The wall turned out to be the resistance I mentioned last week at 804 on the SPX (http://www.geocities.com/petegersb/SP500.GIF). It reached 803.24. That is the level of both the 10-wk moving average and January low on the SPX. Corresponding levels produced resistance on the other indexes (NDX (http://www.geocities.com/petegersb/NDX.GIF), and Russell small cap index (http://www.geocities.com/petegersb/Russell2000.GIF )), although the NASDAQ 100 and composite moved slightly above their 10-wk moving averages. The VIX and VXN (http://www.geocities.com/petegersb/VXN.GIF , http://www.geocities.com/petegersb/VIX.GIF ) also reached the 10-wk moving average but couldn’t penetrate it significantly.
Perhaps coincidentally, stocks turned down when the news focus shifted from the latest stimulus to the congressional efforts to do something about the asymmetrical bonus system that contributed so mightily to the current economic mess. You can’t expect a financial system not to eventually collapse when it provides huge rewards for risk taking that jeopardizes our financial system, but provides no penalties for failure. The imprudent homebuyers who bought houses that they couldn’t afford are paying the penalty through foreclosure. But the loan broker who arranged the loan took no risk. Instead his commission only grew with the size of loan no matter how poor the borrower’s ability to pay. He had no concern for repayment because the loan would be packaged by Wall Street into tranched mortgage-backed securities and sold to unsuspecting investors who were misled by the rating agencies who assigned triple A ratings to much of the toxic debt. Along the way, loan brokers, securities brokers and rating agencies all collected fat fees and awarded perverse bonuses to their employees. It was a positive feedback system, which every engineer knows is inherently unstable. Easy loan terms led to higher prices and higher prices enabled more easy loans as paper equity increased. It also bore a resemblance to a Ponzi scheme that dwarfed Bernie Madoff’s. As long as buyers for homes could swing the deal and new money was coming in, everybody was fat, dumb and happy. But when workers with stagnant real wages could no move up to bigger houses or tap any more home equity to finance an unaffordable lifestyle, the merry-go-round stopped and everyone fell off.
Now that the damage has been done, perhaps the market would react better if congressmen from both sides of the aisle stopped abusing a man who came out of retirement at a dollar a year to try (however politically ineptly) to help AIG out the mess it created, and focused instead on reestablishing an obviously needed regulation system that has been dismantled over the last 28 years since Reaganomics came into vogue. If the government had treated AIG’s contractual obligations to its highly paid executives in the same manner that it treated the auto companies’ contractual obligations to their assembly-line workers, the public’s outrage would not now be distracting Congress from the task at hand – righting the ship rather than worrying about a perverse one tenth of a percent of the bailout funds.
The short-term pullback should persist during the early part of this week, but it should be relatively shallow because the 10-wk and 20-wk cycles remain in young uptrends (http://www.geocities.com/petegersb/Overview-long.GIF ). If the pattern of last July/August persists, as the cycle indicators suggest (http://www.geocities.com/petegersb/SP500.GIF), the rally will continue gradually for a couple more weeks into a left translated peak for the 10 and 20-wk cycles. The next earnings reporting season will likely initiate the next downtrend in these cycles. Year-over-year comparisons will not be pretty even if S&P’s estimates (http://www.geocities.com/petegersb/EarnY-Y.GIF ) are not once again too optimistic. If they are too optimistic, the 2nd quarter crash could be dramatic.
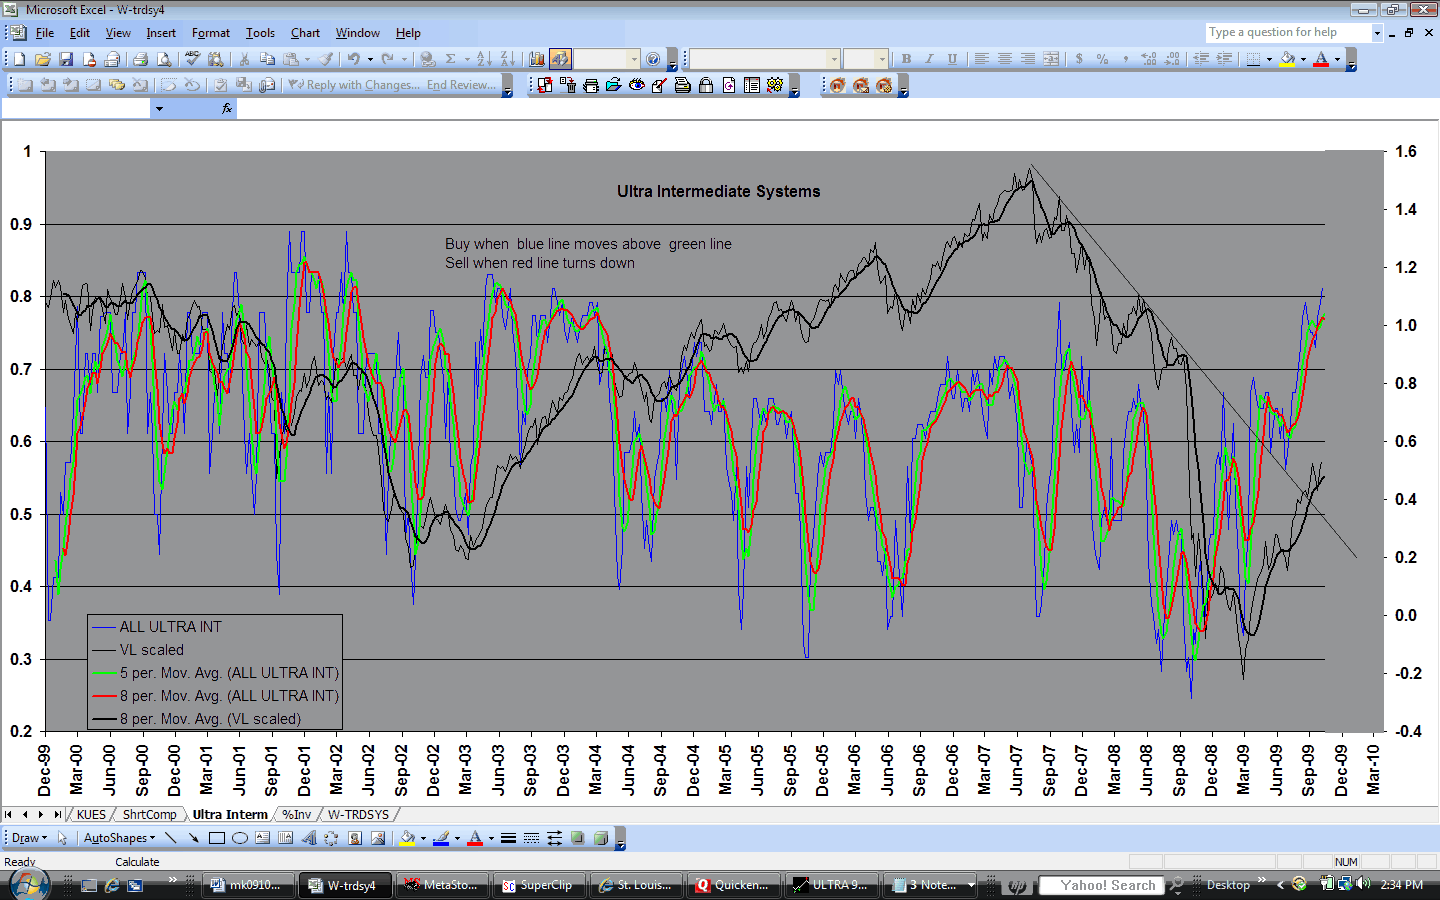
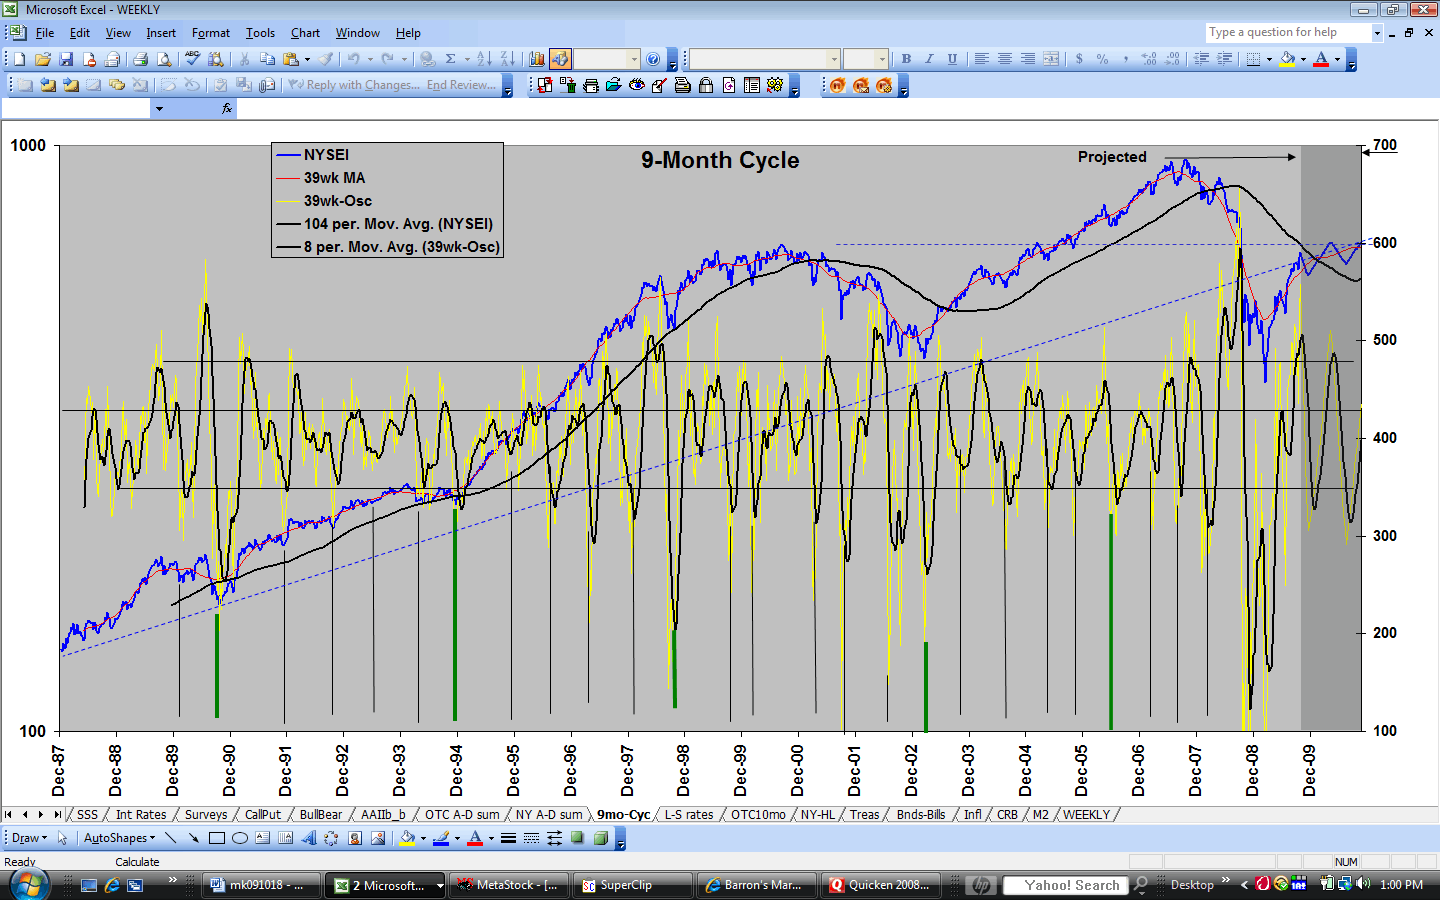
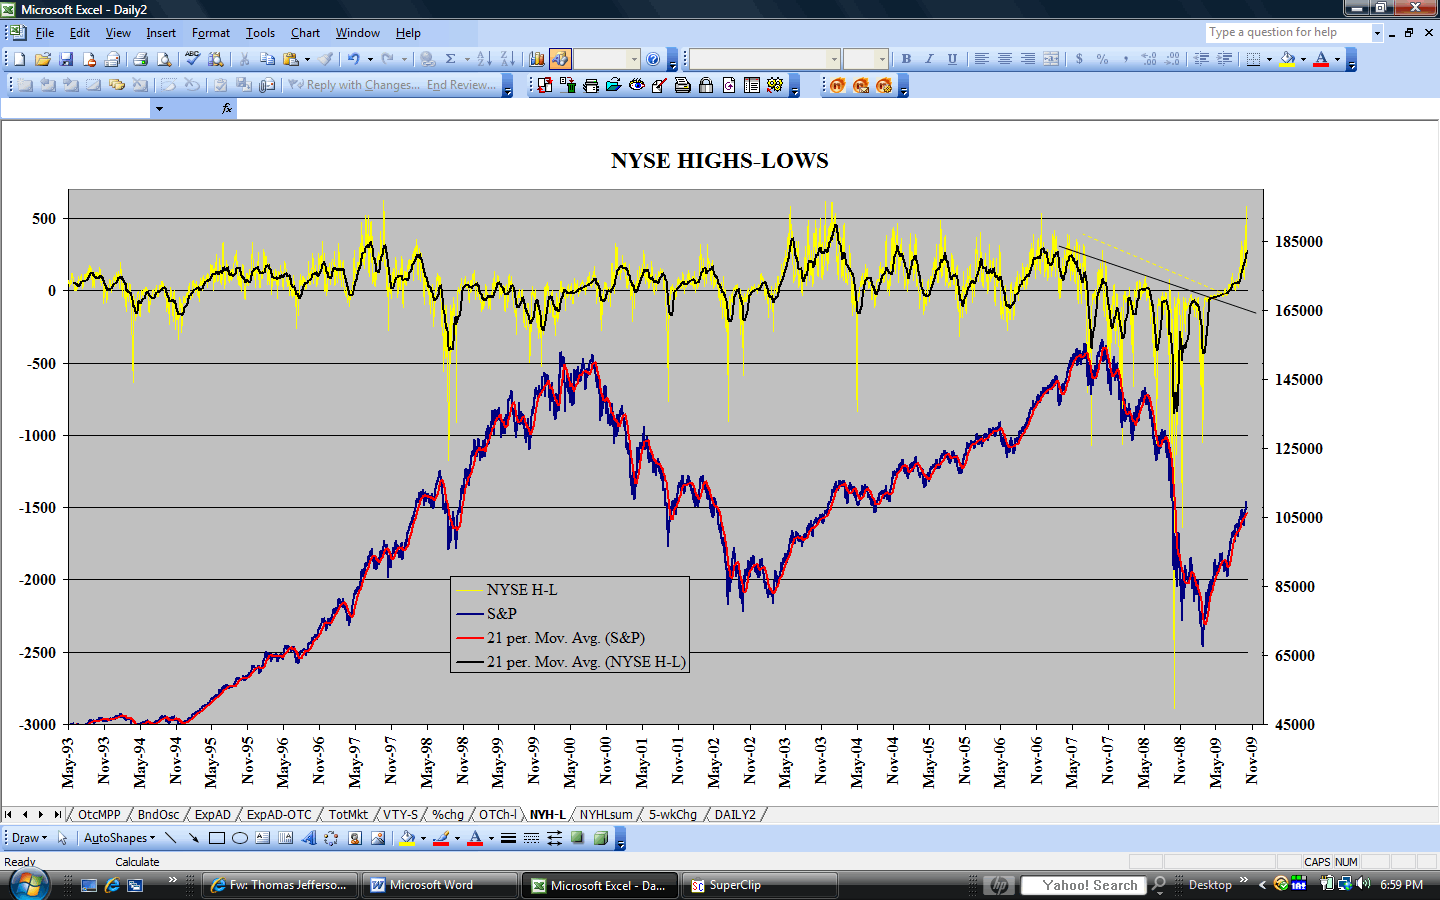
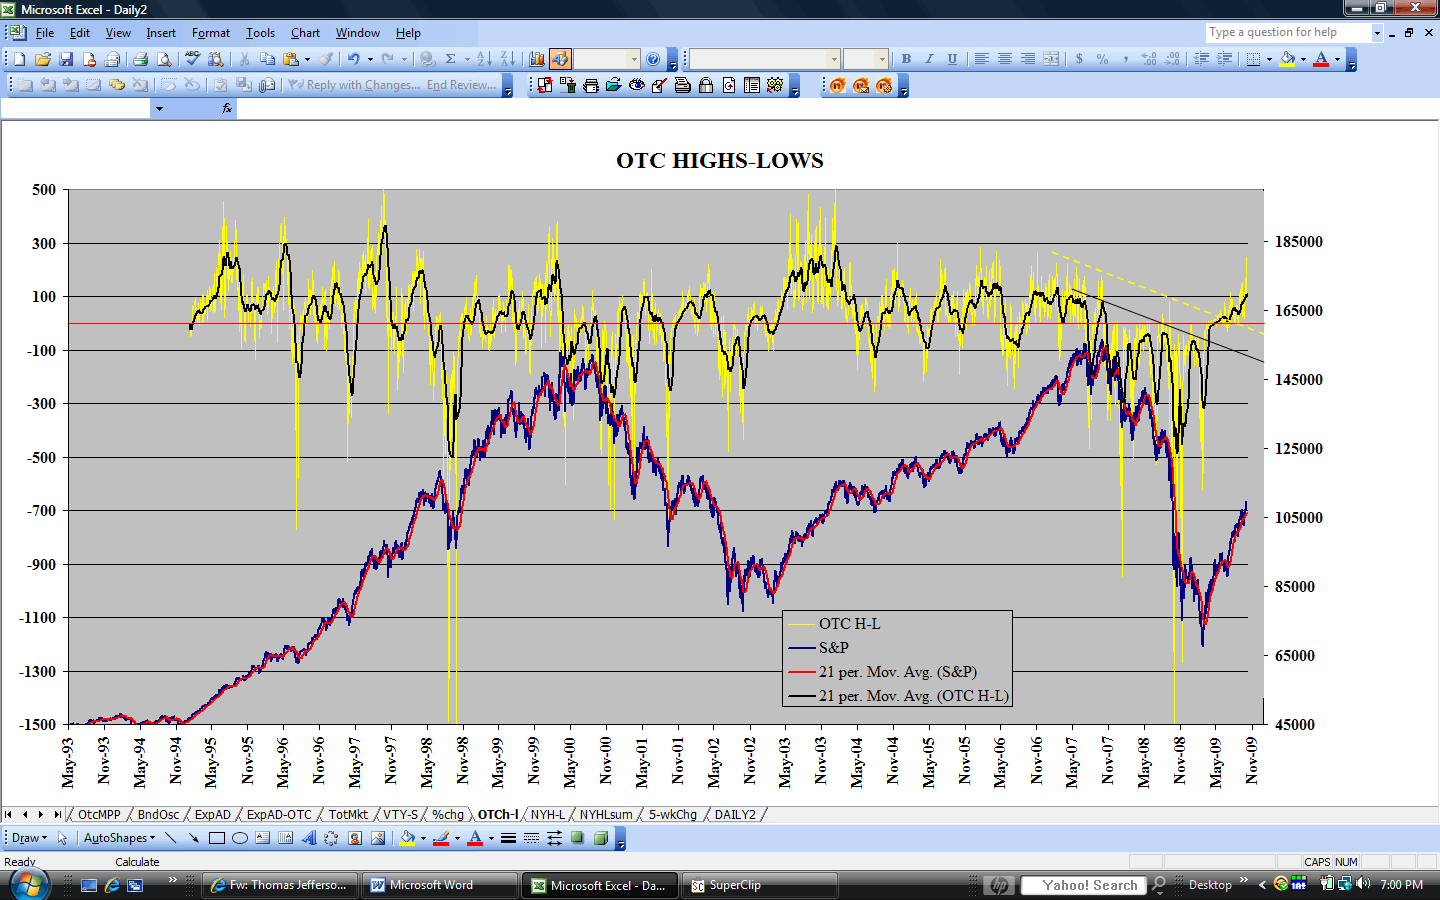
The 9-month cycle (http://www.geocities.com/petegersb/UltraIntermediate.GIF, http://www.geocities.com/petegersb/9moNYA.GIF ), now about 4 months old, remains in a downtrend from an apparent left-translated peak. The breadth indicators that mark 9-month cycle turns (http://www.geocities.com/petegersb/A-Dsummation-NYSE.GIF , http://www.geocities.com/petegersb/A-Dsummation-OTC.GIF http://www.geocities.com/petegersb/HighLowNYSE.GIF , http://www.geocities.com/petegersb/HighLowOTC.GIF ) frequently turn up prematurely due to the midpoint upturn of 20-wk cycle. That is happening now.
Sentiment (http://www.geocities.com/petegersb/SurveysCombined.GIF ) became less negative in the latest report, but not enough to reverse the downtrend. I expect true despair sometime this summer.
Treasury bonds (http://www.geocities.com/petegersb/Treasury-20yr.GIF ) leaped above the 10-wk moving average and 50% retracement on the Fed’s buyback news, but quickly pulled back below those levels. The short-term composite remains in an uptrend, but the ages of its component cycles suggest it will turn down this week. Another test of the 9-mo moving average appears likely before the longer cycles reach bottom, Fed buying notwithstanding.
Inflation Protected Treasuries (http://www.geocities.com/petegersb/TIPs.GIF) were the stars of the bond sector last week. They surged above the 9-mo moving average on the Fed announcement and held above it on Friday’s weak bond market. The inflation indexes released earlier in the week (http://www.geocities.com/petegersb/CPI.GIF ) remained benign but TIPs are now predicting higher inflation to come. Higher inflation doesn’t make TIPs a good buy at these levels – just a better buy than conventional treasuries.
Corporate bonds (http://www.geocities.com/petegersb/CorporateBonds.GIF) spiked as well, but turned down quickly at the 10-wk moving average. As with common stocks, the rising 10 and 20-wk cycles should be supportive a little longer, but the down trend in the 9-mo cycle likely will persist for about another 4 months.
Municipal bonds (http://www.geocities.com/petegersb/MunicipalBonds.GIF ) also rallied to the 10-wk moving average, turning the short-term composite upward in the process and threatening to turn the intermediate composite upward as well. This is probably the beginning of a 20 –wk cycle rally.
Crude oil (http://www.geocities.com/petegersb/CrudeOil.GIF ) continued its intermediate advance without the anticipated short-term correction. It slightly penetrated the top of the 4-month trading range with all cycles overbought except the 9-month. It’s ripe for at least a short-term correction.
Natural gas (http://www.geocities.com/petegersb/NaturalGas.GIF ) finally showed signs of life last week. After closing at another new low on Wednesday, it spurted 15% to test the 10-wk moving average. With all of the short cycles very young and none overbought, it looks like Natural Gas has a good shot at moving above the 10-wk moving average that has stymied every rally attempt since last summer. If it succeeds it’s probably the beginning of a 9-mo cycle rally.
Energy stocks (http://www.geocities.com/petegersb/EnergySPDR.GIF) also rallied last week despite a big pullback on Friday from the 10-wk moving average. The correction appears to be of the 13-day cycle variety. The rally was good enough to turn the intermediate composite upward. It’ll take another 15% to reach the top of the 6-month trading range. If it breaks above that range, the basing period may be at an end.
Gold (http://www.geocities.com/petegersb/GoldBullion.GIF) had a huge turnaround on the Fed announcement, moving
from another test of the 38% Fibonacci retracement to a large gain. Given the
potential for further dollar debasement and eventual inflation, the reaction
was entirely rational. The upturn began 20 weeks after the October low with the
20-wk cycle DStoc slightly oversold. It’s probably the beginning of the 2nd
20-wk cycle rally within the current 9-mo cycle.
Gold Stocks (http://www.geocities.com/petegersb/GoldStocks.GIF
) also rallied strongly on the Fed news, moving above both 10-week and 9-mo
moving averages for the first time since last summer. Despite an overbought
13-day cycle, the XAU has a good shot at moving above resistance at the 50%
retracement level this week and moving significantly higher during this 20-wk
cycle rally.
The dollar (http://www.geocities.com/petegersb/Dollar.GIF) continued lower as expected, producing the worst 2-wk period since December. During those two weeks it retraced 62% of the advance since the December low. Such a deep correction is suggestive of a possible trend change, but the dollar is likely to find short-term support above the rising 9-mo moving average. If so the bull pattern of higher intermediate highs and lows will remain intact. If not, the December lows will become the next test. If that fails, the dollar’s 8-month bull market is finished.