3/1/09
A month ago, I concluded that February promised to be the best opportunity of the first half for buyers to make money in stocks. If that proves to be true, it will be a dismal first half indeed. Not only did stocks fail to breach the low bar set at the early January peak that seemed so close when I wrote my last letter, but February ended with a test of the November lows despite a 9-month cycle that is only 3 months old. Such a collapse so early in the cycle is ominous for the remainder of the cycle – nominally another 6 months.
My optimism for February was based on indicators that suggested it would encompass the rising phase of the 10-week cycle. Perhaps it did (the 10-wk cycle indicators (http://www.geocities.com/petegersb/VXN.GIF , http://www.geocities.com/petegersb/VIX.GIF ) are unclear), but clearly the powerful downtrends in the longer cycles dominated. Once again the market demonstrated the wisdom of avoiding bets on short cycles in opposition to the longer cycles. It will be important to remember that rule during the remaining year or two of the down trending 4-year cycle (http://www.geocities.com/petegersb/2-YrChange.GIF , http://www.geocities.com/petegersb/4YearCycle.GIF ), and the remaining 3-9 months of the down trending 9-month cycle (http://www.geocities.com/petegersb/UltraIntermediate.GIF , http://www.geocities.com/petegersb/Overview-long.GIF , http://www.geocities.com/petegersb/Overview-med.GIF http://www.geocities.com/petegersb/A-Dsummation-NYSE.GIF , http://www.geocities.com/petegersb/A-Dsummation-OTC.GIF http://www.geocities.com/petegersb/HighLowNYSE.GIF , http://www.geocities.com/petegersb/HighLowOTC.GIF ).
The shorter cycles suggest that the current test of the November lows will not hold. Although both the 20 and 10-week cycles are oversold, they are not yet due for a rally. All on the indicators (SPX (http://www.geocities.com/petegersb/SP500.GIF), NDX (http://www.geocities.com/petegersb/NDX.GIF), Russell small cap index (http://www.geocities.com/petegersb/Russell2000.GIF )) suggest that the 20-week cycle is now 14 weeks old and marginally mature enough for a bottom, but most 10-week cycle indicators suggest that it is only 5-weeks old and therefore likely to continue declining. The 26-day cycle is either 27 days old or 4 days. Either way it’s deeply oversold. If it’s 4 days old, the rally phase may have lasted a single day, and the short-term outlook is grim. If it’s 27 days old, a short-term rally would be likely very soon. Unfortunately, the 13-day cycle looks like it is 4 days old and has already completed a very brief one-day rally phase on Wednesday. In that case, a short-term rally would be unlikely this week. Excluding the energy sector (http://www.geocities.com/petegersb/SPY-XLE.GIF ), stocks also look poised for another down week or two.
Obama rolled out his $3.938 trillion budget for 2009 and
Wall Street did not react well. But Wall Street’s initial knee jerk reactions
to changes in the administration are usually wrong. You may recall when
Obama’s budget is expected to produce a $1.75 trillion deficit, somewhat higher than the $1.417 trillion that Bush added to the federal debt during his last 12 months in office and approaching the $2.3 trillion recently allocated to bailouts of banks, Wall Street brokers, insurance companies, automakers, and mortgagees. Suddenly the hypocrites who supported Bush in nearly doubling the Federal debt to nearly $10.6 trillion during his two terms and supported Paulson’s Wall Street bailouts with little debate have become concerned about passing a large debt on to our children. That’s a legitimate concern that I have trumpeting for years, but where were these people during the last 8 years. The time to fix the problem was when the economy was growing, not when depression threatens.
Let’s look at the debt record (http://www.geocities.com/petegersb/FederalDebt.GIF
). Note that federal debt grew more slowly than GDP during the post WWII era
until 1974, about the time that federal debt starting increasing at double
digit percentage rates. The Kennedy tax cuts were widely credited for the
earlier favorable period, perhaps legitimately so because the tax system, with
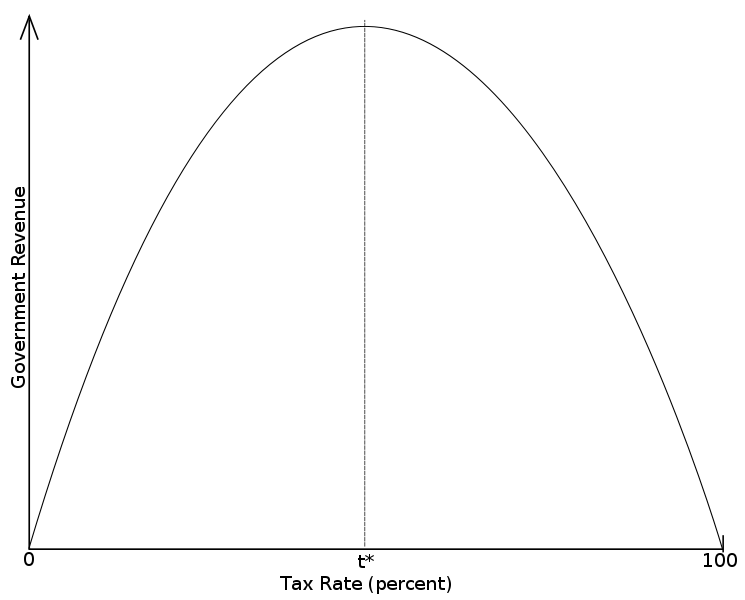
the top rate at 90%, was previously operating at the confiscatory right side of
the Laffer curve (http://www.geocities.com/petegersb/LafferCurve.png
) – an area where rate cuts logically produce revenue increases. Despite continued
double digit annual debt increases after 1974, the debt held at a little above
30% of GDP until 1981. That’s when Reagan decided he could replicate the
Kennedy tax cut effect, but he and Arthur Laffer
failed to recognize that the tax system was already operating on the left side
of Laffer curve where tax rate cuts produce declining
revenues (Laffer never put a scale on his chart, so it’s
not surprising that Reagan was confused). Contrary to their expectations, federal debt
continued to grow at double digit percentage rates throughout the Reagan and
Bush1 era, but the economy did not keep pace. By the time
So in light of this history, what should we make of the
coming Obama deficit? Experience suggests
that he has been too accommodating of Republicans by allocating too much of the
stimulus to tax cuts, but at least his cuts are likely to be more stimulative
than Bush’s because they are focused on those who are likely to spend most of
their added take home pay. The argument that I supported in good times that we
need to save more and deficit-spend less is legitimate for the long run, but in
the short term it aggravates the economic downtrend - not helpful at a time when 28% of our
productive capacity is idle and unemployment is accelerating into double digit
percentages. We do not now have a supply side problem. We are capable of
producing enough goods and services for everyone to live well. But wealth has
become so heavily skewed that we now have a demand side problem. When I was
young the average worker earned 1/40th as much as the average CEO, and a single
earner family could live reasonably well on those earnings. Now the average
worker earns about 1/400th as much as the average CEO and even two
earner families have been sinking deeper into debt in an attempt to maintain a
more lavish lifestyle than their more frugal parents. When Reagan was elected
in 1980, the top 1% had 8% of
Even most conservative economists acknowledge that we currently need to stimulate consumption, and it’s generally recognized that spending is much more effective in stimulating demand and creating jobs than are tax cuts. So massive deficit spending by the government to replace spending by workers who no longer can borrow enough to maintain their excessive spending levels probably is the right policy. We can all find items in the budget we wish had not been included, but that’s the price of getting a budget passed in our system of government by lobbyists, corrupt legislators and doctrinaire minority parties that can stymie any action with filibusters. I don’t know how soon the proposed stimulus will resurrect our economy, or even if it will, but I haven’t heard any better ideas. I certainly wouldn’t want to put my faith in the vocal minority who are calling for nothing but tax cuts despite the compelling evidence that they don’t work very well at current levels of taxation.
I am reasonably confident that if the stimulus works, we can expect higher inflation, perhaps much higher. But the bond market is not yet predicting high inflation. That’s to be expected because it tends to lead the CPI (http://www.geocities.com/petegersb/CPI.GIF ) by only a month or two. The stock market tends to lead the economy by roughly a half year, and I do not expect stocks to hit bottom until 2010. Consider that no president in post WWII history has avoided a 4-year cycle low in stocks during his first two years in office (http://www.geocities.com/petegersb/PoliticalRecord.GIF ), and only one (Eisenhower) produced it in less than a year. Given that Obama has inherited the worst economic trajectory of any of these presidents, there should be no illusions that he can produce the low more quickly than the others. Consequently, I suspect we will not see an economic recovery and the attendant inflation until 2011. While we wait we can take comfort that some of the more egregious inequities in our tax code are being rectified. Hedge fund managers earning millions will no longer pay income taxes at a 15% rate while those of us earning thousands pay twice that rate. Similarly, the wealthy will no longer get the taxpayer to subsidize 35% of their mortgage interest while the middle class gets a 28% subsidy, the poor get a 15% subsidy and the non-itemizers get nothing at all.
Earnings (http://www.geocities.com/petegersb/EarnY-Y.GIF
): Standard & Poor’s has revised its
earnings estimates for 2009 downward again to $48.15 for operating earnings and
$32.41 for reported earnings. That puts the P/E on expected 2009 earnings at 15.3
for operating earnings or 22.7 for reported earnings – neither bargain levels. However,
in the unlikely event that S&P is on target, 12 month trailing earnings
would dip to $42.04 for operating and $12.01 for reported in the third quarter.
So at about time when the 9-month cycle should bottom, we would be looking
backward at P/E’s of 17.5 and 61.2 respectively. If the market is going to
advance before that, it will have to bet on a much more distant future.
Treasury bonds (http://www.geocities.com/petegersb/Treasury-20yr.GIF ) challenged the February low on Friday and are poised for a fresh 3 month low this week. Both short and intermediate composites are in downtrends, and neither is oversold.
Inflation Protected Treasuries (http://www.geocities.com/petegersb/TIPs.GIF) are similarly in short and intermediate declines, but appear closer to a short-term bottom than conventional treasuries.
Corporate bonds (http://www.geocities.com/petegersb/CorporateBonds.GIF) plunged to a very short-term oversold condition. The intermediate composite is halfway down the usual range and 4 ½ months into the 9-month cycle. Corporate bonds are getting a lot of favorable press these days, but the cycles suggest that you don’t want to hold them during the next few months. If you hold them, use the expected short term rally to exit.
Municipal bonds (http://www.geocities.com/petegersb/MunicipalBonds.GIF ) are also in short and intermediate declines with the likelihood of a short-term bounce soon.
Crude oil (http://www.geocities.com/petegersb/CrudeOil.GIF ) moved fairly decisively above the 10-wk moving average last week, but remained within the 3-month trading range. The overbought 13-day cycle suggests a minor correction this week, but both short and intermediate composites are in uptrends that don’t appear threatened.
Natural gas (http://www.geocities.com/petegersb/NaturalGas.GIF ) remains near multi-year lows despite a weak rally last week that managed to turn both short and intermediate composites upward. The rally will probably meet resistance at the 10-wk moving average. I had hoped that Obama’s stimulus would have put some significant money into infrastructure to convert more of our energy consumption away from oil and into natural gas, but no such action yet. Perhaps in the next stimulus bill will incorporate such a compelling energy policy.
Energy stocks (http://www.geocities.com/petegersb/EnergySPDR.GIF) remained at the bottom of their 5 month trading range despite some life in the underlying commodities. However, the short-term composite turned up, so a trip back to the top of the range is not out of the question in the near term. The down trending 20-wk cycle is likely to put a damper on the short-term rally.
Gold (http://www.geocities.com/petegersb/GoldBullion.GIF) turned down just shy of the year-ago peak at $1000. The
13-day cycle is oversold and may have turned up on Friday, but both
intermediate and short-term composites are now in week-old downtrends that
should persist for a few more weeks in the short-term and a few more months for
the intermediate term.
Gold Stocks (http://www.geocities.com/petegersb/GoldStocks.GIF
) are in a similar cyclic situation. But, unlike the metal, they peaked at the
9-month moving average and are on the verge of dropping below the 10-wk moving
average.
The dollar (http://www.geocities.com/petegersb/Dollar.GIF) and oil seem to have about the only charts with rising short and intermediate composites – an unlikely combination. The dollar’s intraday high on Friday matched its November high. The overbought 20-week cycle is suggestive of a possible peak in that cycle to match the one established 14 weeks ago. At an age of nearly 11 weeks for this intermediate rally, it could well be forming a peak, but the shorter cycles suggest the potential for an upside breakout first.