1/18/09
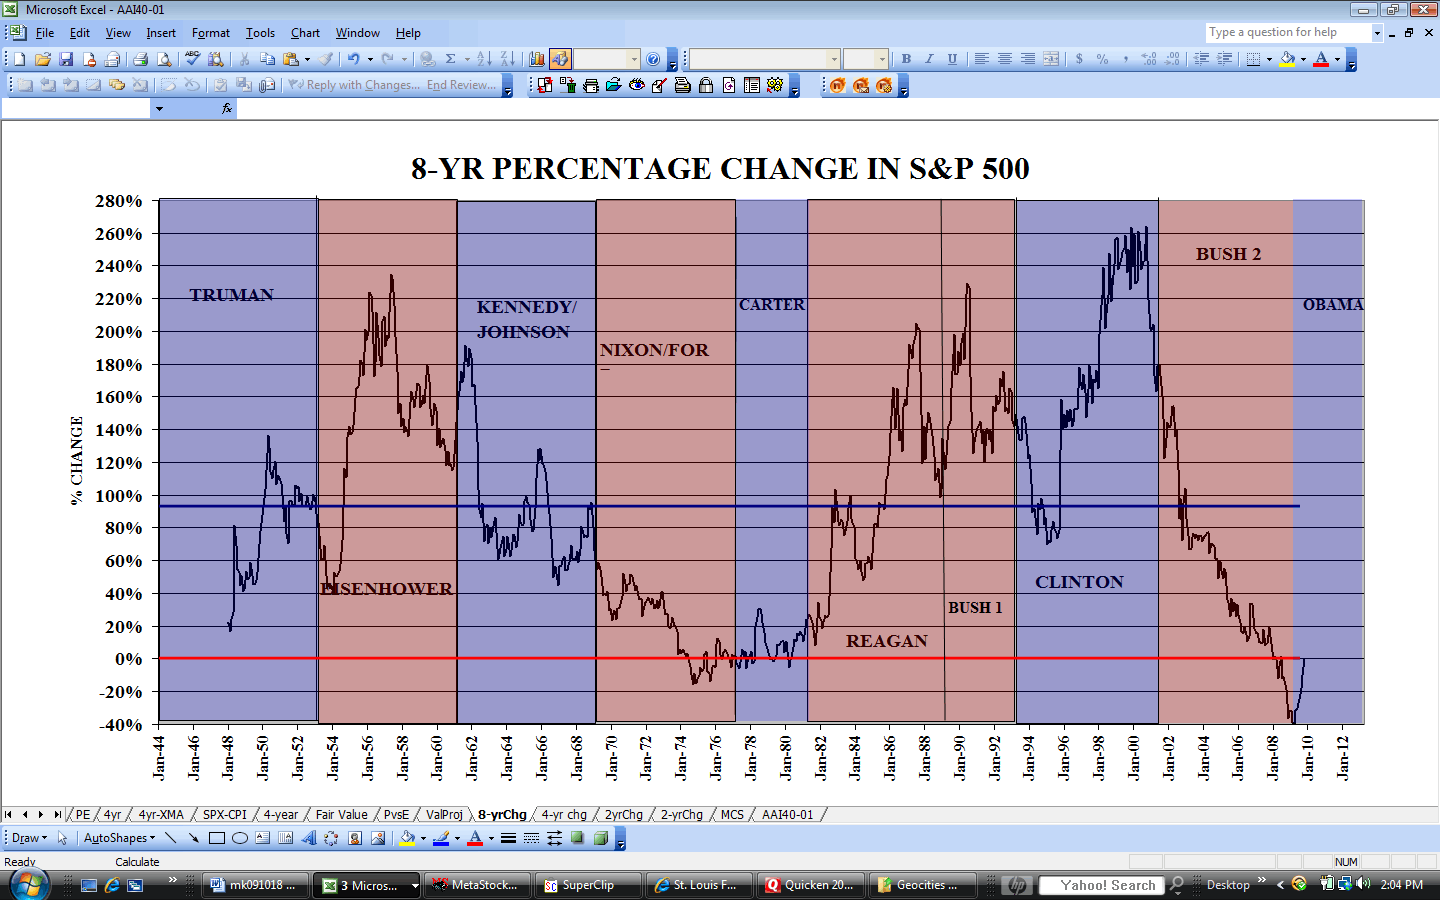
Tuesday will conclude the worst 8-year stretch for
It’s obviously true that Bush isn’t solely responsible for the mess we are in. Bankers and brokers who lent money to those with little prospect of paying it back, then created derivative financial products that they could sell to naïve investors, and who simultaneously leveraged their own balance sheets to extremely risky levels bear a large part of the blame. So do the consumers who persisted in spending beyond their means, whether for houses, SUV’s or for Chinese imports. But Bush’s philosophically driven failure to regulate the excesses of the financial industry allowed the debt bubble to expand. His fixation on tax cuts set a terrible example for deficit spending that was embraced by the consumer, and so did his rhetoric that urged consumers to go to the mall and spend after 9/11. In this week’s maudlin farewell interviews he claimed he deserves credit for making the tough decisions, but he didn’t. Taking away the punch bowl when the party was getting out of hand would have been the tough and unpopular decision; pouring in more whisky was easy. Everybody loved it while the party lasted – not so much during the hangover.
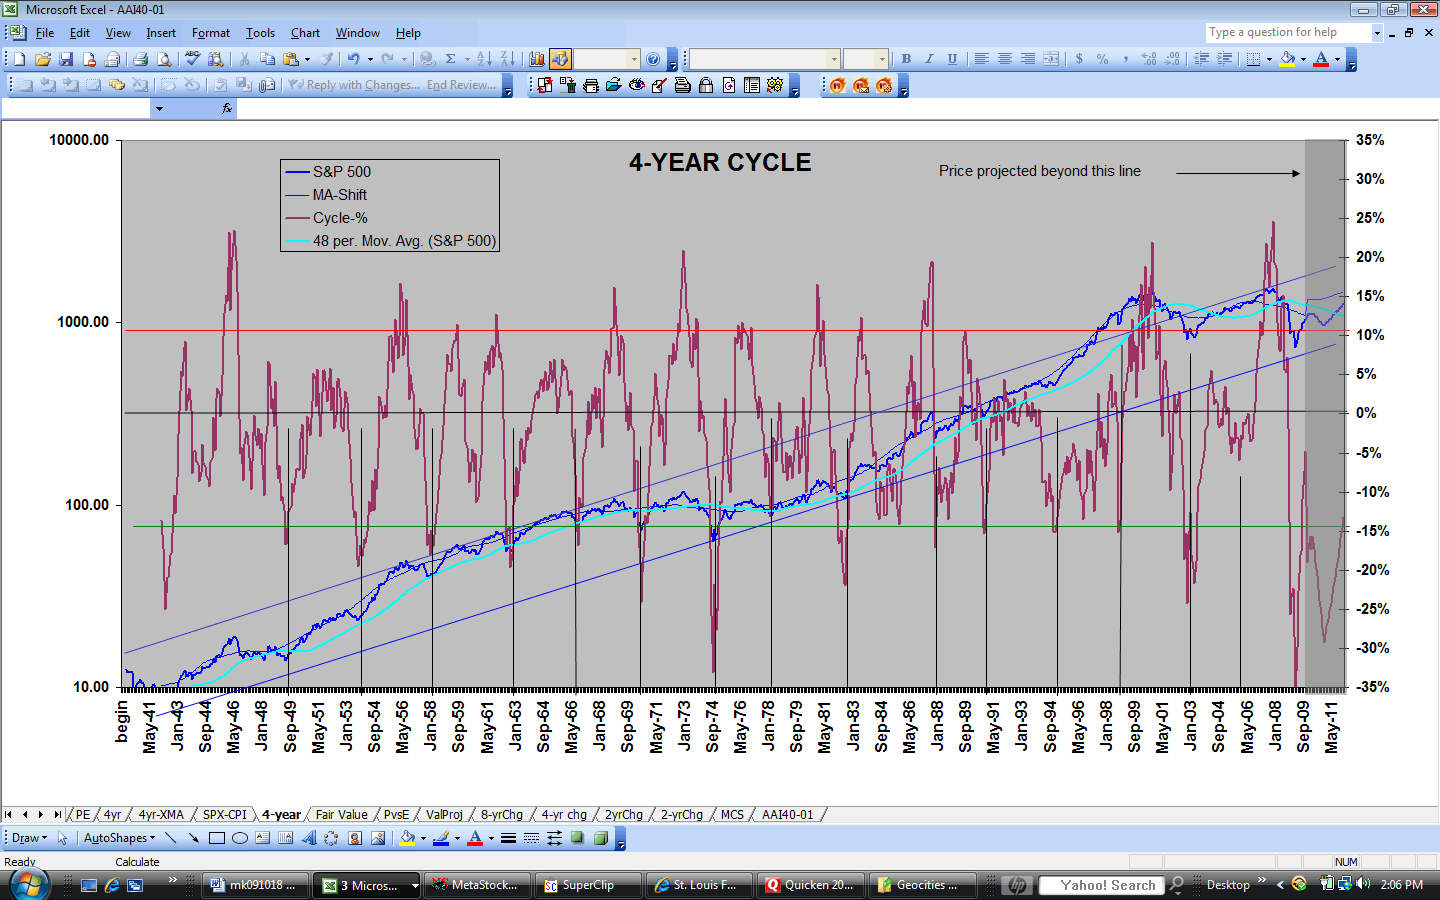
The transition to Obama seems to have inspired a good deal of hope, but not yet much confidence among investors that the damage will soon be repaired. He will certainly change much of what’s been wrong in our government, but the challenges are unprecedented, most changes will take time, and the healing process will probably be slow. Nevertheless, based on the Audacity of Hope and the 4-year cycle (http://www.geocities.com/petegersb/4YearCycle.GIF ), I expect to be able to shed my pessimism sometime next year.
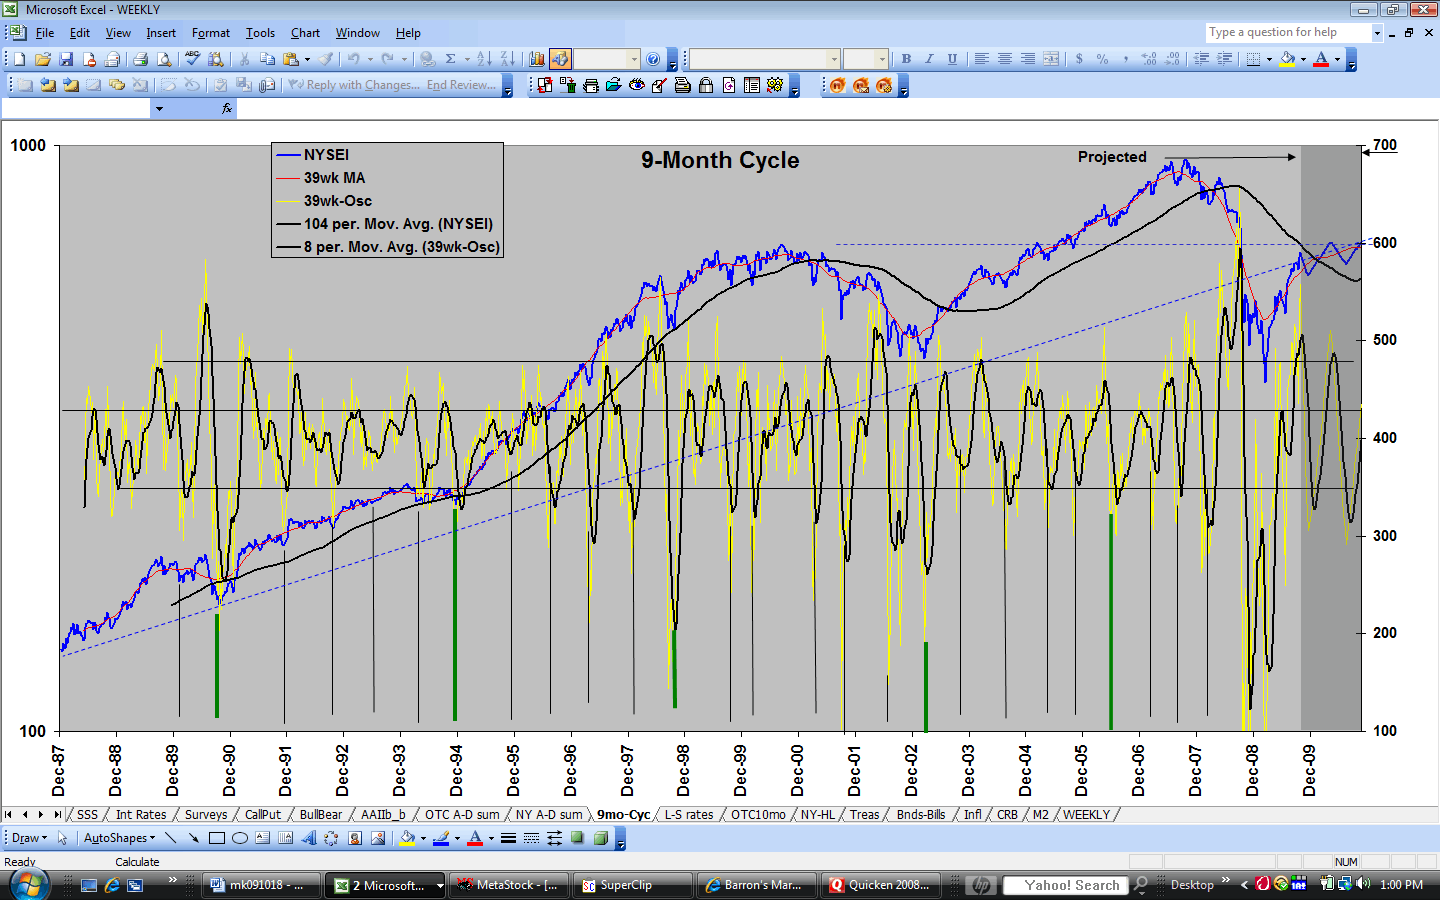
Next year is a long way away, and meanwhile we have intermediate-term trouble for stocks. Last week the McClellan Summation Indexes (http://www.geocities.com/petegersb/A-Dsummation-NYSE.GIF , http://www.geocities.com/petegersb/A-Dsummation-OTC.GIF ) turned down at the trendline from about the same level as at the last two 9-month cycle peaks. As often as not, the first peak in this indicator is not the final peak for the cycle, so we may see a more extended topping action in the still young 9-month cycle (http://www.geocities.com/petegersb/9moNYA.GIF ). But even if it wasn’t the peak for this cycle, the downturn suggests that there isn’t much upside left, if any. Some 20-week cycle indicators are also showing indications of a top, including the weekly VIX and VXN (http://www.geocities.com/petegersb/VIX-weekly.GIF , http://www.geocities.com/petegersb/VXN-weekly.GIF ), and the 10-wk cycle is now perhaps halfway through its downtrend (http://www.geocities.com/petegersb/Overview-med.GIF, http://www.geocities.com/petegersb/VIX.GIF, http://www.geocities.com/petegersb/VXN.GIF). The intermediate composite turned downward last week (NDX (http://www.geocities.com/petegersb/NDX.GIF), SPX (http://www.geocities.com/petegersb/SP500.GIF), Russell small cap index (http://www.geocities.com/petegersb/Russell2000.GIF )), and the short-term composite is not yet near oversold.
In the very short term, we may see some relief from the decline this week. The 13-day cycle turned up on Thursday, but don’t expect much from it. Technically, it will be bucking downtrends in most of the other cycles and fundamentally, it will probably be bucking more bad earnings reports.
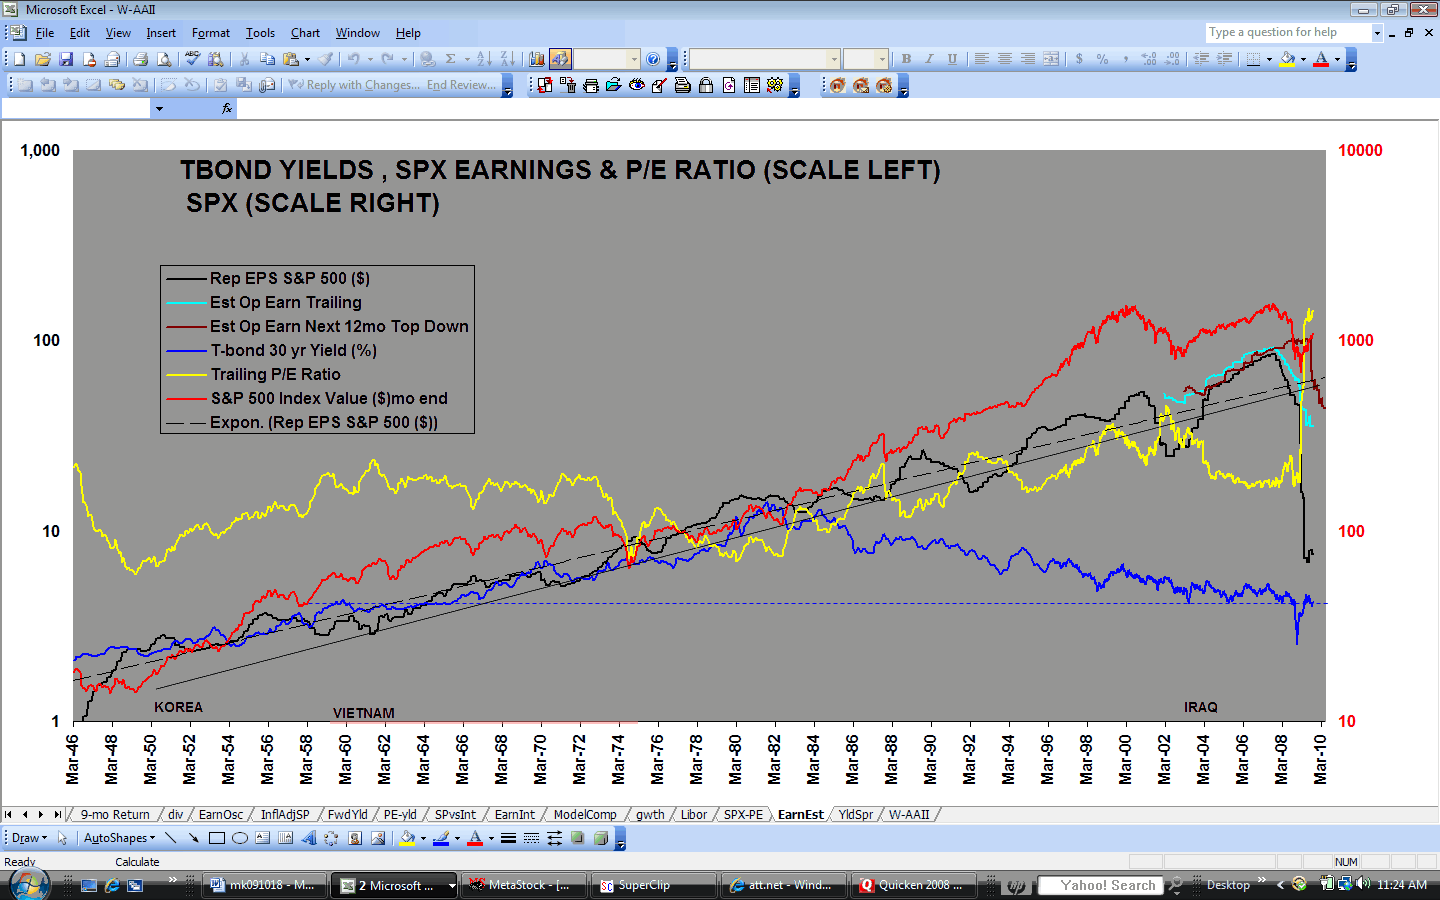
Standard & Poor’
made some notable changes to its earnings
estimates last week http://www2.standardandpoors.com/portal/site/sp/en/us/page.topic/indices_500/2,3,2,2,0,0,0,0,0,0,5,0,0,0,0,0.html
. It instituted 2010 projections and it significantly (by $3.27) lowered top-down
projections for 2009 (http://www.geocities.com/petegersb/EarningsEstimates.GIF
). It hasn’t yet posted 2010 bottom up operating projections (perhaps realizing that it had better change
its methodology if it hopes to avoid another year of missing the mark by such a
large margin), so I have assumed them equal to the top-down projections (http://www.geocities.com/petegersb/EarnY-Y.GIF
). It’s not a picture that you would expect to support a bull market, even if
it doesn’t once again prove to be too optimistic. Maybe we can hope for
something better in 2011.
Treasury rates (http://www.geocities.com/petegersb/TreasuryYield-10yr.GIF), as suspected, established a short-term peak a week and a half ago. Last week, like stocks, Treasuries extended the 10-wk cycle downtrend and established a 13-day cycle low last week. Unlike stocks, they remain in an intermediate uptrend. I expect they will wander in the Dec-Jan range until the 10-wk cycle bottoms and then begin to move substantially higher. Certainly the massive supply of treasuries that will be coming to market will push rates upward as will reduced demand from our lenders who are now also hurting economically. If the Treasury can’t sell enough debt to fund the deficit and resorts to printing dollars, the resulting inflation will also drive rates higher. Bond optimism (http://www.geocities.com/petegersb/BondSentiment.GIF ), still at a high 76% suggests that the next big move for interest rates will be to the upside.
Treasury bonds (http://www.geocities.com/petegersb/Treasury-20yr.GIF ) slightly outperformed Inflation Protected Treasuries (http://www.geocities.com/petegersb/TIPs.GIF) as inflation fears subsided with another negative reading for the Consumer Price Index (http://www.geocities.com/petegersb/CPI.GIF ). Those fears will probably surge as soon we get some evidence that the worldwide stimulus is working.
Corporate bonds (http://www.geocities.com/petegersb/CorporateBonds.GIF) began an intermediate downtrend last week. As bleak corporate earnings are announced over the next few weeks the decline should extend at least to the 9-month moving average and more likely to the 10-wk moving average.
Municipal bonds (http://www.geocities.com/petegersb/MunicipalBonds.GIF
) also declined last week, but the intermediate uptrend remains intact
according to the cycle indicators. I think the indicators are merely lagging the
price peak that we saw last week. The 10-wk and longer cycles are overbought.
Crude oil (http://www.geocities.com/petegersb/CrudeOil.GIF ) tested its December low, so far successfully. It probably made a 13-day cycle bottom on Thursday, but any rally will have to contend with continuing declines in the next 3 longer cycles for a while longer. Oil is at serious risk for new multi-year lows after a failing rally attempt this week. That’s helpful for our short-term economic future, but very bad for our long-term energy future.
Natural gas (http://www.geocities.com/petegersb/NaturalGas.GIF ) dived below the 2007 low to reach a two and half year low after an expected 13-day cycle rally failed to materialize. It appears likely to go still lower. Intermediate and short-term composites are trending downward and are not near oversold.
Energy stocks (http://www.geocities.com/petegersb/EnergySPDR.GIF) slipped below their 10-wk moving average last week after the 10-wk cycle and the intermediate composite joined the short-term composite in downtrends. I said last week that “Energy stocks probably will not buck the downtrend in the broader market” and last week’s action reinforces that opinion. That said, they should join in a short-lived 13-day cycle rally attempt this week.
Gold (http://www.geocities.com/petegersb/GoldBullion.GIF) bounced strongly off of the rising 10-wk moving average
as 13 and 26-day cycles bottomed. Rallies in those short cycles will be
struggling against declining 10 and 20-wk cycles, so the declining 9-mo moving
average will likely be a challenge. The
9-month cycle is now 3 or 4 months old and overbought, so the short-term rally
that began on Friday may well produce the peak. The intermediate composite has
already turned down. When the short-term rally peaks, it will be time to exit
long positions.
Gold Stocks (http://www.geocities.com/petegersb/GoldStocks.GIF
) show the same price and indicator pattern as the underlying metal, so you
have to reach the same conclusion.
The dollar (http://www.geocities.com/petegersb/Dollar.GIF) didn’t produce the expected short-term pullback last week. Instead it rallied above the 10-wk moving average and then produced another likely short-term peak on Thursday. The short-term composite turned down while the intermediate composite remains in a weak uptrend. After the short-term composite bottoms, probably in a few weeks, the intermediate rally should pick up speed to the upside.