11/23/08
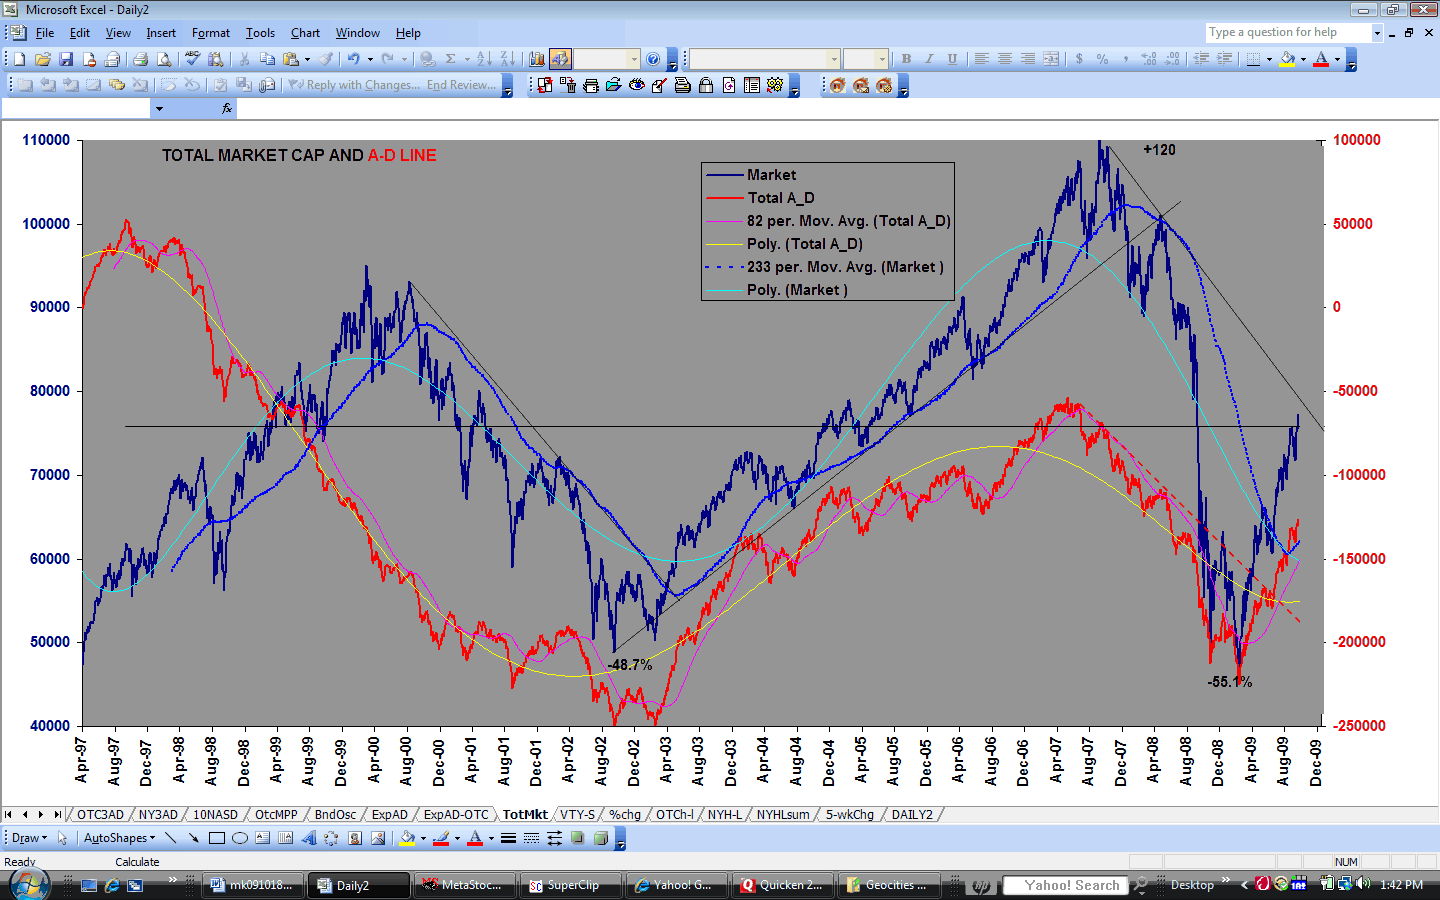
The markets have now had their worst decline since 1932. Total market capitalization (http://www.geocities.com/petegersb/TotalMarket.GIF ) is down 55.1% from its peak, compared to 48.7% in 2002. Most of the indicators are in uncharted territory, and I have had to rescale some charts.
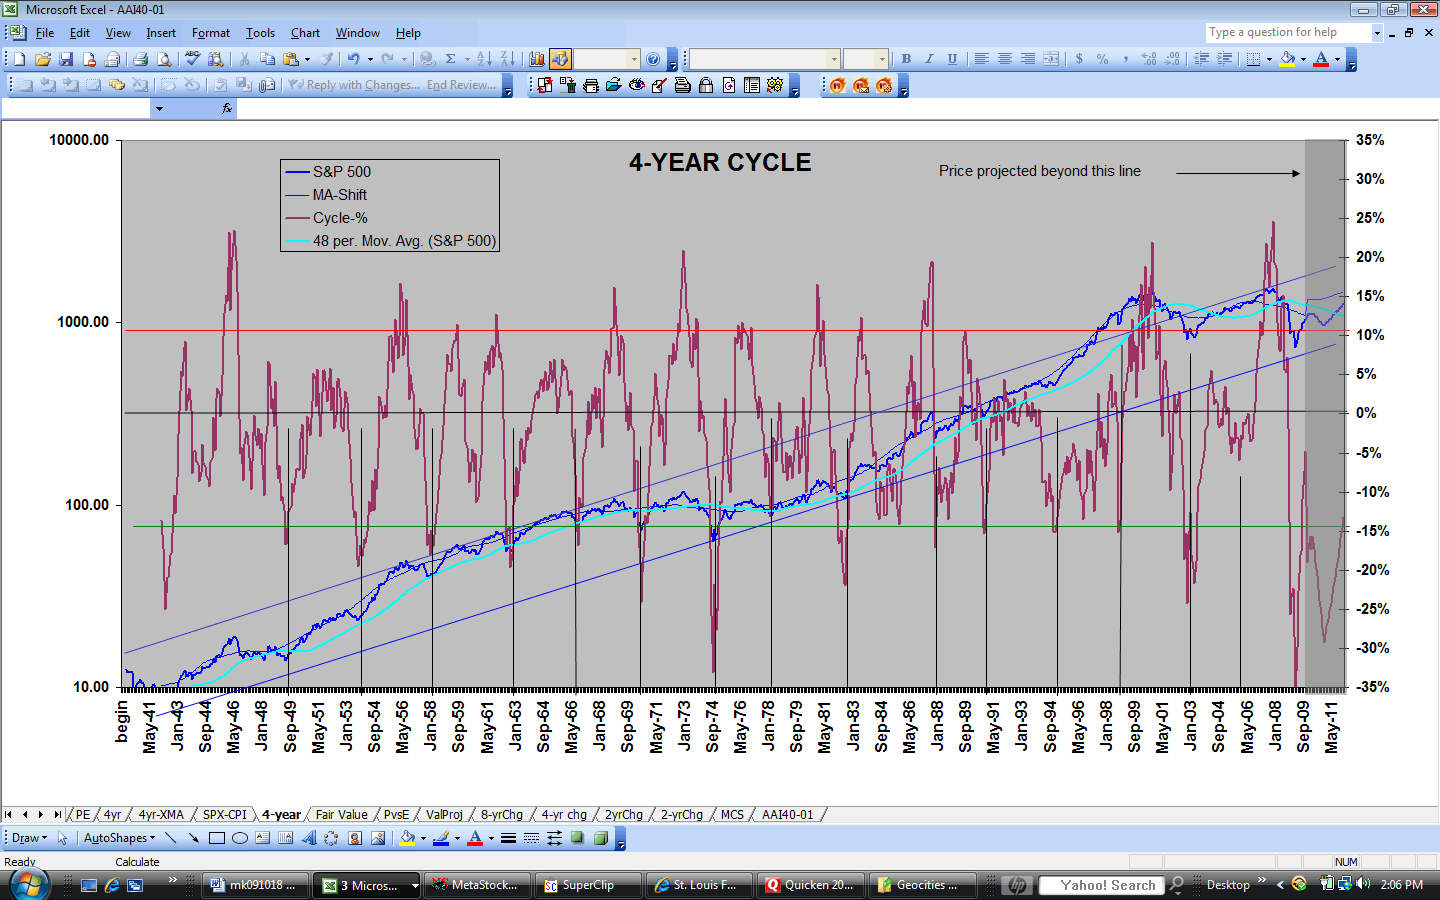
The December issue of Money magazine, written when the Dow was down only 40%, attempts to reassure its readers with a few economic statistics demonstrating that “we are still a far cry from the desperate times of the Great Depression. The trouble is that it compares 3rd quarter 2008 data on GDP, unemployment, inflation and consumer spending with comparable data in 1932, not the first leg of the market crash in 1929 that is more comparable to what we are now seeing. During the crash of 1929 the market declined 49.4% on the Dow in a period of about 10 weeks before a 50% rally. It gets most of the press probably because of its rapidity, not its magnitude which was comparable to several others, including the current decline. The economic collapse came later, and so did an even worse decline in the Dow of 86.4% from the 1930 high. My point here is that the decline so far, mostly over the last 3 months, has been fairly analogous to the 1929 crash, and that we are far from out of the woods with respect to a potential 1930-1932 type decline. After all, the 4-year cycle (http://www.geocities.com/petegersb/4YearCycle.GIF ) has two more years to run until its expected bottom in 2010, and the economic decline appears to be in its early stages. If we are fortunate, the decline will be halted at the bottom the 70-year trend channel around 750 on the SPX in 2010, and not break below it. That’s about where the market was on Friday before the Geithner rally that tacked on 50 SPX points in an hour.
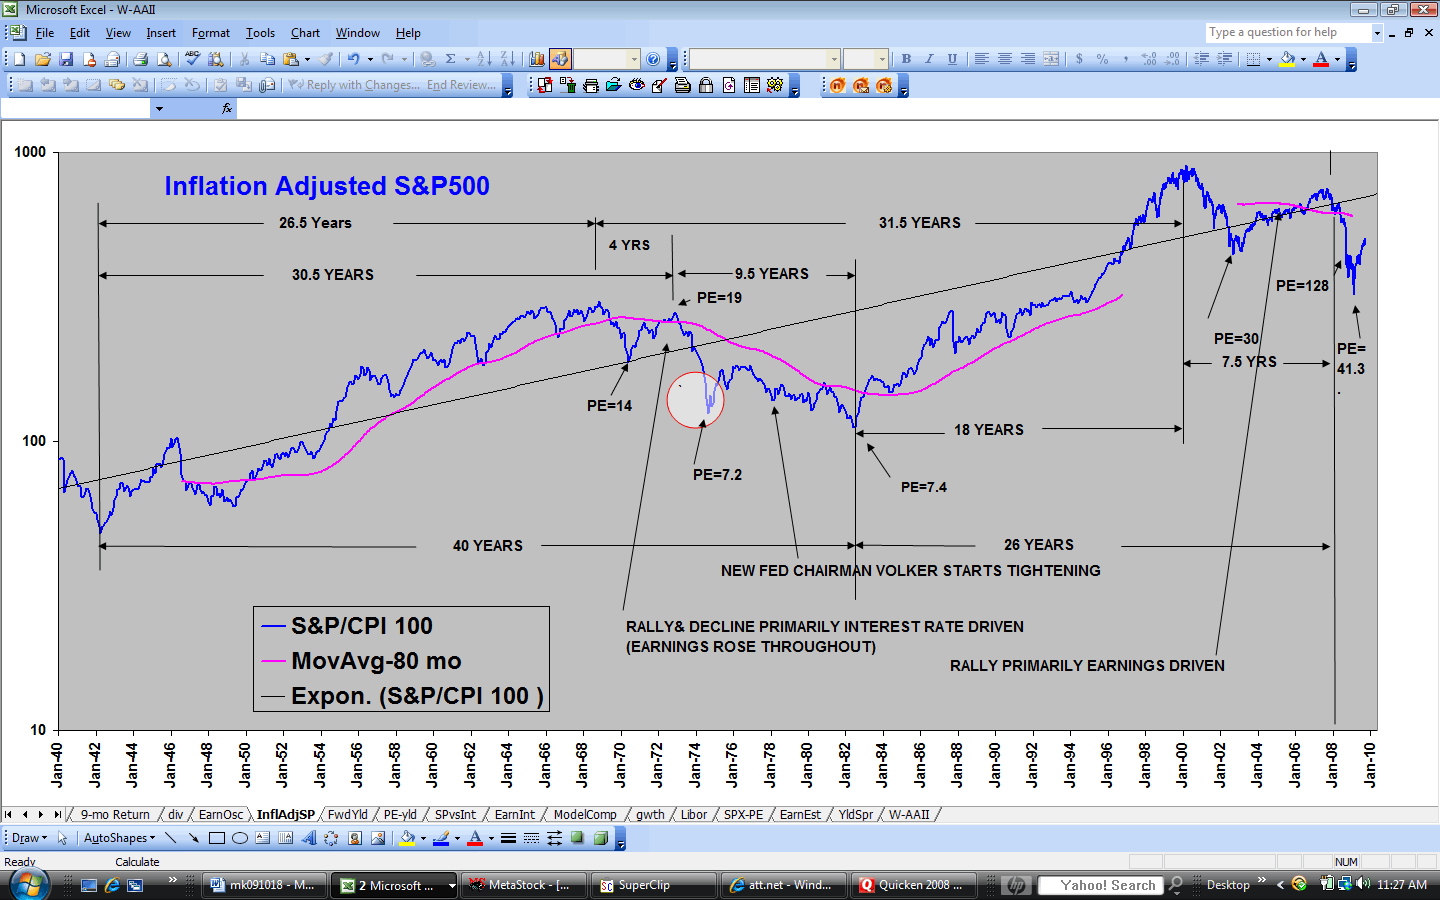
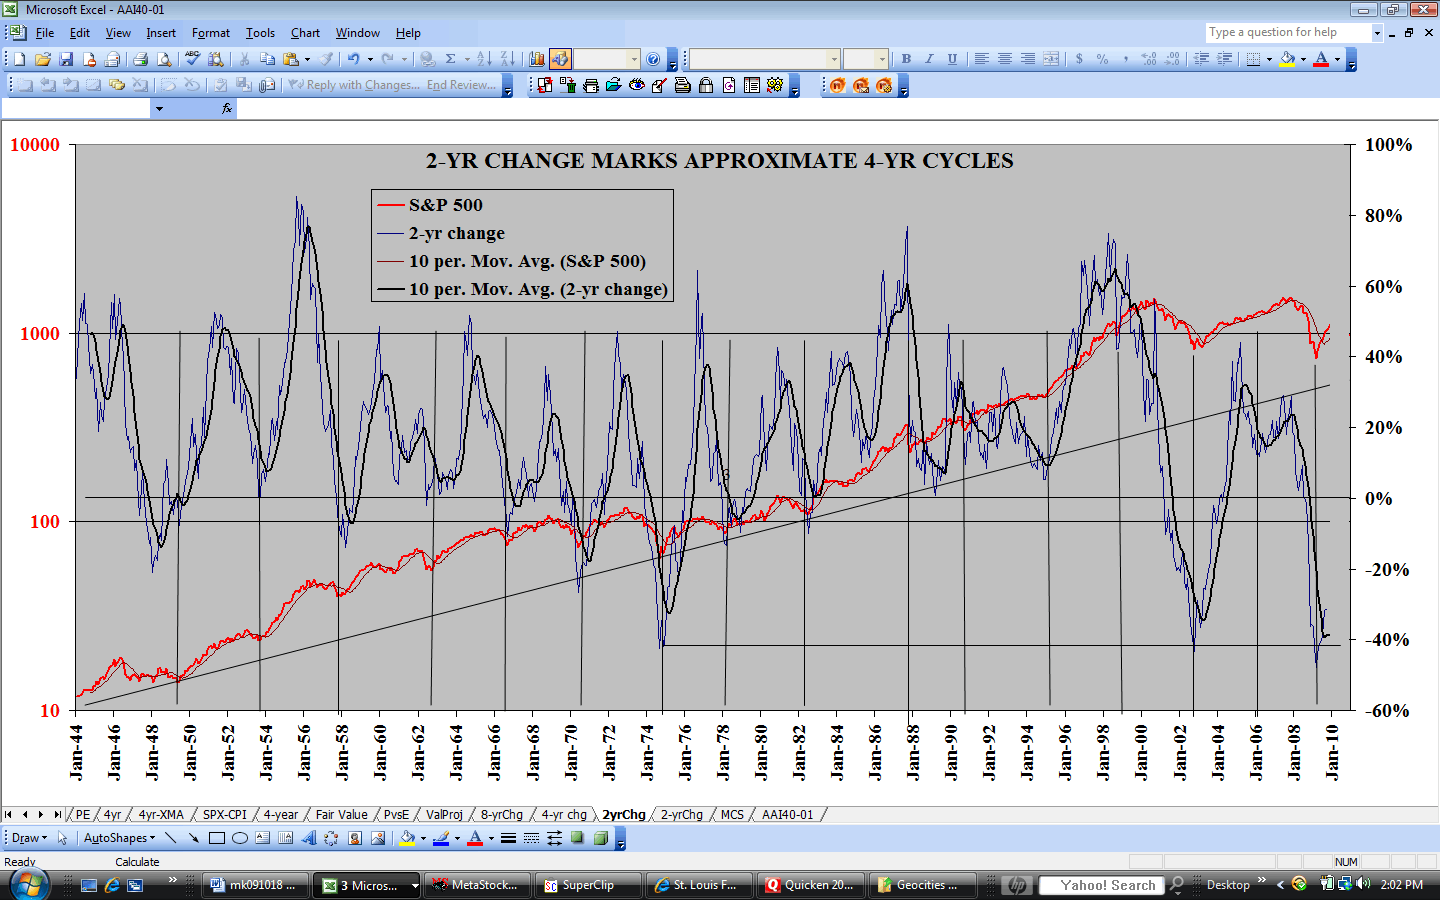
A more cheery, but still grim scenario is the 1970s analogy best illustrated with the inflation-adjusted SPX chart (http://www.geocities.com/petegersb/SPX-InflationAdjusted.GIF ). If the similarity to that price pattern continues the market looks reasonably close a bottom and a subsequent period of stagnation. Unfortunately, while the magnitude of the decline has been very similar, the timelines don’t fit well with a 4-year cycle that appears to now be only near a midpoint. Although stocks tend to perform relatively poorly during the first two years of an administration, there is ample precedent for markets to improve during the first two years of a new administration (http://www.geocities.com/petegersb/2-YrChange.GIF ). In fact, only under Nixon, Carter (those nasty70’s) and G.W. Bush did the SPX produce a negative return during the two years after inauguration. Dubya will be alone in failing to produce a positive return during his last 2 years in office. He delivered an abysmal negative 50% in the last two years and a negative 33% since some of you last elected him. There is no precedent since Herbert Hoover.
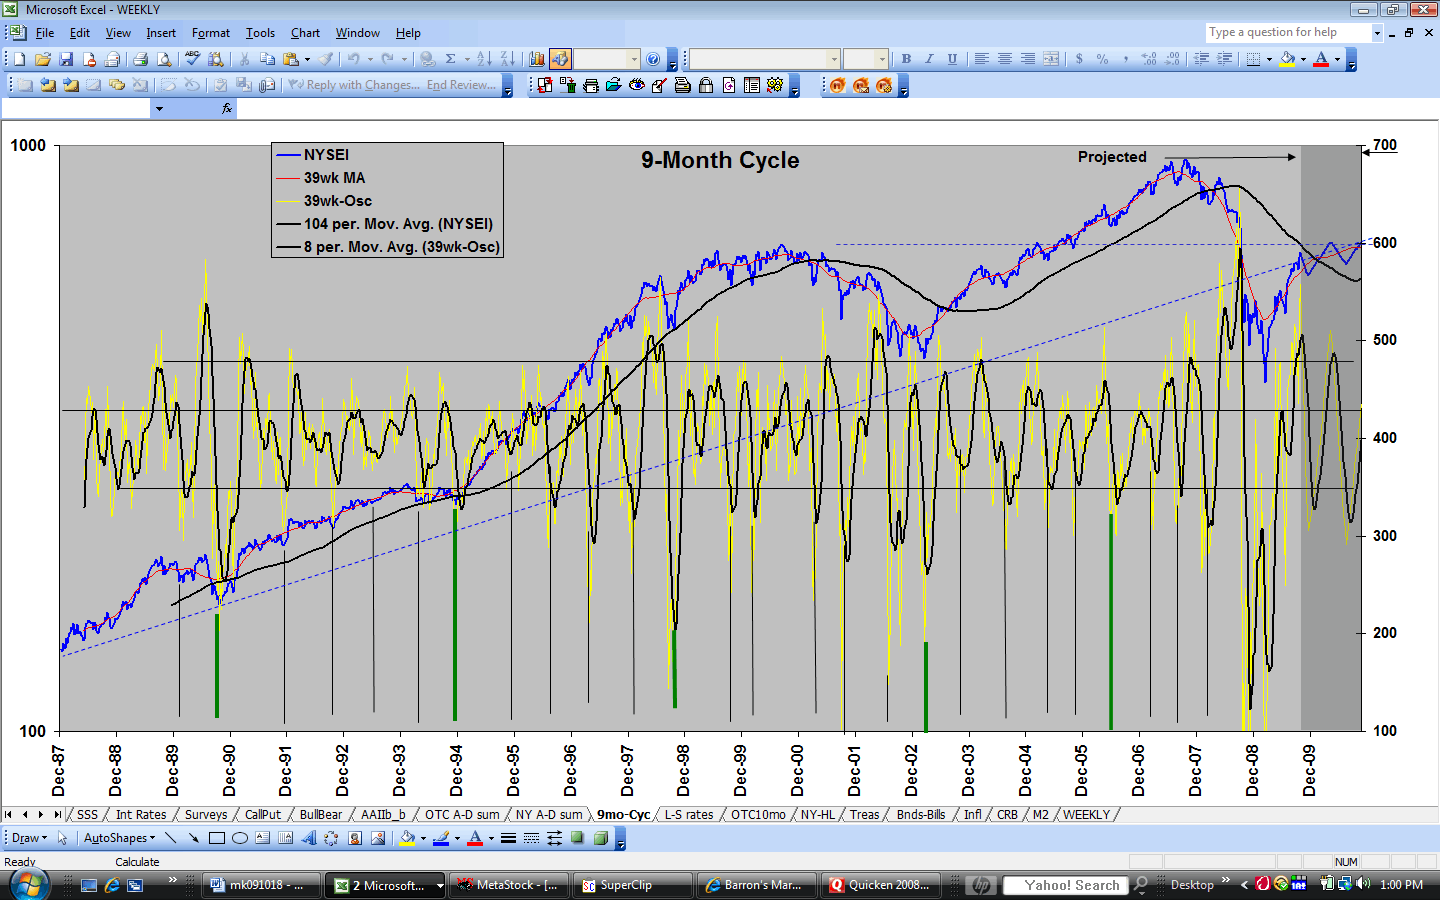
So much for long-term gloom and doom. How about that near-term 9-month cycle low that I have for months been expecting in November or December (http://www.geocities.com/petegersb/9moNYA.GIF , http://www.geocities.com/petegersb/Overview-long.GIF)? The 9-month cycle is oversold and in the right time frame, but it has to nest with shorter cycle lows, and some of those appear not quite ready. The 20-week cycle (nominally 104 trading days) is 19 weeks old and oversold (http://www.geocities.com/petegersb/Overview-med.GIF ), so it is ready. The 10-week cycle has marginally met its minimum life expectancy, but it is far from oversold so it is problematic. Furthermore, both the daily VIX (http://www.geocities.com/petegersb/VIX.GIF) and VXN (http://www.geocities.com/petegersb/VXN.GIF) indicate that the 10-week cycle remains in a downtrend that began on 11/05 and has further to run on the downside. The 26-day cycle was deeply oversold and beyond its normal life expectancy when its indicators hit bottom on Thursday. So it is ready to bottom, and the DStocs say it did (SPX (http://www.geocities.com/petegersb/SP500.GIF), NDX (http://www.geocities.com/petegersb/NDX.GIF), Russell small cap index (http://www.geocities.com/petegersb/Russell2000.GIF )). The 13-day cycle, however, was only in its 7th day and far from oversold when news of Obama’s selection of Timothy Geithner to head the treasury sparked a steep last-hour rally on Friday. My guess is that we’ll see a little follow-through of the rally during this holiday week, followed by a successful test of Friday’s lows in early December when the 10-wk and 13-day cycles have reached their life expectancy. Then tax selling should abate and seasonal strength should appear. The pain should subside for a few weeks or months before the secular slide into 2010 resumes.
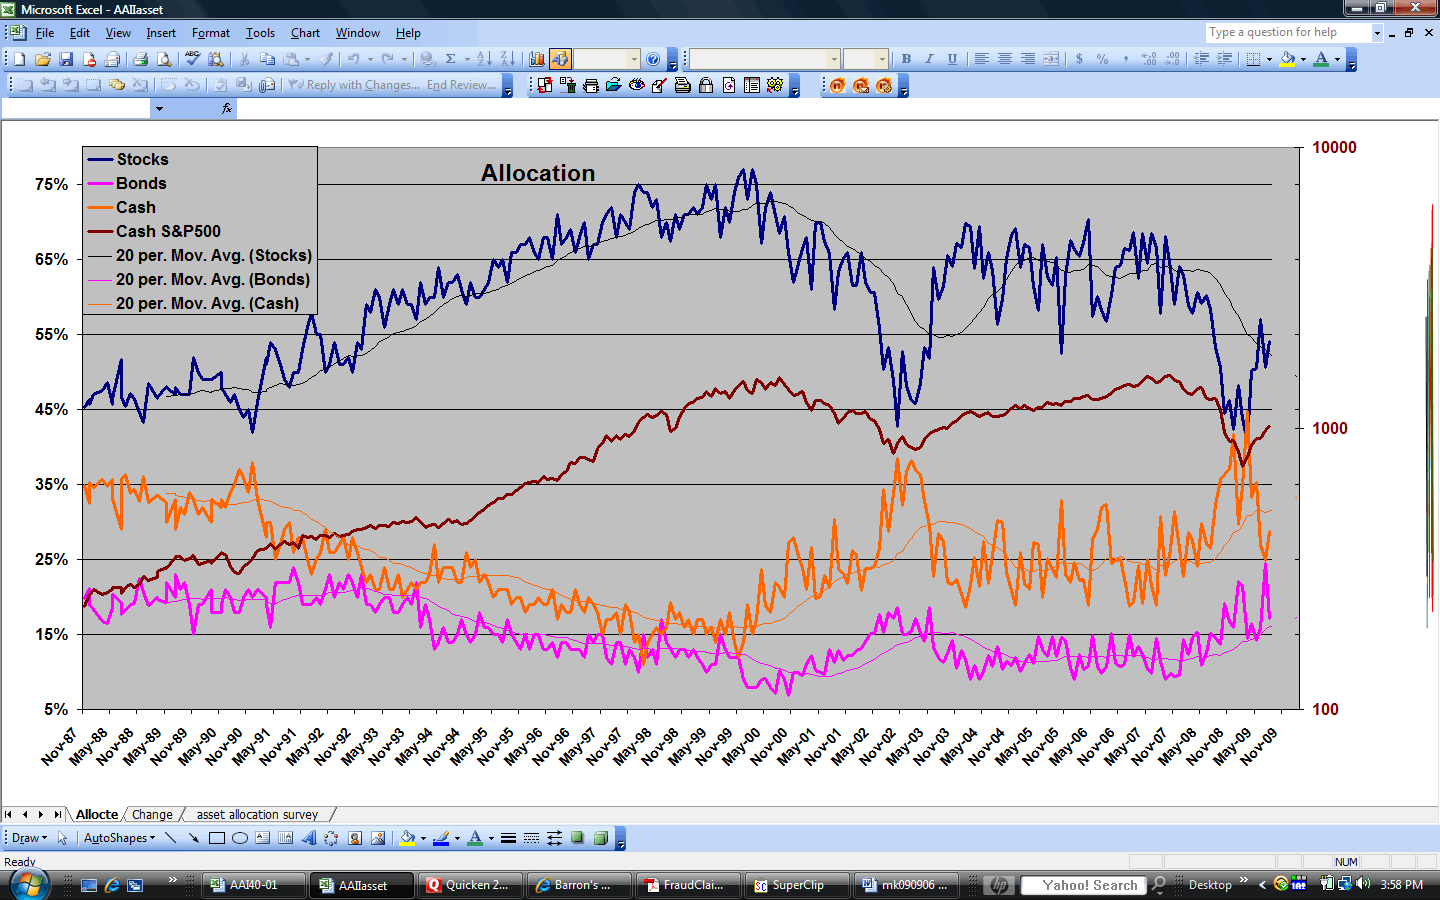
Sentiment (http://www.geocities.com/petegersb/SurveysCombined.GIF ) remains favorable for an intermediate rally in stocks, although its buy signal was premature. The characteristic double dip at major bottoms appears to have been completed and optimism is improving. But the trend may be in jeopardy when last week’s market is reflected in the data, so we may see a triple dip. October AAII asset allocation (http://www.geocities.com/petegersb/AAIIassets.GIF ) also supports the likelihood of a significant bottom soon, and I suspect that the November data will support it even more strongly.
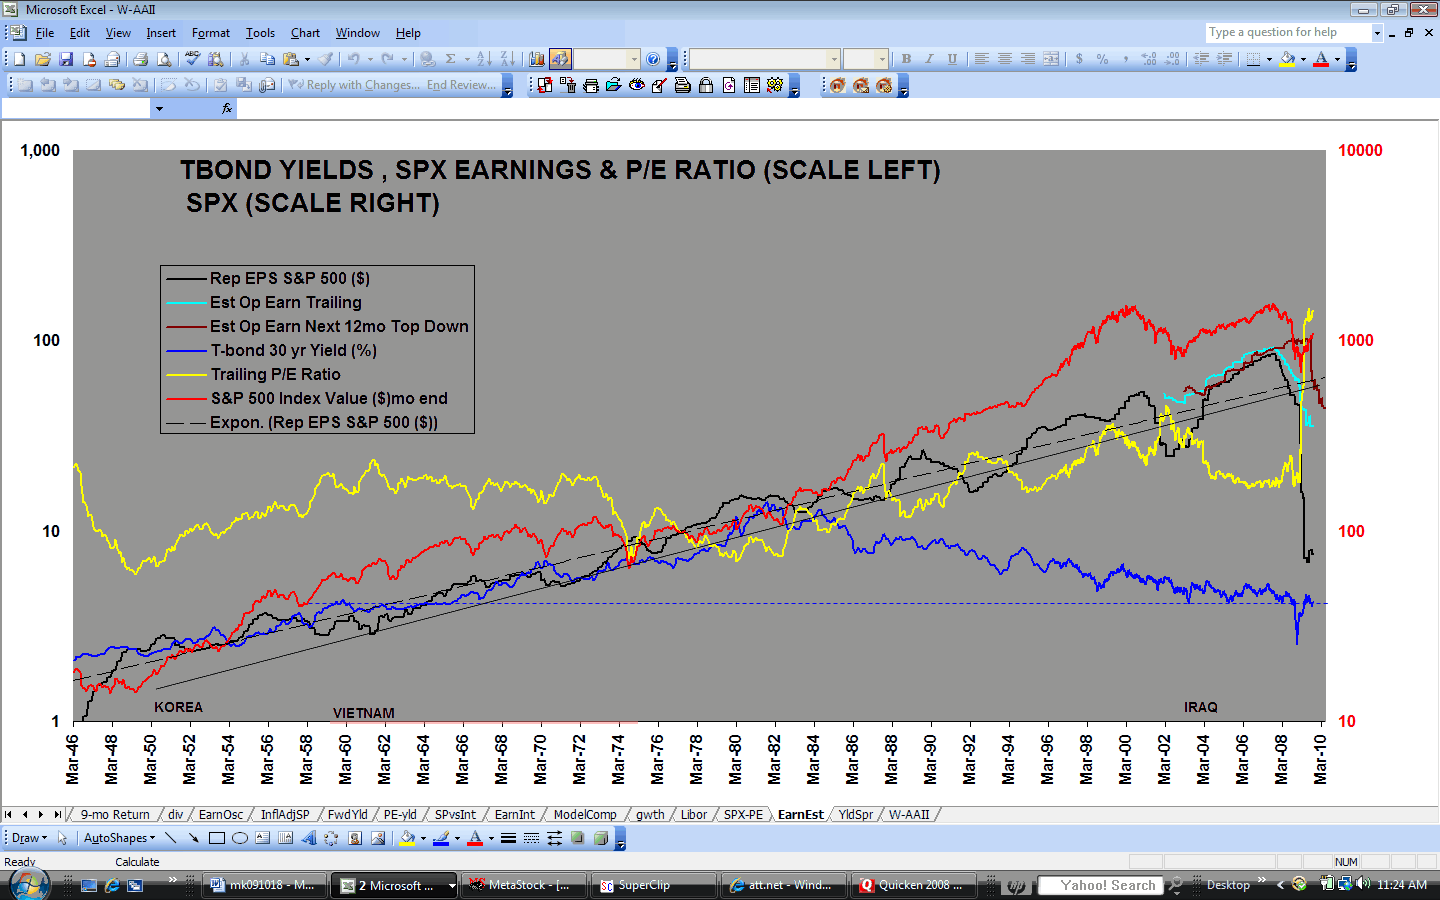
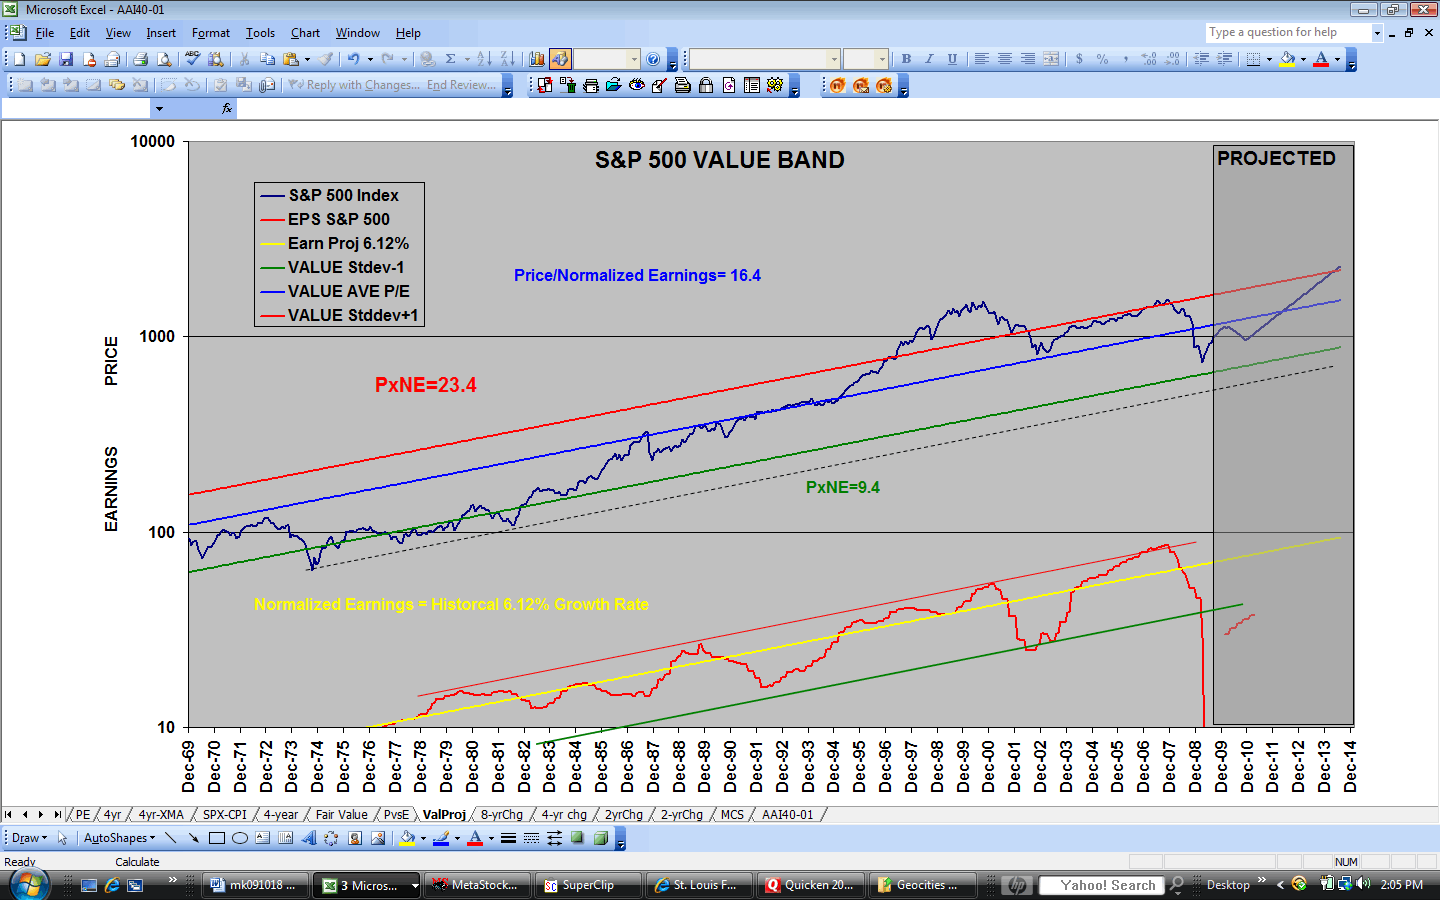
Earnings (http://www.geocities.com/petegersb/EarningsEstimates.GIF ) are likely to trend in the wrong directions for a while longer, and S&P’s bottom up and top down earnings estimates (http://www.geocities.com/petegersb/EarnY-Y.GIF ) continue to deteriorate as they become more realistic. P/E’s are now a little below the historic norm (http://www.geocities.com/petegersb/ValueBand.GIF ), but not yet at the bottom of the value band.
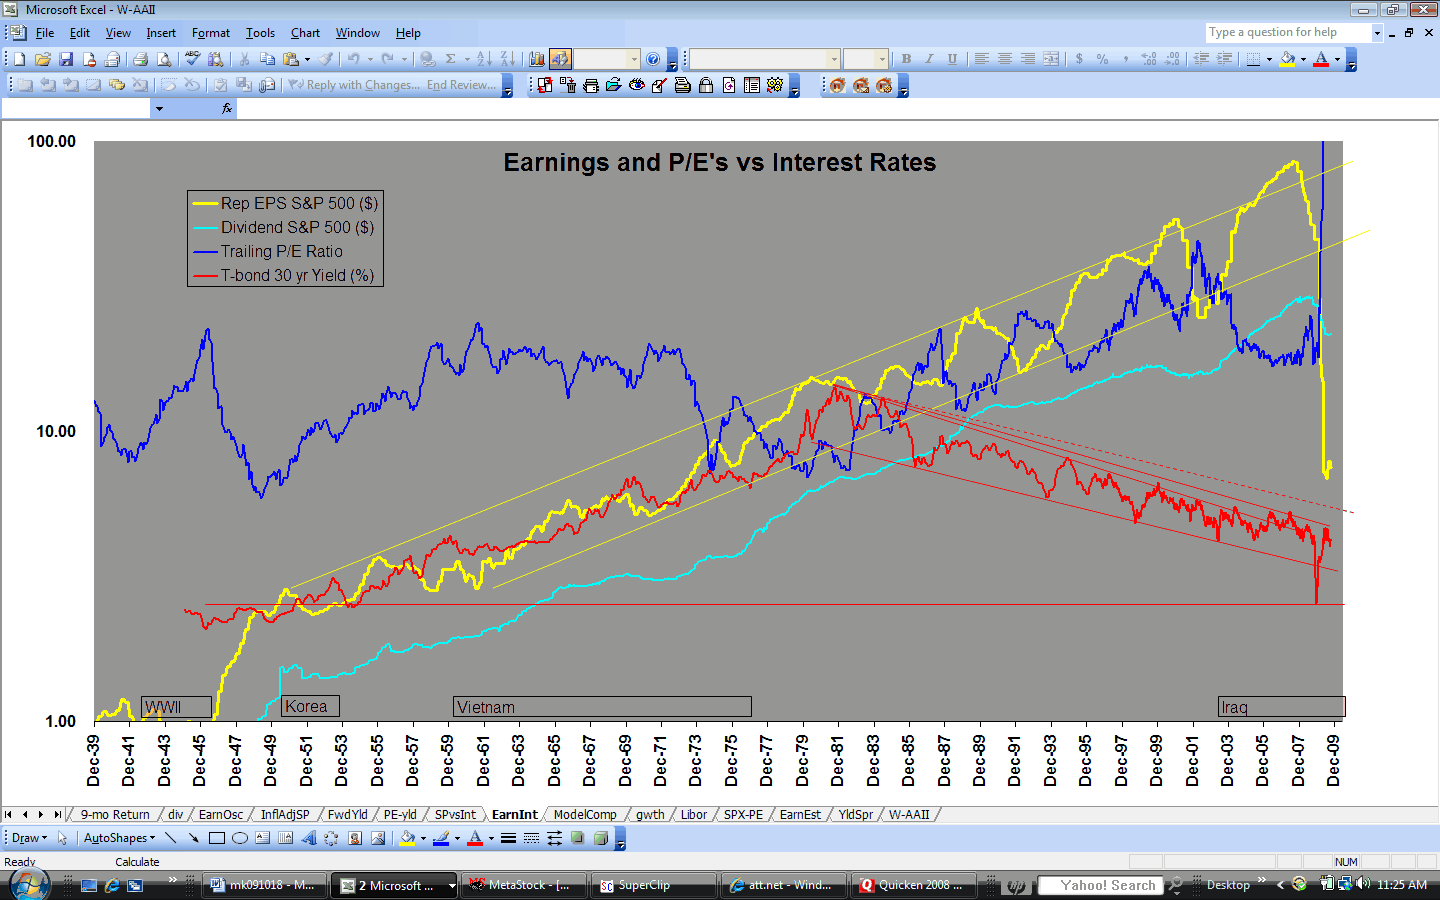
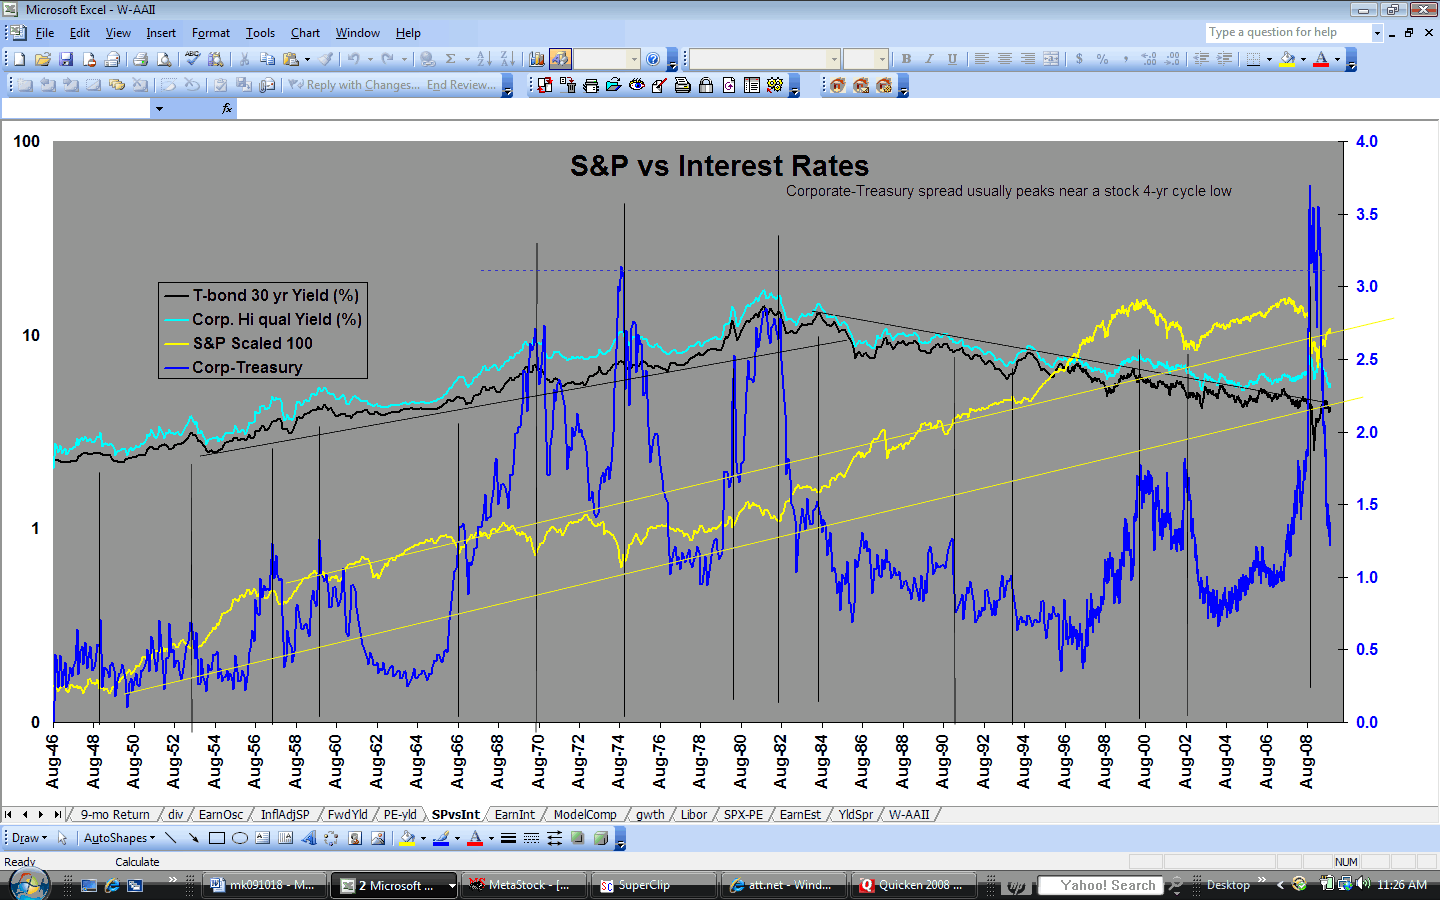
The yield on Treasury Bonds (http://www.geocities.com/petegersb/Earnings-InterestRates.GIF ) last week plunged to the lowest level of my investing lifetime (a half century). The spread between High-Grade Corporate and Treasury yields (http://www.geocities.com/petegersb/Stocks-InterestRates.GIF ) backed off from its highest level in my 62-year data base. High-level peaks in this spread tend to occur in the vicinity of major bottoms in stocks, but it’s not very precise. 10-year Treasury yields (http://www.geocities.com/petegersb/TreasuryYield-10yr.GIF) look ripe for a short-term bottom, but the intermediate cycles suggest more decline to come in yields. Obviously the flight to quality has been driving the yields, so a short-term pop will probably be accompanied by a rally in stocks.
The discrepancy during the last 2 months between the performance of conventional Treasury bonds (http://www.geocities.com/petegersb/Treasury-20yr.GIF ) and Inflation Protected Treasuries (http://www.geocities.com/petegersb/TIPs.GIF) went in to overdrive last week with the help of oil-driven deflation in the CPI (http://www.geocities.com/petegersb/CPI.GIF ) . The treasury market is now betting on actual deflation over the next 5 years, and less than 1% annual inflation for a generation. I won’t bet against this verdict, but the bond market has been wrong before and I suspect it will be wrong this time. If not it portends grim economic times ahead. Corporate bonds (http://www.geocities.com/petegersb/CorporateBonds.GIF) look ripe for another plunge – not a good omen for stocks if it materializes.
Crude oil (http://www.geocities.com/petegersb/CrudeOil.GIF ) broke below $50 last week. With both short and intermediate composites deeply oversold, it’s ripe for a bottom. For the sake of our long-run energy independence, it better rally soon, but meanwhile it should give the economy a boost.
Natural gas (http://www.geocities.com/petegersb/NaturalGas.GIF ) remains near its lows despite its 4-week-old intermediate uptrend. Conflicting cycle trends suggest at least a few more weeks of trying to form a bottom.
Energy stocks (http://www.geocities.com/petegersb/EnergySPDR.GIF) have been base-building for the last 6 weeks and have been stronger than most stocks Nevertheless, they hover near their lows and look vulnerable to another decline. Both short and intermediate composites turned down last week.
Gold (http://www.geocities.com/petegersb/GoldBullion.GIF) surged on Friday to its 10-wk moving average after
establishing a short-term bottom on 11/13. The 13 and 26-day cycle are now
overbought and ripe for a peak, so gold appears likely to back off from that
10-wk MA this week. Gold Stocks (http://www.geocities.com/petegersb/GoldStocks.GIF
) had an even bigger percentage gain on Friday, but failed to reach the 10-wk
moving average. Both short and intermediate composites are trending upward. The
uptrend appears likely to continue this week.
The dollar (http://www.geocities.com/petegersb/Dollar.GIF) managed marginal highs above the October high. Four of five cycles are overbought, and the big rally in gold on Friday may portend a weaker dollar to come.