This will be the last report until Nov 16.
10/26/08
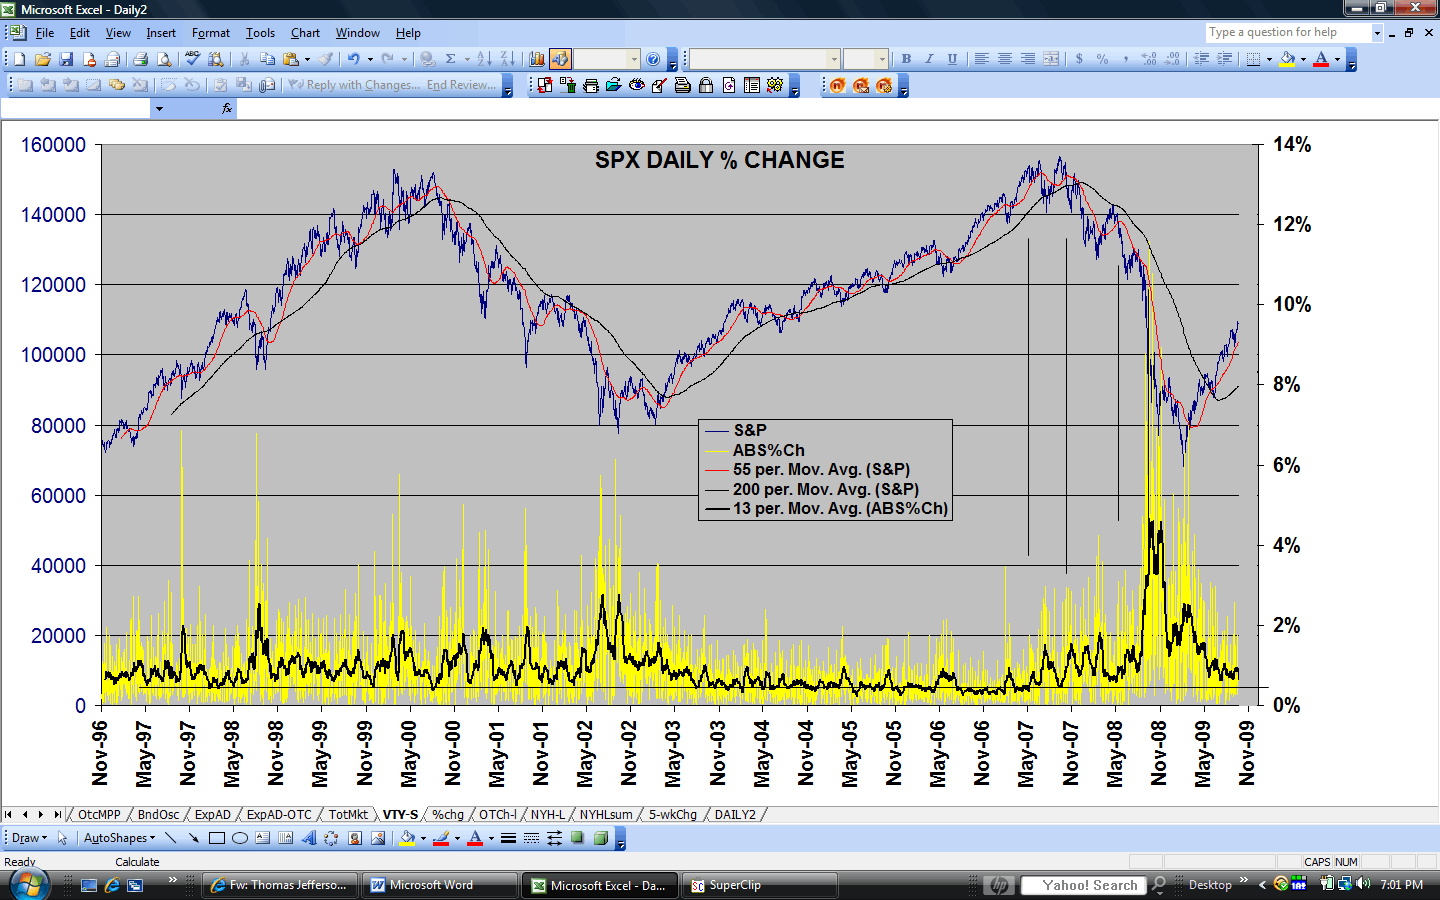
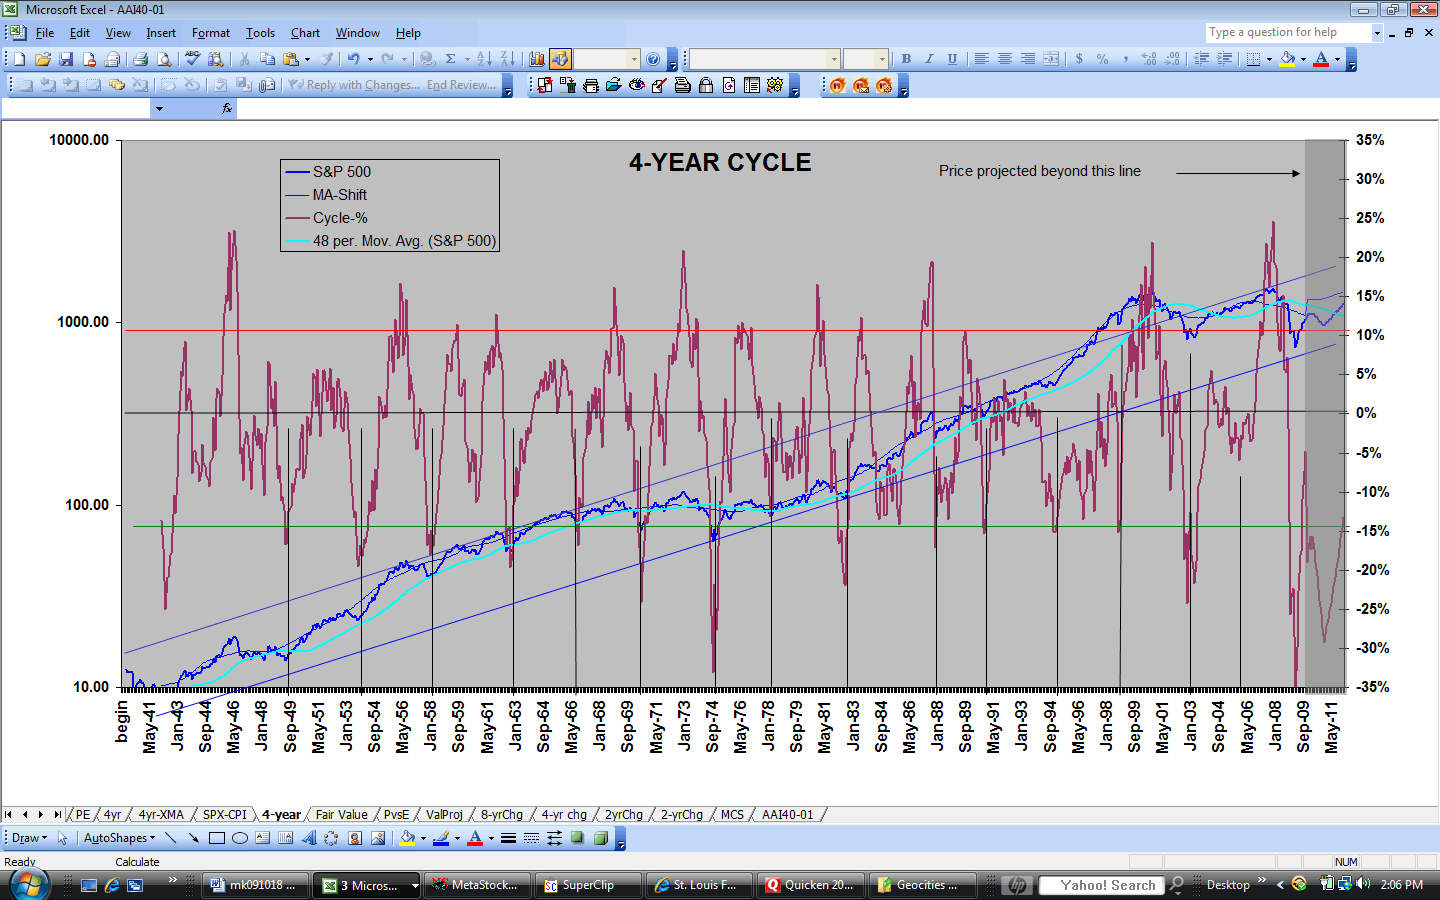
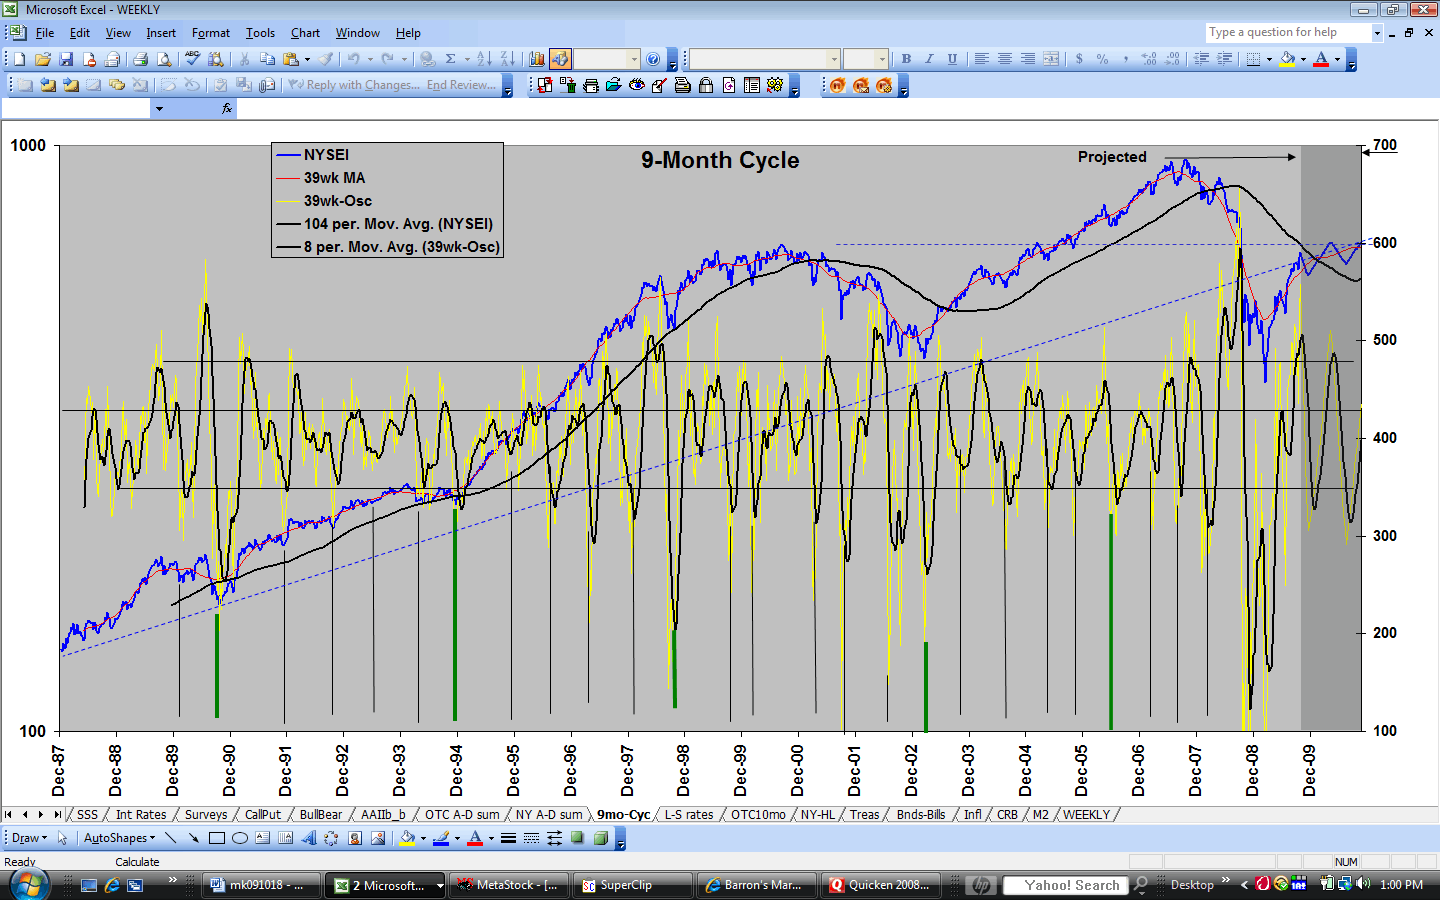
I missed the steepest market plunge since 1987 during my absence of the last few weeks, but already this one has been deeper and much more protracted, and it appears that it’s not over. Despite indicator extremes during October that I haven’t seen in my lifetime (http://www.geocities.com/petegersb/Volatility.GIF ), the 28% plunge during the 4 weeks since my last report has done little to alter my conclusion in that report: “The latest bailout does nothing to change my opinion that the market won’t make a long-term bottom until 2010 (when the 4-year cycle low is due (http://www.geocities.com/petegersb/4YearCycle.GIF ), and that lower stock prices are likely between now and year end as the declining 9-month (http://www.geocities.com/petegersb/9moNYA.GIF , http://www.geocities.com/petegersb/Overview-long.GIF) and 20-week cycles (http://www.geocities.com/petegersb/Overview-med.GIF ) run their course”. All we now know is that the market is much closer to a bottom than it was last month.
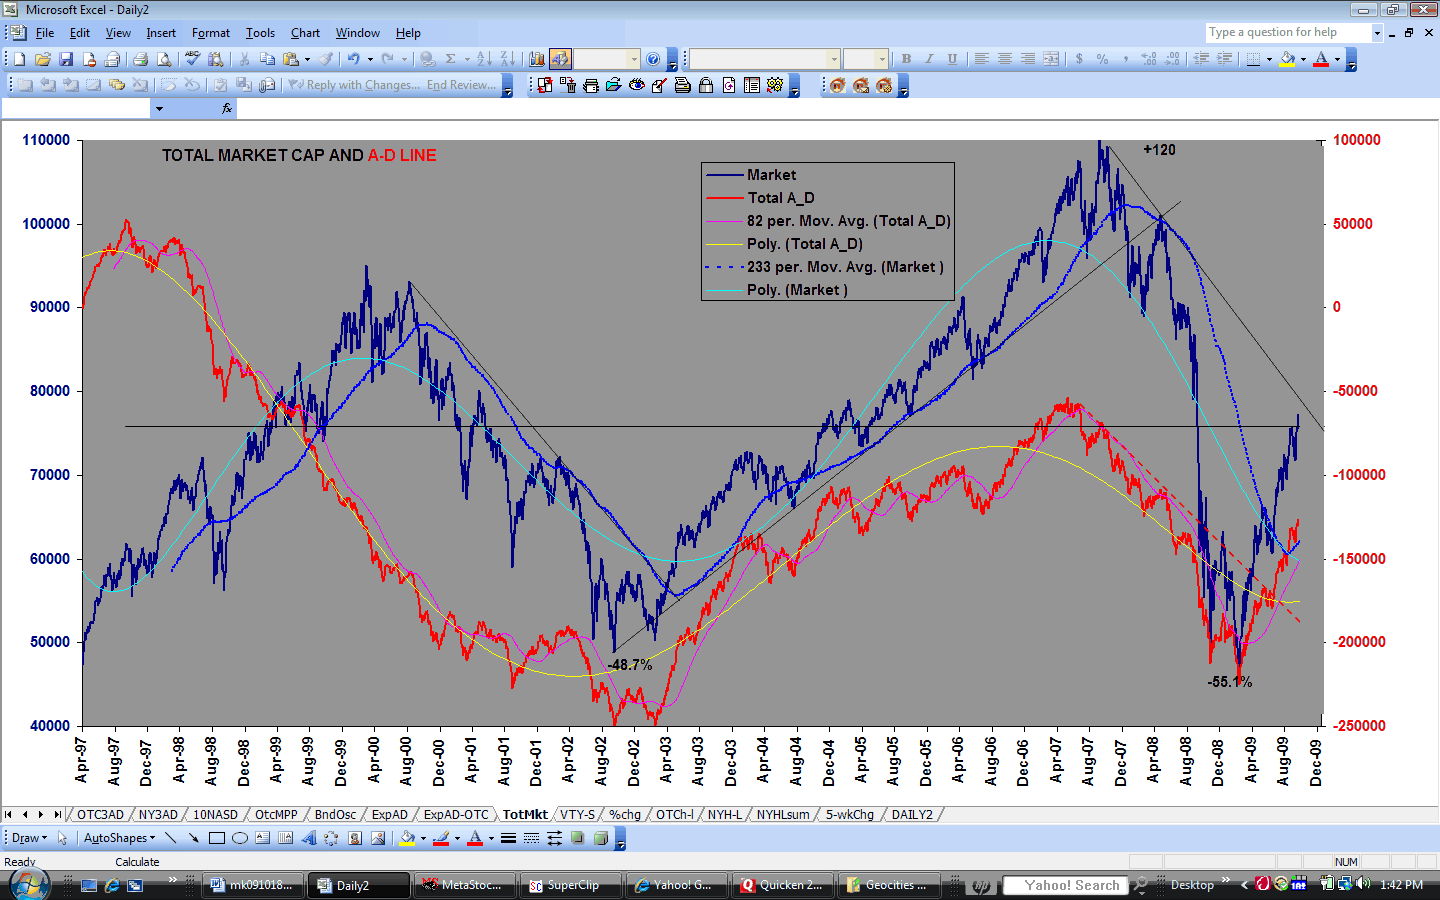
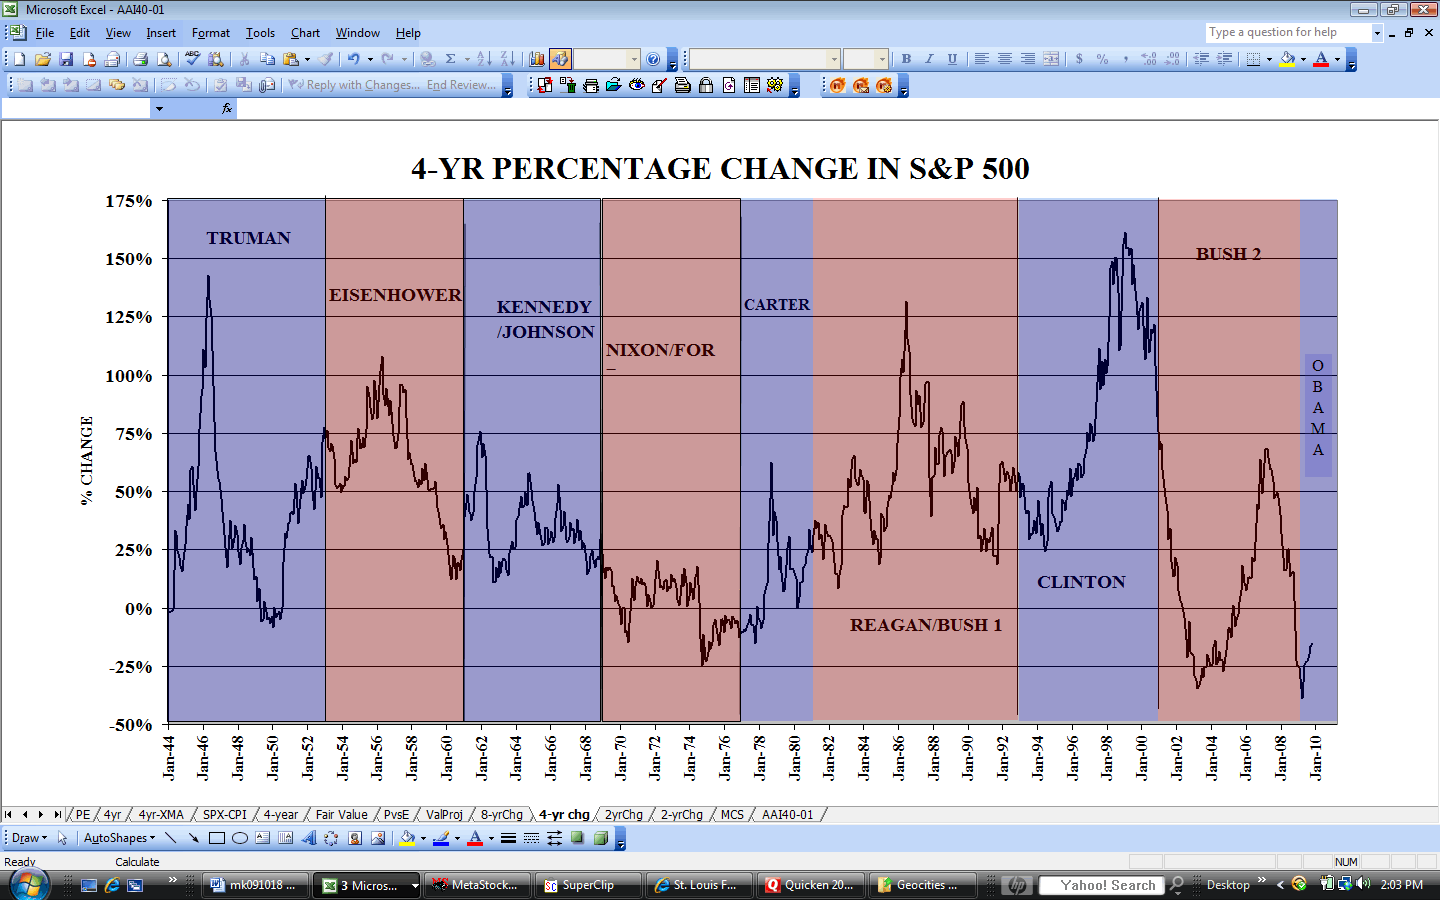
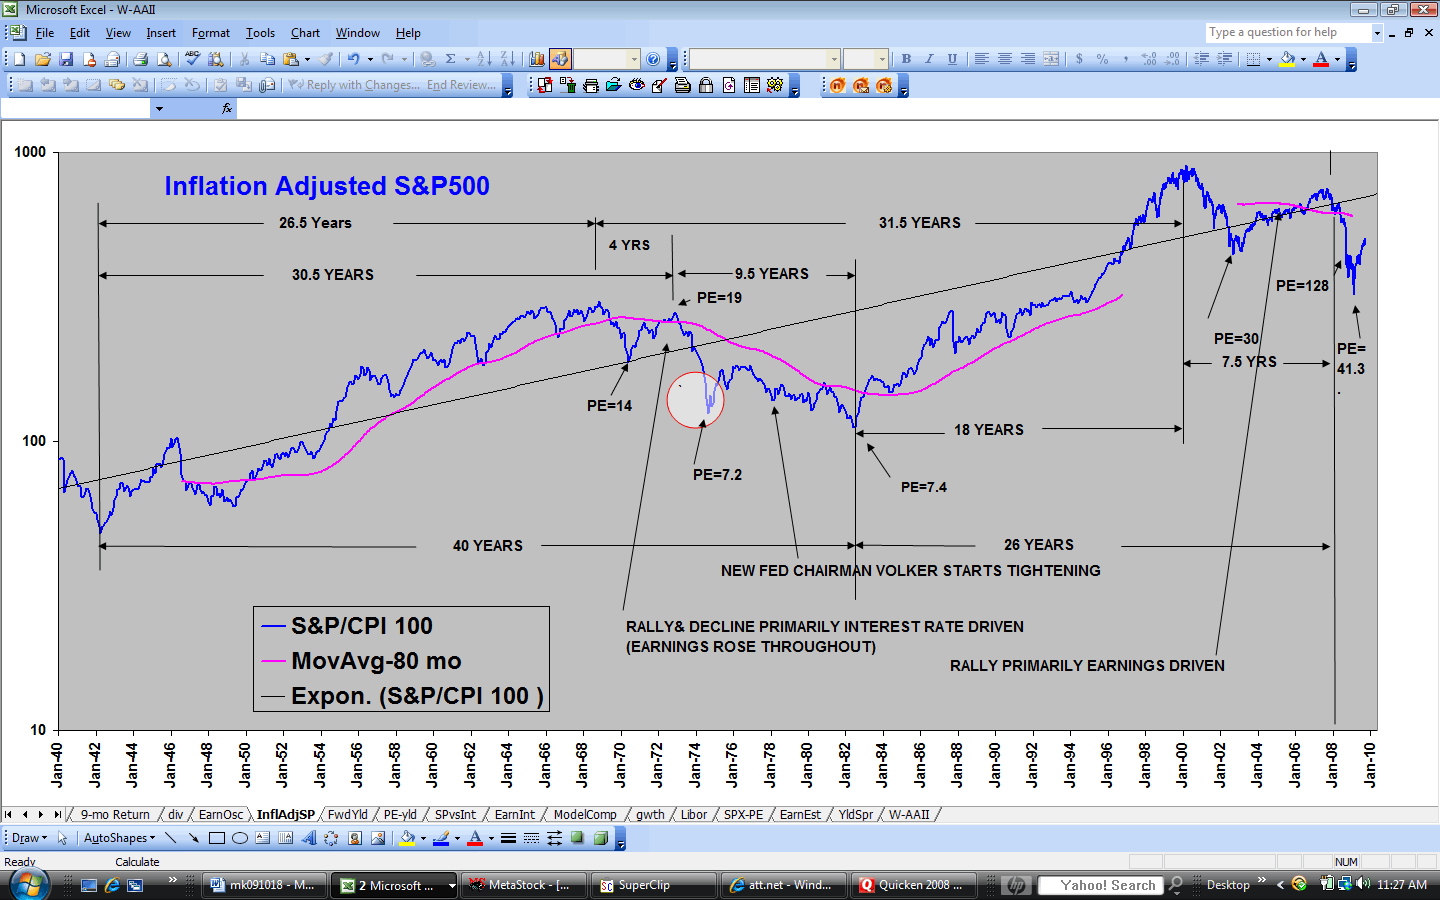
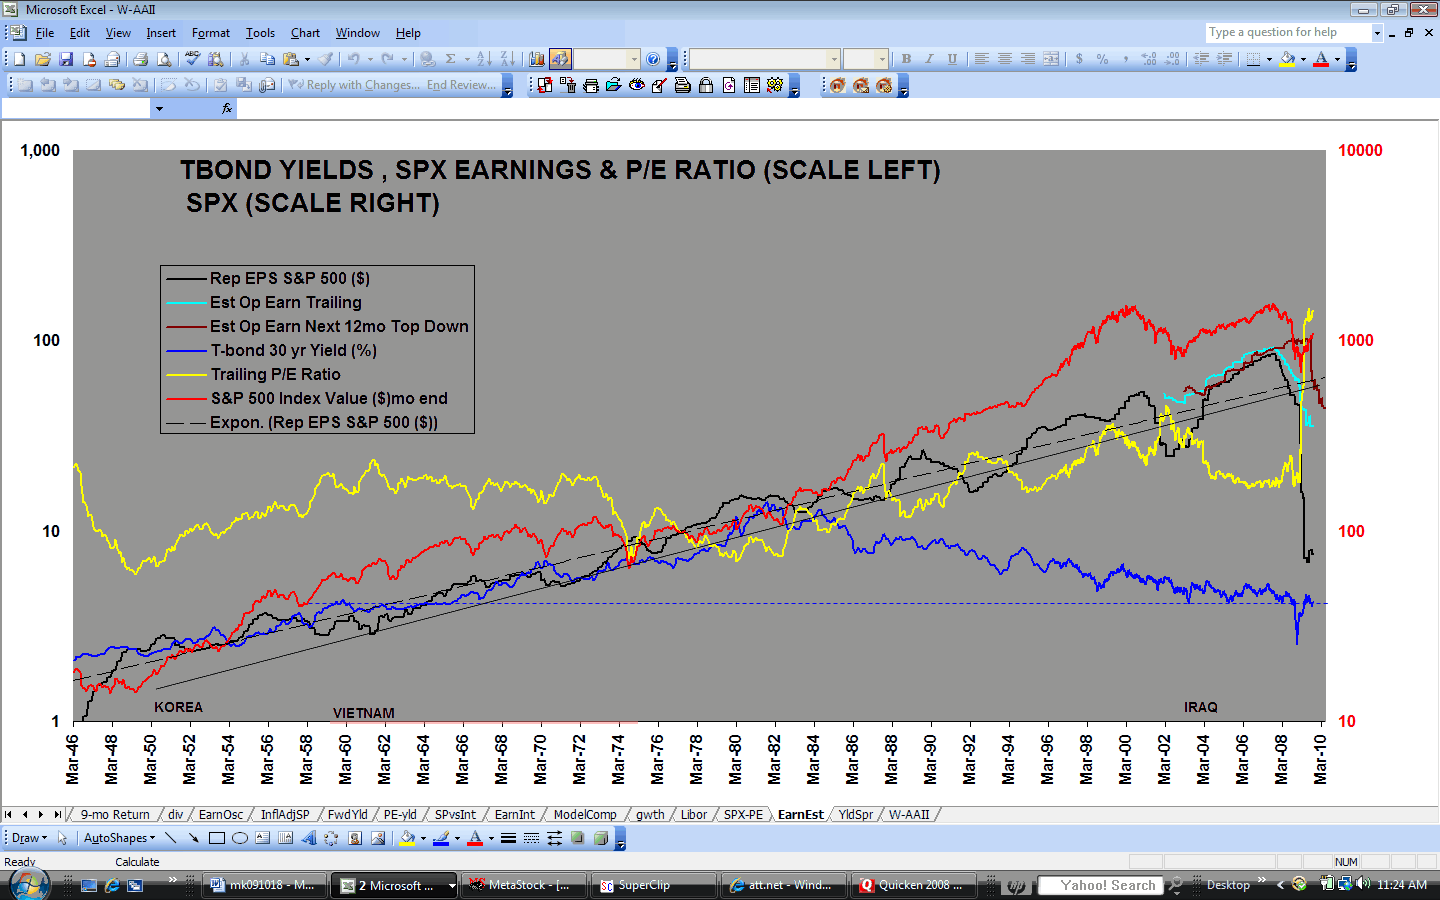
The 45.3% drop in market capitalization during the 2nd Bush bear market of the last 8 years already nearly matches the 48.7% during the first one (http://www.geocities.com/petegersb/TotalMarket.GIF ). Barring a strong rally into January, Bush remains on track to establish the worst stock market record since Herbert Hoover (http://www.geocities.com/petegersb/PoliticalRecord.GIF ). Only the 1970 and 1974 bear markets during the Nixon/Ford administration have come close in modern history. So much for deregulation and tax cuts as an economic policy. The inflation adjusted drop in the SPX (http://www.geocities.com/petegersb/SPX-InflationAdjusted.GIF ) now looks very much like the early stages of that Nixon/Ford period, but this time the bond market is betting on deflation (http://www.geocities.com/petegersb/CPI.GIF ) rather than the rampant inflation of that period. Neither is good for stocks. Earnings drop with deflation; the earnings multiple drops with inflation. Earnings are now dropping steeply (http://www.geocities.com/petegersb/EarningsEstimates.GIF ) and will probably drop much more as the consumer is forced to pull back.
The market may be close to a 9-month cycle low, but there is no reason to believe that the 4-year cycle bottom is arriving 2 years early or 2 years late. It’s scheduled for late 2010 and we likely will experience much more economic pain between now and then. The charts strongly suggest a secular, not cyclical, bear market. The S&P ( http://www.geocities.com/petegersb/Overview-long.GIF) has plunged well below the 13-year simple moving average that contained the 2000-2002 bear market, and the 1550 level in 2000 and 2007 constitutes a huge double top. But certainly we can expect some good bear market rallies between now and the 4-year bottom in 2010. While there are no indications that Friday produced a successful test of the early October lows, the extreme oversold readings on most of the indicators suggest such a rally could arrive at any time. While it’s a little early for a nominal bottom in most of the cycles, all of the cycles are now within the time window for a bottom. I’ve already addressed the 4-year cycle (http://www.geocities.com/petegersb/4YearCycle.GIF ), so let’s look at the shorter cycles to try and discern when the next bear-market rally will begin:
9-month Cycle: Depending upon whether the last cycle bottomed in January or in March, this cycle is now either 9 months or 7 months old. Almost always, its duration is between 6 and 12 months and all of its indicators are now deeply oversold (http://www.geocities.com/petegersb/Overview-med.GIF , http://www.geocities.com/petegersb/Overview-long.GIF, http://www.geocities.com/petegersb/A-Dsummation-NYSE.GIF , http://www.geocities.com/petegersb/A-Dsummation-OTC.GIF). It’s clearly in position for a bottom.
20-wk Cycle: This cycle clearly last bottomed in mid July, so it’s now 15 weeks old – just inside the normal window of 14-27 weeks. It’s only moderately oversold, but the DStoc downturn from an extreme level on the weekly VIX and VXN (http://www.geocities.com/petegersb/VIX-weekly.GIF , http://www.geocities.com/petegersb/VXN-weekly.GIF ) suggest the 20-week cycle may have reached bottom.
10-wk Cycle: This one is not so clear. Some indicators suggest it bottomed after a normal life span in mid-September, but the daily VIX (http://www.geocities.com/petegersb/VIX.GIF) and VXN (http://www.geocities.com/petegersb/VXN.GIF) are more indicative of an Oct 10 bottom. All of the indicators are somewhat ambiguous. If it bottomed in September, it’s now five and a half weeks old – a little short of the normal 7-14 week window. Moreover, its DStoc turned down last week, suggesting it’s in a downtrend, and it’s far from oversold. Consequently, the odds favor a few more weeks of downtrend for this cycle – an outcome that would produce a nesting with the low of a more normal duration 20-wk cycle as well.
26-day cycle: This one looks very unfavorable. It clearly bottomed on October 10, and then had a sharp rally that lasted only a day and a half to an extreme left-translated peak (SPX (http://www.geocities.com/petegersb/SP500.GIF), NDX (http://www.geocities.com/petegersb/NDX.GIF), Russell small cap index (http://www.geocities.com/petegersb/Russell2000.GIF )). It’s only 10 days old and its DStoc has recently turned down from an overbought condition. Its condition strongly suggests about 3 more weeks on the downside, and a significant break below the October lows.
13-day cycle: This one looks almost ready to bottom. It’s also 10 days old and its DStoc is moderately oversold. It may have bottomed on the gap down opening on Friday morning, but further downside would produce a better fit to normal time cycles and produce a more normal bear-market oversold condition.
In summary, the most probable scenario going forward suggests at least one more 13-day cycle before all cycles up to and including the 9-month cycle reach bottom. The most likely date for such a nested low would appear to be November 26. At that time the 9-month cycle will be either 8 or 10 months old, the 20-wk cycle will be 18 weeks old, the 10-week cycle will likely be 8.5 weeks old, and the 26 day cycle will be 26 days old.
I can easily conjure up a more optimistic and a more pessimistic scenario for the intermediate term. The October 10 low could have been a late 10-week cycle low and an early 20-wk low. If so, the usual year-end rally has begun, but I doubt it. It’s very unlikely that such a significant bottom would have produced such a brief 26-day cycle rally phase with such an extreme left-translated peak.
The more pessimistic scenario arises if the 20-week cycle goes full term or longer. Unless they bottom sooner, by early December the 20-week cycle will have reached its nominal 21-wk life span and the 10-wk cycle would be only slightly over-aged. But the 26-day cycle would probably be only middle-aged. So a mid-or late December bottom would then appear more likely. I tend to dismiss that likelihood mainly because the speed of this decline should produce panic capitulation selling well before that time.
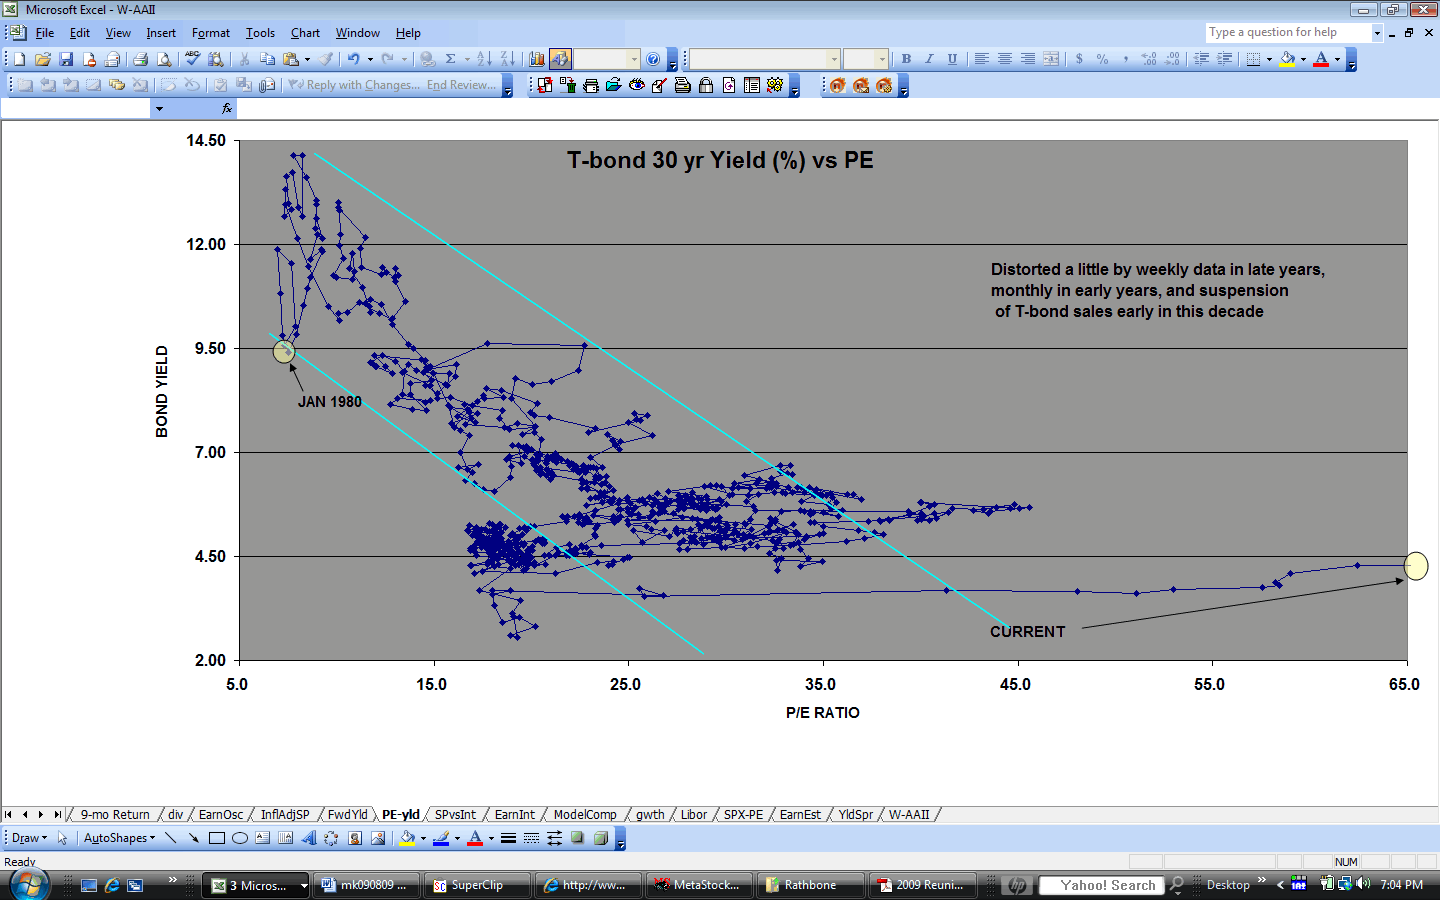
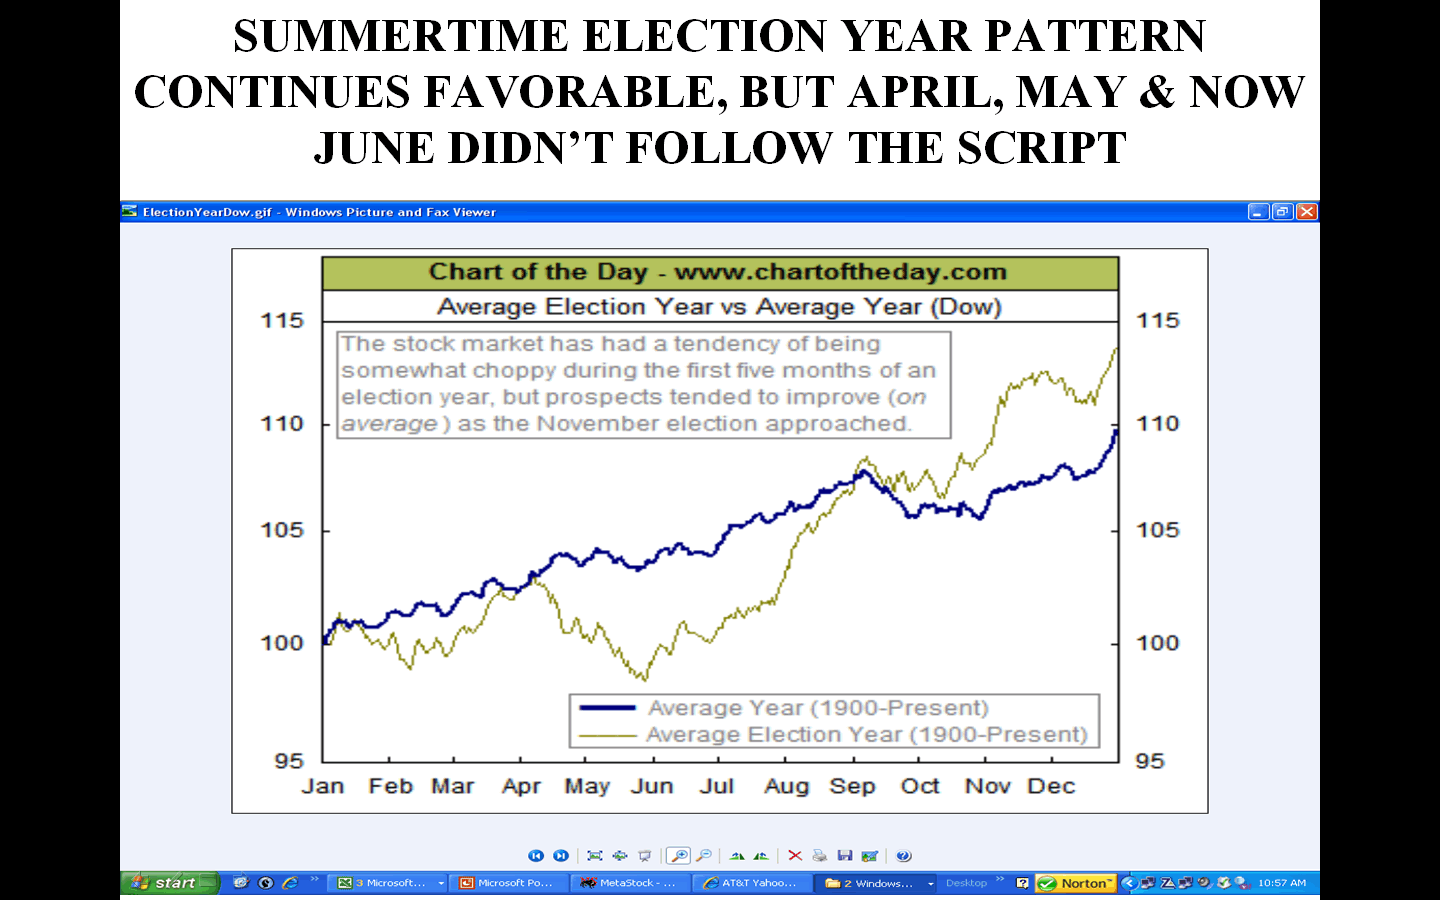
The trailing P/E has dropped only to 17.1, still above the historical average. Perhaps that’s justified by the low interest rates (http://www.geocities.com/petegersb/PEvsBond.GIF ), but both bear and bull markets tend to overshoot fair value. The danger here is that overly optimistic earnings projections (http://www.geocities.com/petegersb/EarningsEstimates.GIF ) will continue to disappoint as they have in recent quarters. Nevertheless, a P/E in the mid-teens helps provide some rationale for optimism during the next bear market rally. By the expected Thanksgiving low, 3rd quarter earning disappointments will be history and the perma-bulls can again don their rose colored glasses for the 4th quarter. The election uncertainties will also be history, and the calendar is already favorable for the intermediate term (http://www.geocities.com/petegersb/ElectionYearPattern.GIF ). It’s dangerous to play bear-market rallies, but the next one may be very worthwhile. We can expect a 9-month cycle rally to reach at least the 10-week moving average. Depending on the speed of the rally, it should stand between 1000 and 1100 on the SPX (http://www.geocities.com/petegersb/SP500.GIF ), and a minimal 23.6% Fibonacci retracement of the year-long decline stands at 1010. A more normal 38.2% Fibonacci retracement stands at 1120. So catching a reasonable portion of a likely 15% to 28% rally during the favorable season could be quite rewarding.
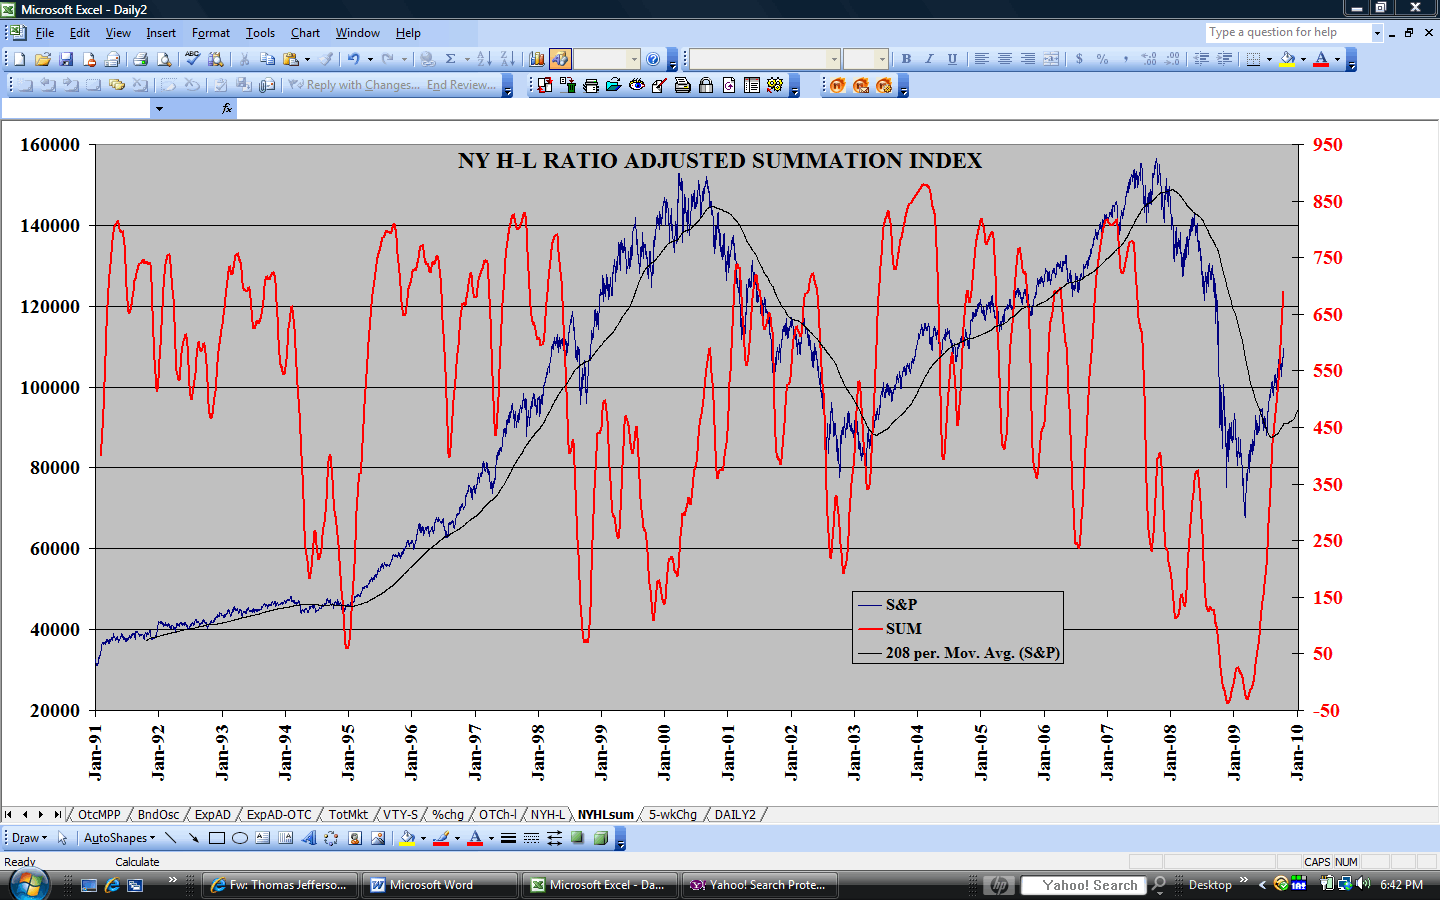
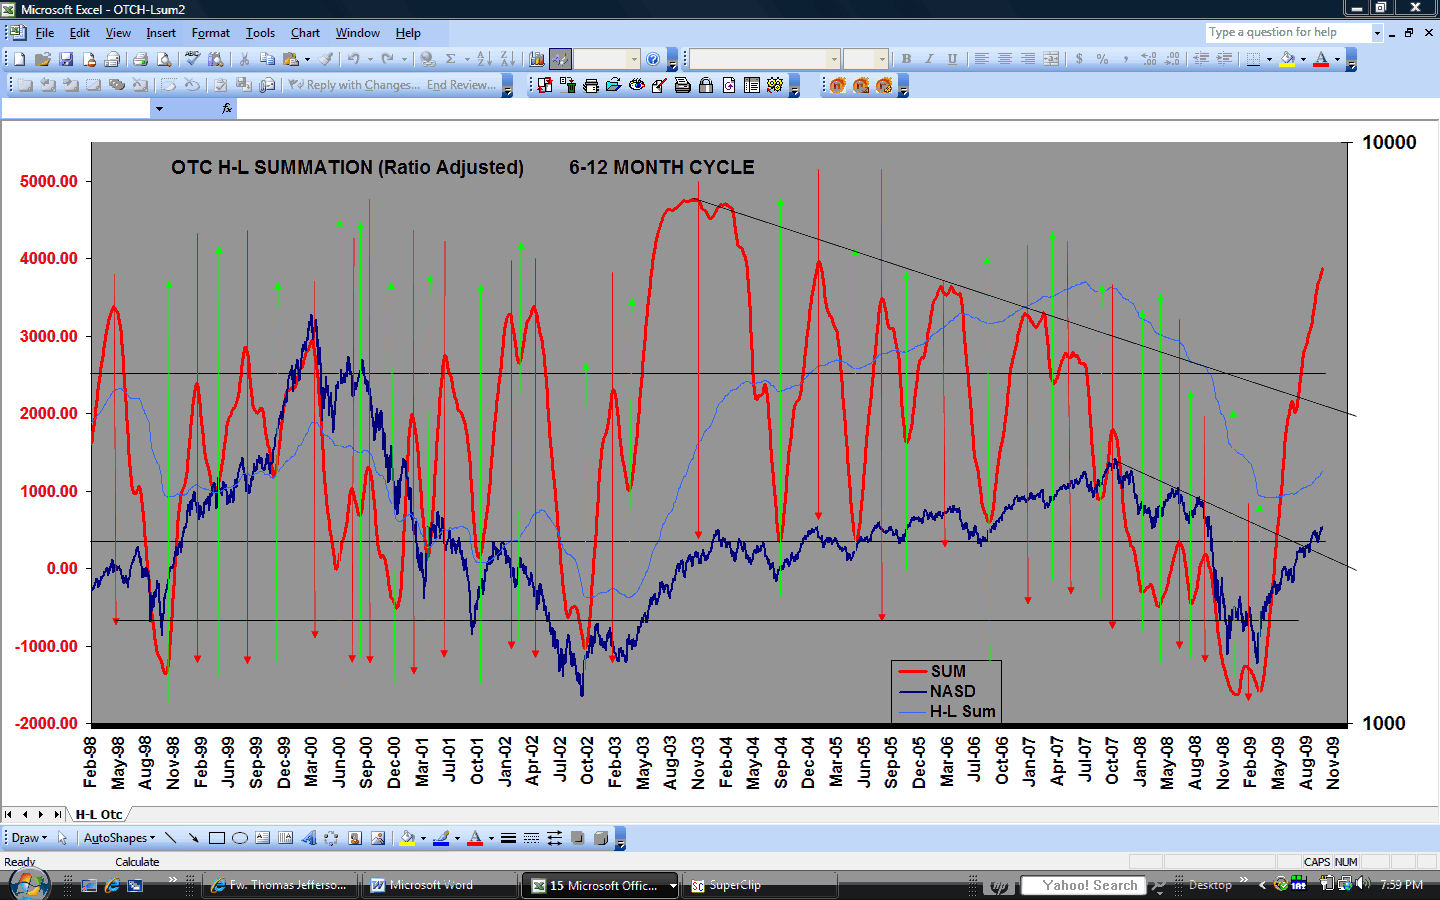
Breadth figures reached historical extremes on October 10 (http://www.geocities.com/petegersb/A-Dsummation-NYSE.GIF , http://www.geocities.com/petegersb/A-Dsummation-OTC.GIF , http://www.geocities.com/petegersb/H-Lsummation-NYSE.GIF , http://www.geocities.com/petegersb/H-Lsummation-OTC.GIF ). Almost all of the issues traded on the NYSE and about half of those on the Nasdaq established new one-year lows. That’s 2-3 times the normal level at major bottoms. With no historical precedent, it’s difficult to draw a conclusion from the data. Does it demonstrate capitulation (the foundation for subsequent bull markets) or does it usher in a new depression? All we know for sure is that these indicators have not yet turned up, so they dictate a wait and see approach.
Similarly, while both advisory services (http://www.geocities.com/petegersb/InvestorsIntelligence.GIF ) and AAII members (http://www.geocities.com/petegersb/AAIIsentiment.GIF ) remain very pessimistic, the continuing trend toward greater pessimism (http://www.geocities.com/petegersb/SurveysCombined.GIF ) is still unfavorable for the market.
Treasury yields (http://www.geocities.com/petegersb/TreasuryYield-10yr.GIF continued to oscillate around the 10-wk and 9-month moving averages, and were little changed over the last month. There is no indication that the trading range in effect over the last year is likely to be violated any time soon. But the discrepancy during the last month between the performance of conventional Treasury bonds (http://www.geocities.com/petegersb/Treasury-20yr.GIF ) and Inflation Protected Treasuries (http://www.geocities.com/petegersb/TIPs.GIF) has been remarkable. The TIPS have plunged as bond investors conclude that plunging commodity prices will produce deflation in the CPI (http://www.geocities.com/petegersb/CPI.GIF ). Incredibly, the 5-year TIPS now yields more than the conventional 5-year treasury. That’s justified only if the CPI deflates over that period. If we have deflation during the next 5 years despite the record fiscal and monetary stimulus during last few years and even greater stimulus now in the works, this economy must be in very big trouble. Corporate bonds (http://www.geocities.com/petegersb/CorporateBonds.GIF) established at least a short-term bottom along with stocks on 10/10, but so far they have held on to the subsequent rally gains much better than stocks have.
The plunge in Crude oil (http://www.geocities.com/petegersb/CrudeOil.GIF ) has been dramatic and totally unexpected by me. A few percentage points reduction in consumption has been accompanied by a 56% price decline in a 3 month period. It demonstrates once again that the best cure for a high price is a high price that discourages demand and encourages supply. Unfortunately, the rapid descent is sure to aggravate the world’s long-term energy problems. It will discourage development and implementation of alternatives to oil and encourage drivers to keep their hummers. But in the short term cheap energy will help stimulate economic recovery. In the long term, more expensive energy is probably still a good bet, and the plunge in oil probably will soon provide an attractive buying opportunity. All cycles except the 13-day cycle are oversold.
Natural gas (http://www.geocities.com/petegersb/NaturalGas.GIF ) also has dropped a little over 50% from its July peak. The longer cycles are deeply oversold, but the short cycles likely will continue to exert downward pressure for a couple more weeks.
Energy stocks (http://www.geocities.com/petegersb/EnergySPDR.GIF) have dropped roughly in line with the underlying commodities, but unlike the commodities, have held above their October 10 low. The intermediate composite has turned up from a deeply oversold condition, but the short-term composite suggests further downside.
I also blew the call on the dollar (http://www.geocities.com/petegersb/Dollar.GIF). It has surged as oil plunged. With fewer dollars being sent overseas to purchase oil and other goods, there are fewer dollars that must be recycled, so that makes sense. Most of the cycles are overbought, so a correction can be expected soon, but the long-term downtrend has been decisively broken. The dollar strength will help suppress inflation, but it will hinder economic recovery in the short term.
When you
blow the call on oil and the dollar, it’s inevitable that you also blow it on
Gold (http://www.geocities.com/petegersb/GoldBullion.GIF) as I did. Gold
hasn’t fallen as much as oil, but 35% is still pretty nasty. Both short and
intermediate composites are trending downward, so we can expect more decline before reaching bottom. Gold Stocks (http://www.geocities.com/petegersb/GoldStocks.GIF
) performed even worse than oil stocks. They are down 65% since July. Both intermediate
and short-term composites are deeply oversold, but the short term composite
turned up on Friday. If you are going to try to catch a falling knife, this
looks like as good a prospect as any.