5/4/08
Who ya gonna believe: Larry Kudlow (a CNBC entertainer masquerading as an economist), who asserts the US economy won’t enter a deep, dark recession, or Warren Buffet who expects a protracted downturn? Kudlow was still proclaiming a Goldilocks economy well beyond the market top, and only recently conceded that it was weakening. Last week’s government data inspired him to assert that Goldilocks is back. If you haven’t yet formed an opinion, that should give you a hint at the right answer. So should John Mauldin’s latest letter, which casts a good deal of suspicion on most of last week’s economic numbers (http://www.2000wave.com/index.asp). Specifically, he makes a convincing case that both the GDP and jobs numbers released last week are likely to be revised substantially lower when the economists in the Department of Commerce correct the erroneously optimistic assumptions used in modifying their raw data. Aside from their history of favorable distortions early in a recession, you would have thought that the more obvious nonsense produced by the birth-death model that they use to adjust the employment data would have made them reluctant to publish the April data. According to that model the financial sector produced 8000 new jobs in April and the construction sector added 45,000. So much for the credibility of a model that adjusted the raw data from a loss of 287,000 jobs to a loss of only 20,000 jobs.
The GDP data is equally suspect. In order come up with a figure of 0.6% growth in the 1st quarter, BEA assumed an inflation rate of only 2.6% to adjust the nominal GDP increase of 3.2% (annualized) to the 0.6% number for real GDP. Even the CPI figure published by its sister agency, the BLS, showed an increase of 4% over the last year and an increase of 1.66% (6.65% annualized) over that last 3 months, and we all know those figures are unrealistically low. Using one of those slightly more realistic figures for inflation would show a 1st quarter real GDP decline of –0.8% or – 3.45%. But since were talking production here, perhaps the producer price index increase during the last three months would produce a more accurate assessment of real GDP during the 1st quarter. The seasonally adjusted annual rate of price increase for finished goods was 10.2% for the last 3 months. That results in a real GDP decline 7% in the first quarter.
If those numbers don’t convince you that the economy is in recession, I have one more argument put forth by a recent skeptic. At last week’s WCCC meeting Sherman McClellan argued that historically the economy is not in recession until inventories start to rise, and they hadn’t yet done so. Now they have. During the first quarter, GDP was helped by an inventory buildup of 0.8%. That buildup will subtract from the GDP numbers when inventories are again drawn down. The inventory build up is also contributing to the declining earnings outlook (http://www.geocities.com/petegersb/EarnY-Y.GIF). Last week, Standard & Poors lowered its operating earnings estimate by another 31 cents for the 1st quarter, by another 62 cents for 2008, and by another 36 cents for 2009. Reported earnings estimates for the 1st quarter were lowered by another 48 cents. The P/E on trailing earnings has surged from a low of 16.9 to 21.8 during this 20-week cycle rally from the January low. Until the late 90’s bubble, 20+ P/E ratios were unlikely to produce good gains going forward (http://www.geocities.com/petegersb/PE_Yld.GIF ).
Bogus statistics notwithstanding, stock investors looked beyond the recession and bid stocks up to again delay the expected 10/20-wk cycle pullback within the rising 9-month cycle (http://www.geocities.com/petegersb/Overview-med.GIF) (http://www.geocities.com/petegersb/Overview-long.GIF). The 13-day cycle bottomed on Wednesday (at age 12 days) after a very small pullback earlier in the week (http://www.geocities.com/petegersb/SP500.GIF, http://www.geocities.com/petegersb/Russell2000.GIF, http://www.geocities.com/petegersb/NDX.GIF). The last of my long-term indicators (the 10-month advance-decline oscillators) joined the rest in signaling a 4-year cycle uptrend. However, I suspect the signal came very close to the time when the market will enter an intermediate pullback. The 15-week-old 20-week cycle is even more overbought than it was a week ago, and the DStocs on the weekly VIX and VXN (http://www.geocities.com/petegersb/VIX-weekly.GIF, http://www.geocities.com/petegersb/VXN-weekly.GIF) are correspondingly oversold. Similarly, the 7-week-old 10-week cycle is extremely overbought, and the DStocs on the daily VIX and VXN (http://www.geocities.com/petegersb/VIX.GIF, http://www.geocities.com/petegersb/VXN.GIF) are extremely oversold. They had issued a tentative sell signal on Wednesday (unconfirmed by the MACD), but quickly reversed course on Thursday. The SPX must now contend with resistance at the 50% retracement of the decline (The NDX has already moved through that level, but the small caps remain well below). That level may prove too formidable for the young 13-day cycle because the intermediate cycles are well beyond middle age. The aborted Microsoft-Yahoo merger announced this weekend probably won’t help on Monday.
Advisory services (http://www.geocities.com/petegersb/InvestorsIntelligence.GIF) and AAII members (http://www.geocities.com/petegersb/AAIIsentiment.GIF) continued to become more optimistic. AIII members are now nearly as optimistic as they were at last year’s market top. While that raises a red flag for the intermediate term, the moderate optimism of the less volatile advisory services suggests a good deal more upside potential in this young 9-month cycle.
Bonds attempted to begin the expected intermediate rally, but were knocked back late in the week by the bogus jobs data. Conventional T-bonds (http://www.geocities.com/petegersb/Treasury-20yr.GIF) made it all the way to resistance at the 10-week moving average, but then pulled back to recent support at the 9-mo moving average. TIPS (http://www.geocities.com/petegersb/TIPs.GIF) remain comfortably above their 9-month moving average, and are attempting to hold recent support at the 38% retracement level. The short-term composites suggest a little more decline before treasuries reach an intermediate bottom. I suspect they will continue to move opposite the stock market. Corporate bonds (http://www.geocities.com/petegersb/CorporateBonds.GIF) also took a big hit on Friday, but first they had a stronger rally than treasuries. Bond investors clearly believe that the worst of the default risk has passed. Friday’s low held the 9-month moving average and the close held the 10-week moving average, both of which are moving laterally. Conflicting cycles suggest corporate bonds will remain in a trading range for a while. Bond sentiment (http://www.geocities.com/petegersb/BondSentiment.GIF) continued to deteriorate, but it has a long way to go before reaching a level consistent with a significant bottom on bonds. It continues to suggest that the intermediate rally won’t amount to much, and that it will be followed by a continuation of the bond decline.
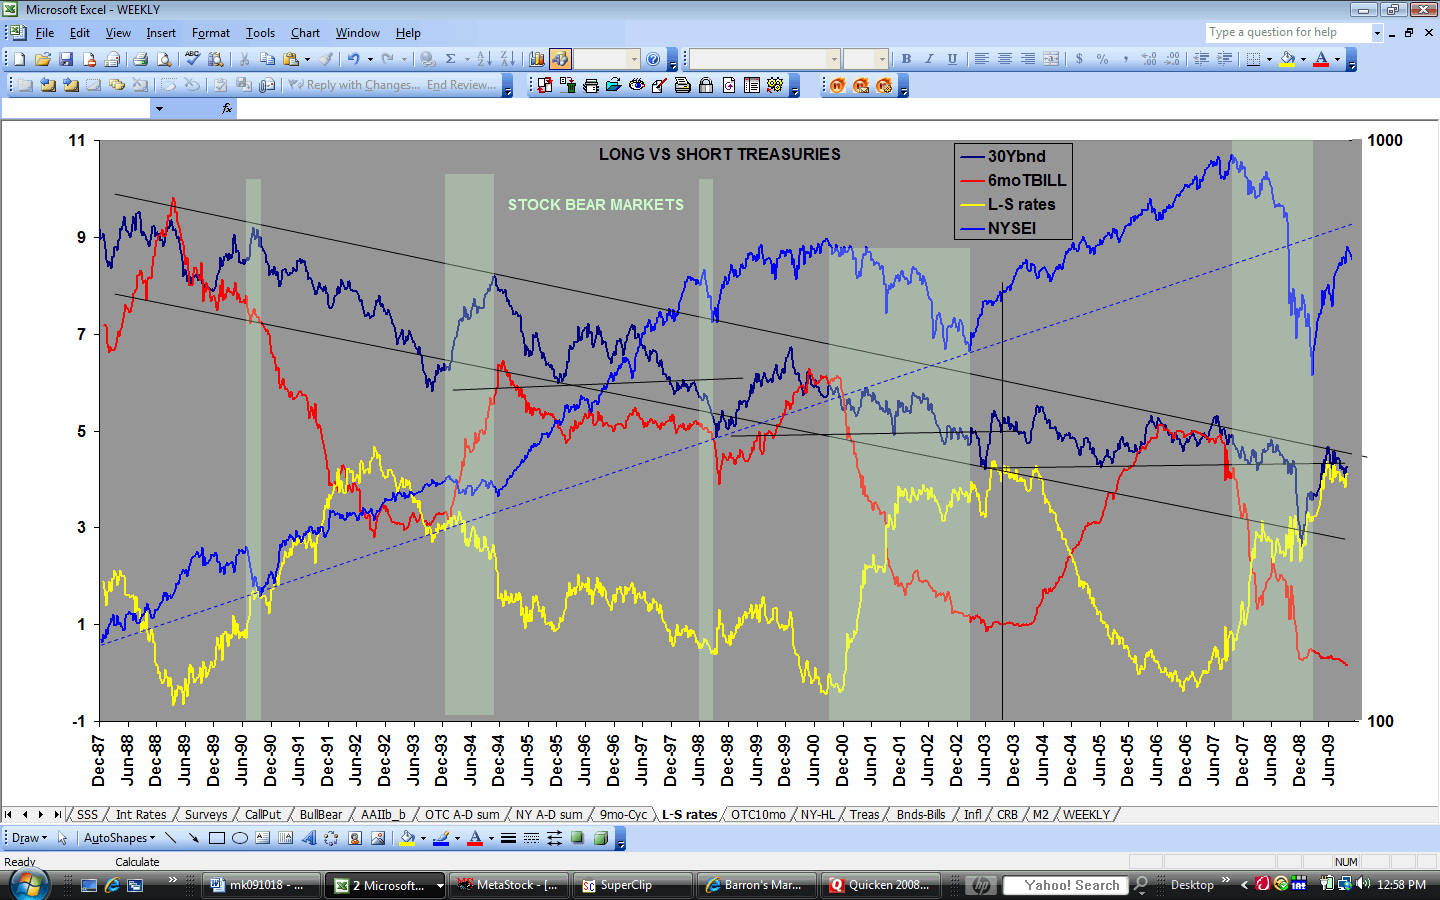
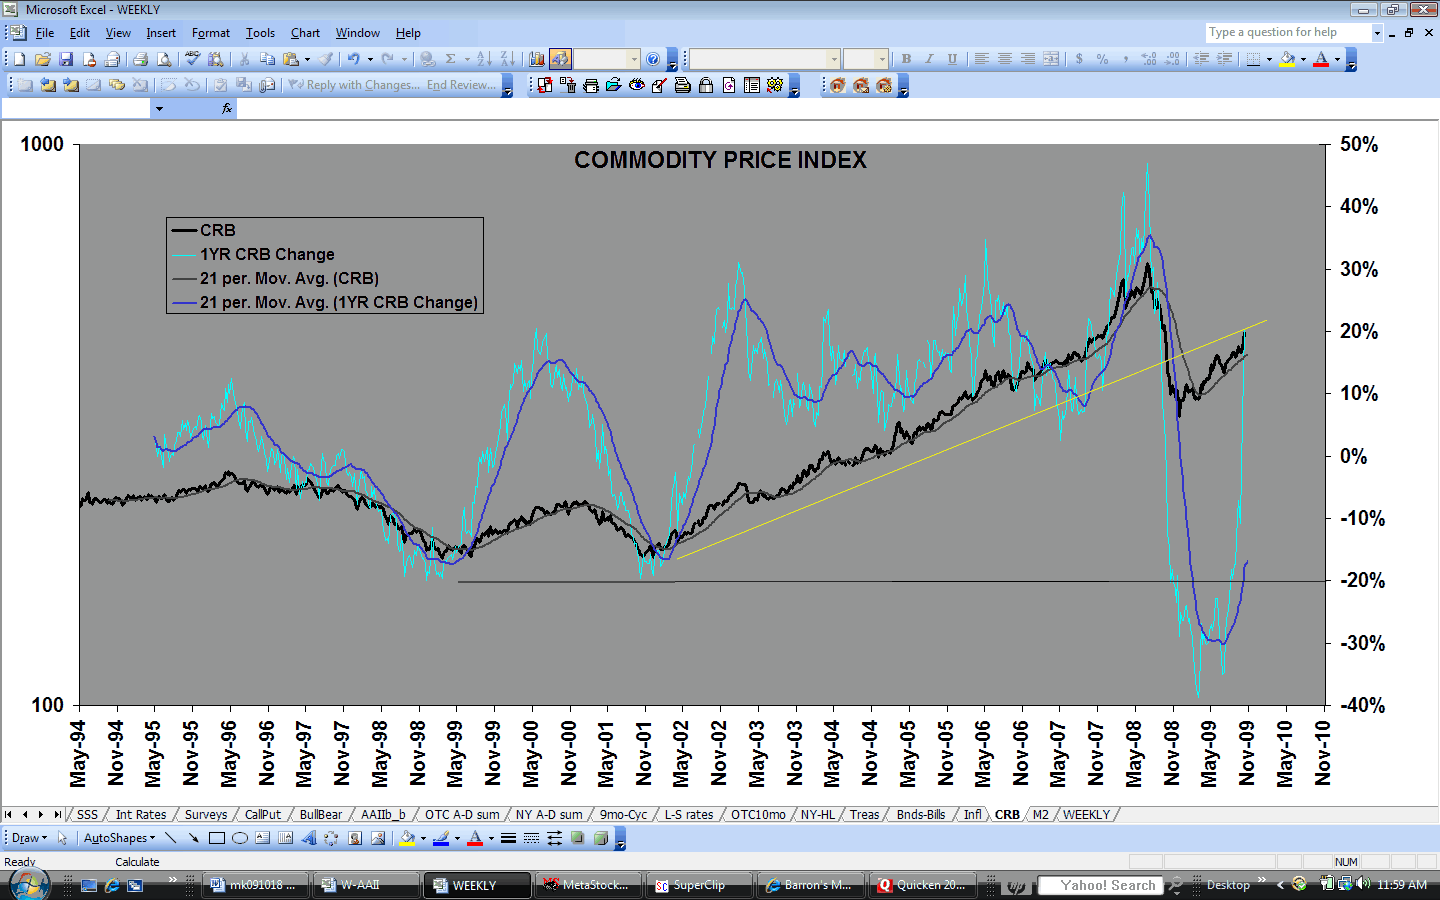
The rise of the yield curve (http://www.geocities.com/petegersb/Long-ShortYields.GIF) made no progress last week despite the Fed’s rate cut because T-bills rates did not follow Fed Funds rates – an indication that the Fed is now finished cutting. The further drop in the CRB index (http://www.geocities.com/petegersb/CRB.GIF) and in inflation expectations (http://www.geocities.com/petegersb/CPI.GIF) suggest further economic weakness that would support an intermediate bond rally.
The dollar (http://www.geocities.com/petegersb/Dollar.GIF) had a good week, breaking above the downtrending10-week moving average for the first time in three months. It’s somewhat overbought in the short-term, but in the intermediate term, it now looks like it has a chance to challenge the Nov-Jan lows from which it broke down to its March low.
Gold (http://www.geocities.com/petegersb/GoldBullion.GIF) broke below expected support at the 38% retracement of its
9-month cycle rally. It’s oversold short-term composite turned up, and the
oversold intermediate composite appears likely to follow when gold finds
support above the 50% retracement that matches the level of the 9-month moving
average. The 9-month cycle is a little
older than 8-months, the 20-wk cycle is 20 weeks old, and the 10-wk cycle is 12
weeks old. By any measure, it’s due for an intermediate rally. Gold stocks as represented by the XAU
(http://www.geocities.com/petegersb/GoldStocks.GIF) broke below the 9-month moving average, but found support
at the 50% retracement level. The short-term composite turned up and the
intermediate appears ready to follow. All of the cycles are oversold except the
13-day cycle, which has already turned up.
Crude oil (http://www.geocities.com/petegersb/CrudeOil.GIF) continued its short-term correction, leaving the intermediate uptrend intact. Fridays bounce looks like the beginning of a 13-day cycle rally that likely will test the recent high to produce an intermediate-term peak.
Natural
gas (http://www.geocities.com/petegersb/NaturalGas.GIF) also pulled back from an apparent intermediate peak. It
should find short-term support at the March highs or the rising 10-week moving
average. After better than a 100% gain since last August, it’s due for a
9-month cycle correction, but I suspect we’ll see a test of last week’s peak
first.
Energy
stocks (http://www.geocities.com/petegersb/EnergySPDR.GIF)
moved in the direction of the underlying
commodities, but the correction was a bit deeper. Only the materials sector was
weaker (http://stockcharts.com/charts/performance/SPSectors.html). The 10-week cycle has turned down, and the 20-week cycle
indicators look ready to follow. The 13-day cycle should rally this week and
produce a test of the recent high, but it’s unlikely to break that barrier
until the next 10-week cycle.
Housing: The homebuilder ETF (http://www.geocities.com/petegersb/Homebuilders.GIF) is holding just below the 38% retracement, but both short and intermediate composites have turned down. Before they reach bottom homebuilders are likely to be at or near new lows.