4/6/08
A 400-point Dow rally on Tuesday’s has become habitual for the market. But after three of these Tuesday surges during the last 4 weeks, most of the indexes remain lower than they were 6 weeks ago. In some respects, the April Fools Day rally was similar to the first two – it lacked any significant follow-through, and the pattern of lower highs remained unbroken on all of the indexes except the Nasdaq. But there were significant differences this time. This time there was no significant sell off during the remainder of the week, and for the first time this year, the averages (http://www.geocities.com/petegersb/SP500.GIF, http://www.geocities.com/petegersb/Russell2000.GIF, http://www.geocities.com/petegersb/NDX.GIF ) were able to move above their 10-week moving averages. That would be a normal stalling point for the 10-week cycle in a continuing bear market, so the ability to break through is a very positive indication. Another positive indication is the news backdrop. The first two of the big rallies were largely Fed-largesse inspired. But last week, the rally was preceded by an announcement that UBS would more than double its previous $18 billion write-off, and the fundamental news was bad for the remainder of the week. The Jobs reports on Thursday (new claims for unemployment exceeding 400,000) and Friday (a net loss of 80,000 jobs in March, downward revisions to 76,000 for both January and February, and 3.6% wage growth that represents a decline in purchasing power when more than offset by 4%+ CPI inflation) was probably the worst of the data. But the market was able to shrug it off. That ability to ignore bad economic news, suggests it had already been discounted in stock prices – despite coming in worse than forecasted. Soon we’ll find out if the coming poor earnings reports have also been discounted. Certainly Standard & Poors has already cut its estimates for the first quarter operating earnings substantially (http://www.geocities.com/petegersb/EarnY-Y.GIF), and has made minor downward revisions for the future as well. But, its estimate for 1st quarter reported earnings appears to be wildly optimistic – implying more than a doubling of 4th quarter earnings that were depressed by large write-offs. Can anyone seriously believe that write-offs weren’t similarly large in the first quarter? It also projects a 38% improvement in operating earnings from last year’s fourth quarter despite pretty clear evidence that the economy slowed substantially in the 1st quarter. Look for continued downward revisions of S&P 1st quarter earnings estimates as Standard and Poors gains the benefit of hindsight.
The uptrends in the short and intermediate composites support last week’s bullish developments. But the short-term composites are nearly overbought, and a number of short-term challenges are now being confronted. Prices have stalled at the 38% Fibonacci retracement of the Oct-Mar decline. At the same time the 11-week old 20-wk cycle has passed middle age, and it’s overbought on the Bressert DStoc (http://www.geocities.com/petegersb/Overview-med.GIF), suggesting that it’s no longer likely to be supportive. On the other hand, the DStocs on the weekly VIX and VXN (http://www.geocities.com/petegersb/VIX-weekly.GIF, http://www.geocities.com/petegersb/VXN-weekly.GIF) suggest more upside for the 20-week cycle. The daily VIX and VXN (http://www.geocities.com/petegersb/VIX.GIF, http://www.geocities.com/petegersb/VXN.GIF) have declined to their 10-wk moving averages; a level that has stopped all recent 10-week cycle advances. On the other hand, the 3-wk-old 10-wk cycle is young, and the DStocs on those same charts suggest it should have some upside left. The 13-day-old 26-day cycle is middle-aged and mildly overbought, and the 5-day-old 13-day cycle is also overbought, suggesting that these short cycles have a little upside left, but not much. Overall, it’s not a clear picture, but the burden of proof has shifted to the bears.
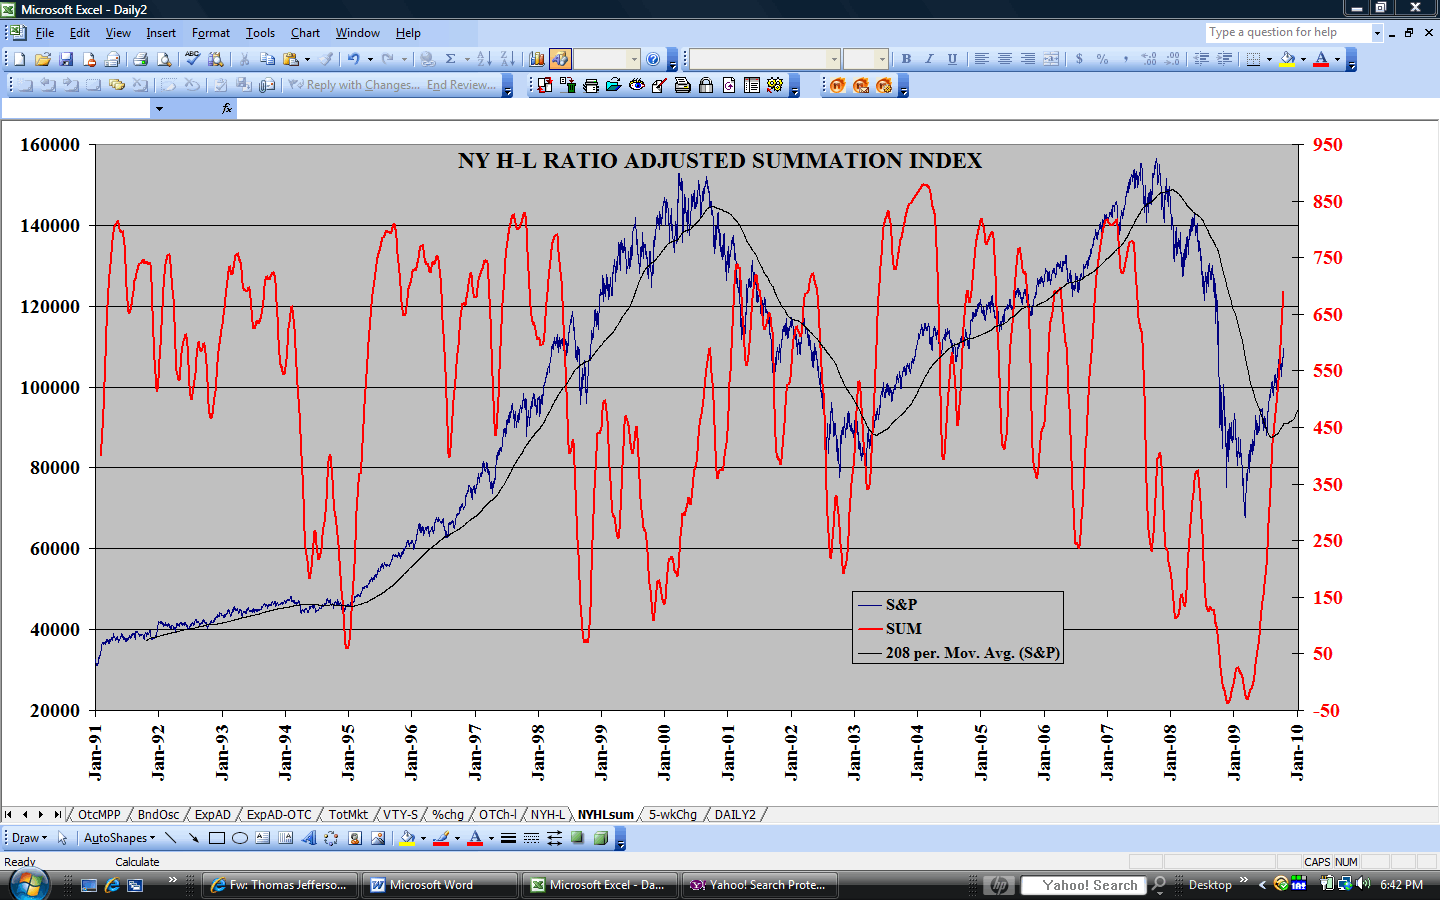
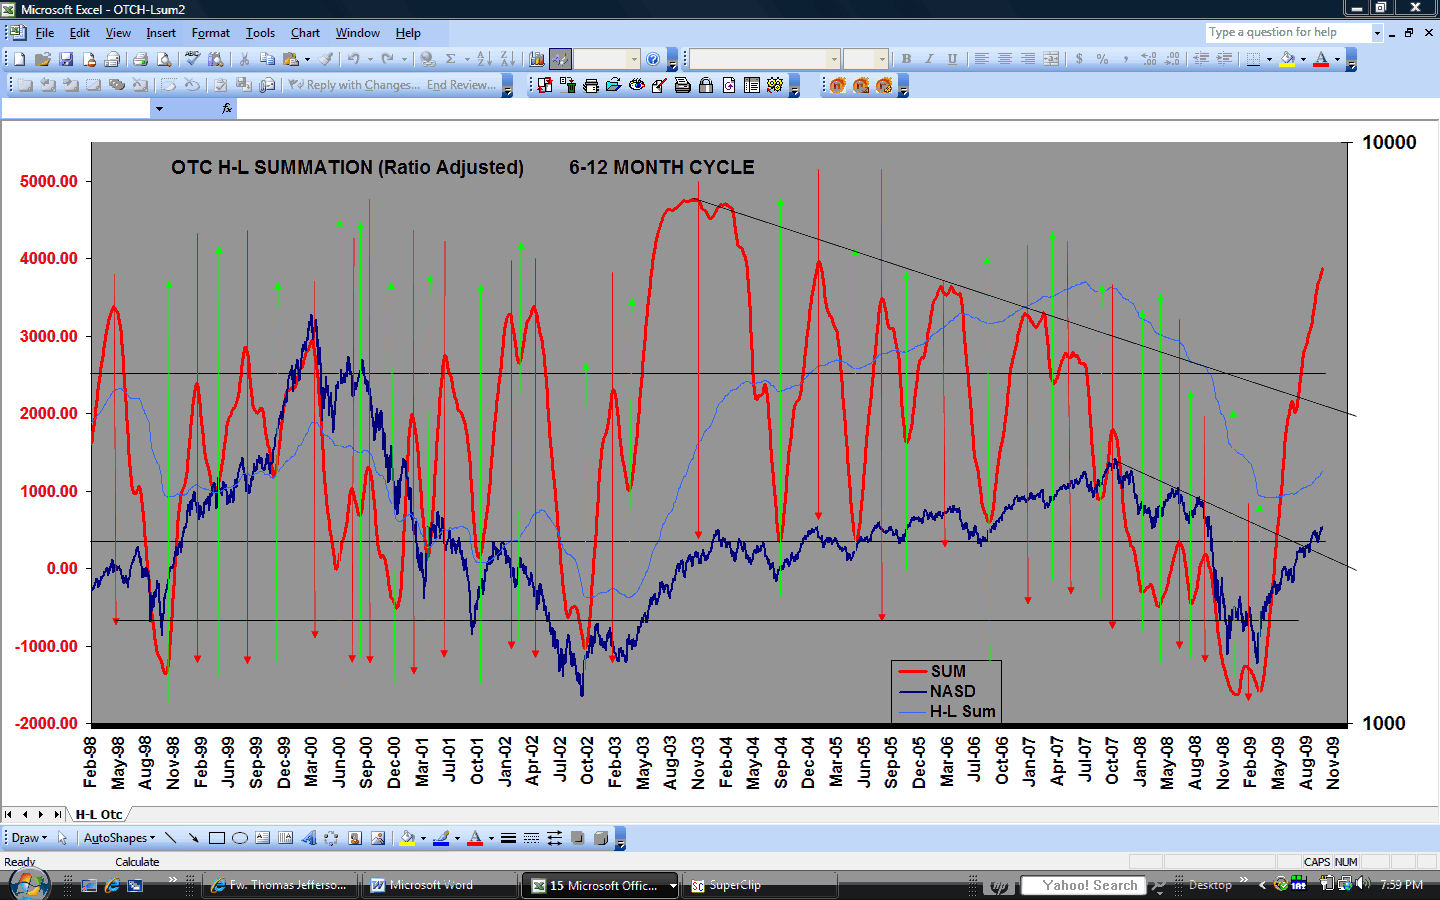
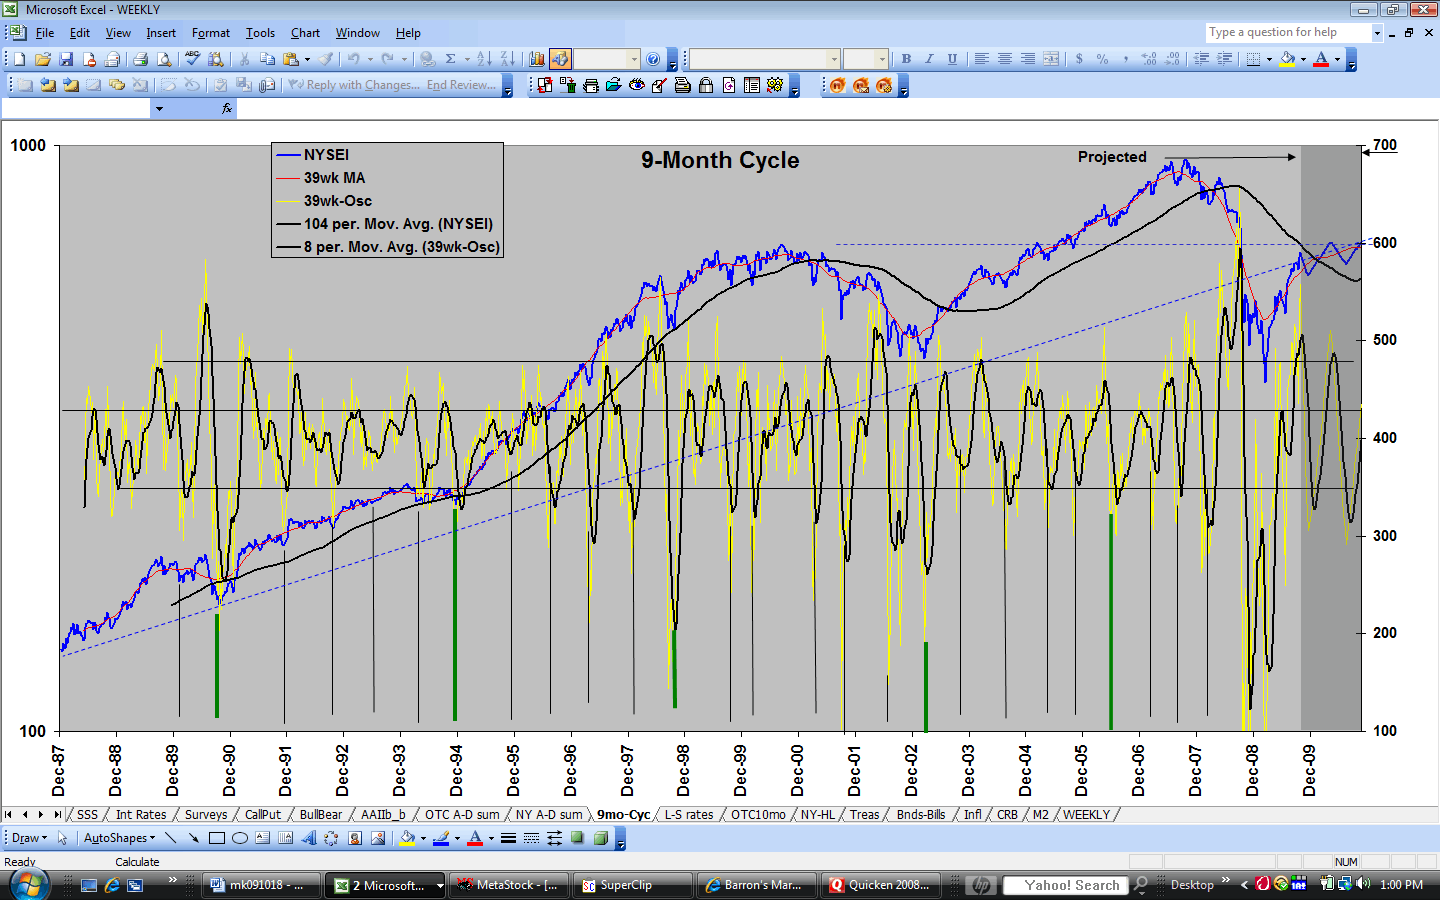
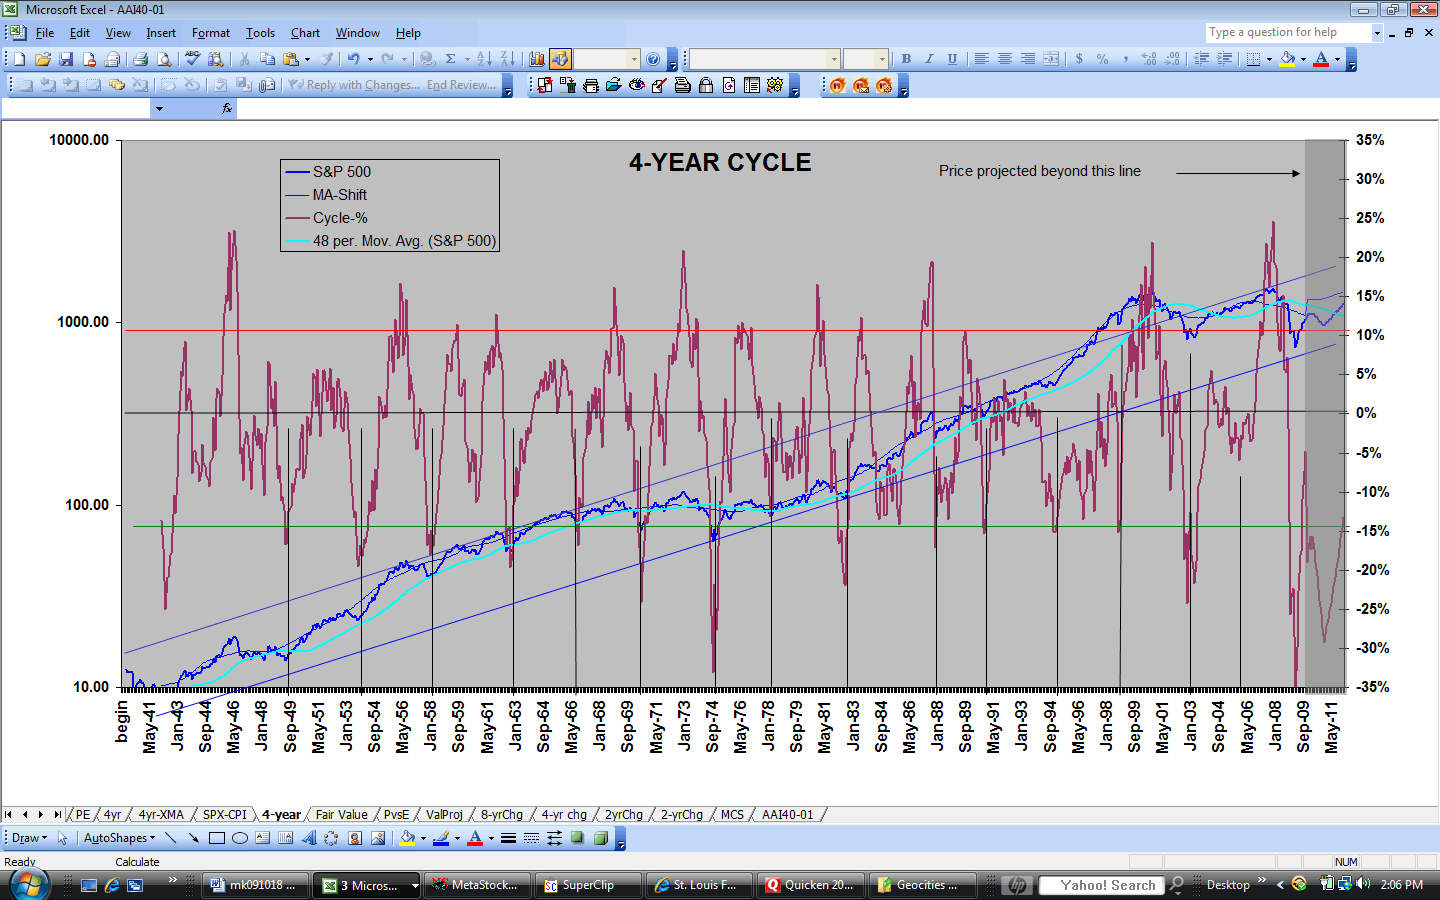
The overbought conditions of the 20-wk, 26-day and 13-day cycles and their middle ages shouldn’t prevent a continuation of a rally in a bull market, but could do so in a continuing bear market. In a bear market, the 13 and 26-day cycles should peak by the middle of this week (if they didn’t do so Friday), and the next 26-day cycle should peak below the current one. If the 9-month cycle has bottomed, as suggested by the Bressert DStoc on the weekly chart (http://www.geocities.com/petegersb/Overview-med.GIF) and by the majority of other indicators, including various breadth indicators (http://www.geocities.com/petegersb/A-Dsummation-NYSE.GIF, http://www.geocities.com/petegersb/A-Dsummation-OTC.GIF , http://www.geocities.com/petegersb/H-Lsummation-NYSE.GIF , http://www.geocities.com/petegersb/H-Lsummation-OTC.GIF ), then the current rally should carry beyond the 2/27 peak (26 days ago) before the 13 and 26-day cycles peak, and the 10-week cycle shouldn’t peak until the next 26-day cycle peaks at a still higher level. If the rally persists for another week, all of the 9-month cycle indicators will probably have turned up, including the most reliable (http://www.geocities.com/petegersb/Overview-long.GIF), which, unfortunately, also has the longest lag. However, if the resistance at the 38% Fibonacci retracement proves insurmountable on this attempt, then it will become incumbent upon the indexes to hold the March low at the next 26-day cycle bottom if the bull case is to be maintained. It’s scheduled for April 23 +/-6 days. If those lows do hold, the next hurdle will be to also hold them at the 10/20-week cycle low, which then should arrive near the end of May. That’s still my target date for the 9-month (http://www.geocities.com/petegersb/9moNYA.GIF) and 4-year cycle (http://www.geocities.com/petegersb/4YearCycle.GIF) lows as well. However, I still think those lows will be well below the March low, as illustrated on the chart projections.
Sentiment indicators now strongly support the bull case. Although the 5-wk moving average of advisory service sentiment (http://www.geocities.com/petegersb/InvestorsIntelligence.GIF) hasn’t yet turned up, optimism has risen during the last two weeks from the deepest pessimism since the 2002 low, and its likely to continue rising, considering last weeks market action. AAII optimism (http://www.geocities.com/petegersb/AAIIsentiment.GIF) declined a little last week, but its 5-week moving average is in an uptrend from its most pessimistic level since the 1990 bottom. Combined (http://www.geocities.com/petegersb/SurveysCombined.GIF), sentiment has turned up from the double bottom that I have been looking for. With the January - March possible double bottom coinciding with the deepest pessimism since the beginning of the late 90’s bull market, this survey data presents an unambiguous bullish picture for stocks.
With almost all of my intermediate-term indicators now bullish, but my cycle analysis suggesting that the market should have one more intermediate decline before the 9-month/4-yr bottom, I’m somewhat conflicted. I fear missing the best of the bull market if I am wrong about the cycles and don’t act on the intermediate indicators, but I also fear taking a beating for a couple of months if I don’t heed the warnings of the cycle analysis. I’ll let analysis paralysis persist for another week to see if the rally stalls at the current resistance levels, or if it punches through and provides an unambiguous bullish picture that demands reassessment of my cycle analysis.
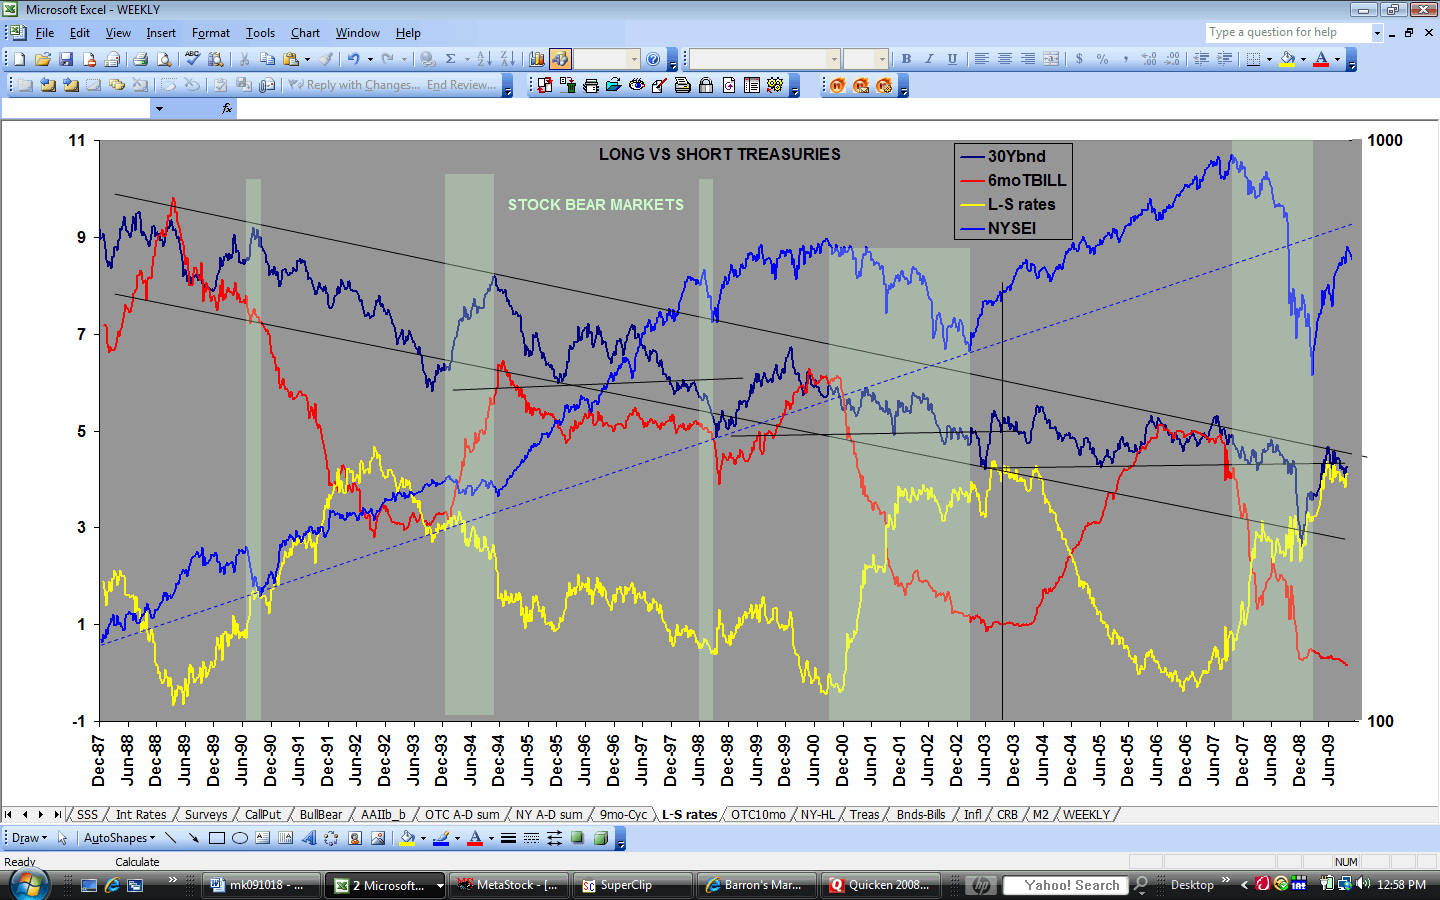
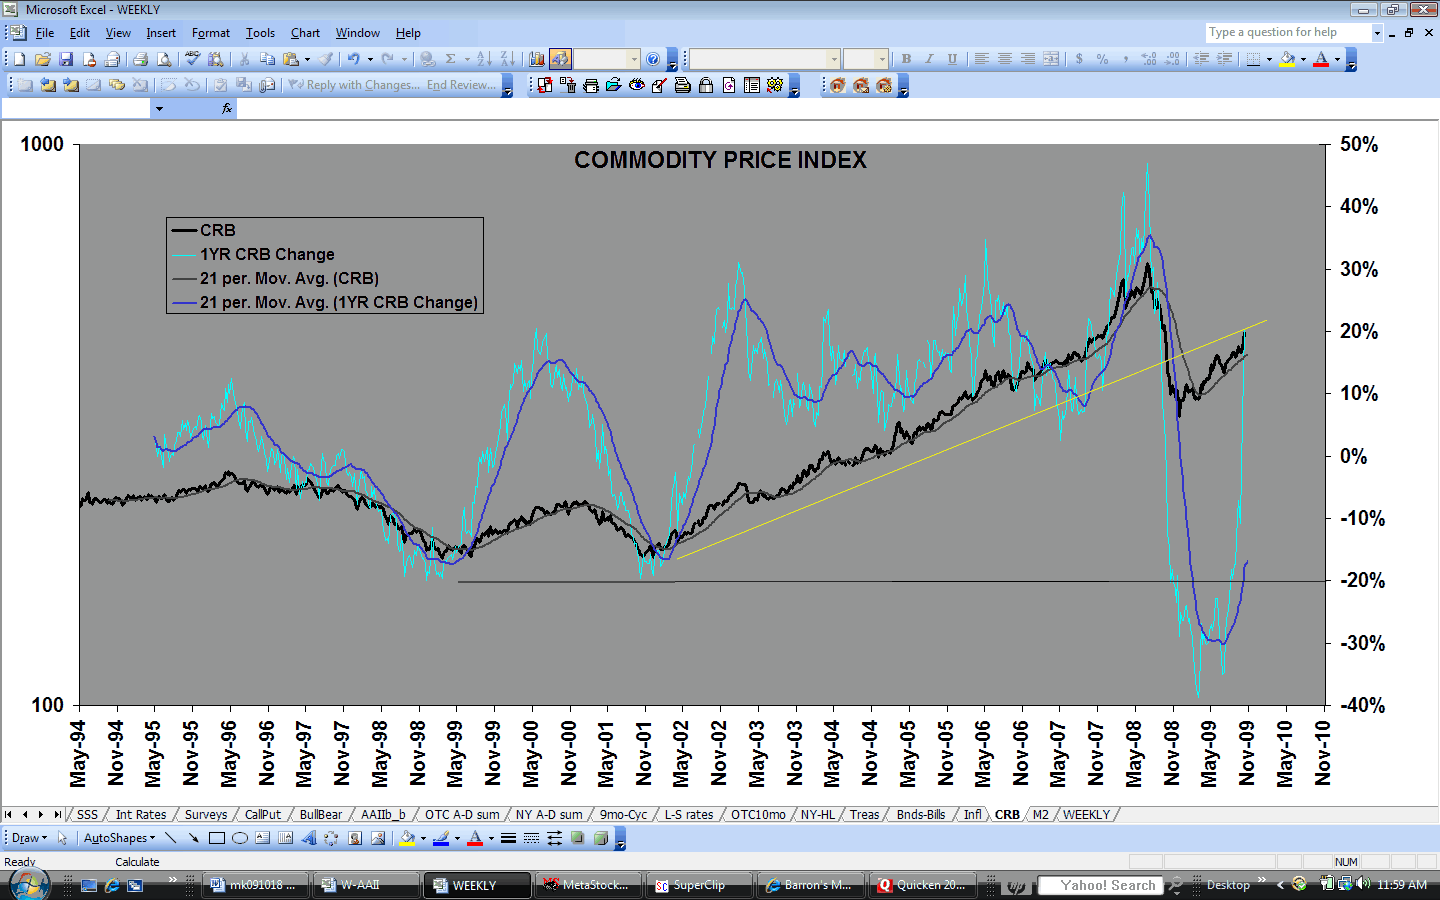
Bonds liked the lousy employment report, but the resulting pop only got conventional T-bonds (http://www.geocities.com/petegersb/Treasury-20yr.GIF) roughly even for the week. It looks like the beginning of a shorter-term rally within a 10-wk cycle downtrend that began on 3/20. Corporate bonds (http://www.geocities.com/petegersb/CorporateBonds.GIF) fared better, ending the week with a substantial gain, and without any sign of a top in its 4-wk-old 10-wk cycle. That’s another favorable sign for stocks. Not surprisingly, TIPS (http://www.geocities.com/petegersb/TIPs.GIF) fared poorly and lost ground for the week as inflation expectations (http://www.geocities.com/petegersb/CPI.GIF) fell in the face of mounting evidence of recession. However, TIPS held the 10-week moving average and are ripe for a 26-day cycle bottom. Bond sentiment (http://www.geocities.com/petegersb/BondSentiment.GIF) suggests yields (http://www.geocities.com/petegersb/TreasuryYield-10yr.GIF) will continue to rise. The recent trend of short-term yields rising more than long-term yields continued last week, and that has arrested the rise in the yield curve (http://www.geocities.com/petegersb/Long-ShortYields.GIF). So far the dip has been a minor one similar to the one experienced in late 2001, and not indicative of a top. Similar yield curve configurations in 1991 and 2001 produced radically different results for stocks, but similar results for bonds. In both cases bond yields rose for a few month and then resumed their decline. But in late1991 stocks were already over a year into a new bull market, whereas they were almost a year short of a bear market bottom in late 2001. The yield curve similarities to 2001 are more compelling, but the situation with respect to commodity inflation is far different now. In late 2001 the CRB index (http://www.geocities.com/petegersb/CRB.GIF) was near a bottom after having declined about 16% during the prior year and a half. Now it is in a 6-year uptrend that has tacked on 187% with little indication of a peak. That’s a bad difference, not a good one.
The dollar (http://www.geocities.com/petegersb/Dollar.GIF) continued its weak 20-week cycle rally on the strength of its April Fools Day bounce. However, the short-term composite turned down on Friday, as the second 13-day cycle of the first 26-day cycle of this intermediate rally turned down. The first 10-wk cycle within this 20-week cycle may have made a left-translated peak at the same time, but the DStoc has not yet indicated a downturn for that cycle. I remain confident that the rally won’t breach the downtrending 10-wk moving average, and that this 20-wk cycle will eventually produce new lows – perhaps even on this down leg of the short-term composite.
Gold (http://www.geocities.com/petegersb/GoldBullion.GIF) bounced off of its 38% Fibonacci retracement of the strong
Aug-Mar rally. Although the short-term composite turned up from an oversold
condition, it was a little early for a minimum duration 10-wk cycle low. I
suspect it was only a 26-day cycle bottom, and one more down leg will be
required before the 10-wk cycle bottoms. By then the 20-wk and 9-month cycles
will have gone full term and offer an attractive buying opportunity. It should
arrive in early May when the 10-wk cycle will be about 12 weeks old, the 20-wk
cycle will be about 20 weeks old, and the 9-month cycle will be 8.5 months old.
If the next short-term low successfully tests the $870 level, it will look like
a buy. If it continues to rise without such a retest, it will be a buy on an
upturn in the intermediate composite. Gold
stocks as represented by the XAU (http://www.geocities.com/petegersb/GoldStocks.GIF) held expected support (170) at the 9-month moving
average, and are now confronting resistance at the 10-wk moving average. The
overbought, 10-day-old 13-day cycle is ripe for a brief pullback, so that
resistance probably won’t be overcome this week. However, the longer cycles are
almost in position for a bottom, so one more successful test of the 9-month
moving average should provide a nice buying opportunity.
Crude oil (http://www.geocities.com/petegersb/CrudeOil.GIF) again bounced strongly off of the support at the 50%
retracement of the February-March rally that coincides with the November and
January peaks and the10-week moving average, as I last week concluded it should
if that area were again tested. While the short-term composite turned up as a
result, the intermediate composite did not, and it looks like the middle-aged,
downtrending 20-wk cycle should keep a lid on the short-term rally. A trading
range between the March highs and lows appears likely to persist for several
weeks.
Natural
gas (http://www.geocities.com/petegersb/NaturalGas.GIF)
reacted sharply after a very strong 13-day
cycle rally tested the March highs on Monday. Consequently, the 10-wk cycle
DStoc did not turn up as I had expected. It still appears that another test of
the support at the steeply rising 10-wk moving average, which now coincides
with a 38% Fibonacci retracement of the January-March rally, will produce a 10/20-wk
cycle bottom.
Energy
stocks (http://www.geocities.com/petegersb/EnergySPDR.GIF)
held the 9-month and 10-week moving averages
on Monday, and then rallied strongly back up to the late February 26-day cycle
peak. Despite the strong rally, Financials (http://www.geocities.com/petegersb/Financials.GIF)
displaced them in second place behind Materials (http://stockcharts.com/charts/performance/SPSectors.html).
The very overbought 13-day cycle is 11 days old, so it should halt the XLE
rally this week, but the rising longer cycles should prevent any serious
pullback. The intermediate composite has resumed its uptrend.
Housing: The homebuilder ETF (http://www.geocities.com/petegersb/Homebuilders.GIF) has stalled near its March peak. Its intermediate composite is overbought and its short-term composite is nearly overbought. It appears the downtrend is about ready to resume, but it may get another pop if Congress passes its latest folly – a $6 billion gift from the tax payers to homebuilders by letting them apply current losses to profits taxed 3 and 4 years ago. How enriching the builders, who contributed greatly to our current foreclosure problems, is supposed to help resolve the mess remains a mystery. It’s simply a buckling to political contribution blackmail. Previously one of the largest campaign contributors, builders have been withholding contributions until they get a handout in return. If you too find this outrageous, write your congressman.