Autonomous Monitoring
High Speed Ride Quality
Monitoring System

| Amtrak is now conveying revenue passengers at speeds up to 150 miles an hour on passenger equipment of various types and classes. From the Viewliner sleepers and the Superliner double decker cars of the Amtrak national system to the new high speed Acela Express trainsets, Amtrak must ensure the comfort and safety of the riding public. Some of the latest in this venture are the Autonomous ride quality monitoring systems (ARMS) installed in various equipment, primarily the Acela high speed equipment. |

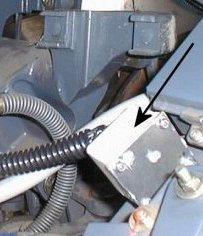
| A rugged enclosure houses an industrial computer and battery backup system. The antenna shown is mounted to a light metal bracket but is mounted directly to the carbody in most instances. Accelerometers are mounted in environment proof boxes and mounted in various set locations within coaches, locomotives, and their suspension trucks. They put a storable and repeatable number to "how big are the ripples in my coffee". |

| The antenna is a dual purpose unit for use with GPS satellite navigation systems and as a cellphone antenna. This enables the unit to know where it is at any given time and to call in to a central server with information about any exceptions encountered. The three little white blocks are simply to ensure the antenna stays put at 150 MPH. |

|
|

|
| The central processor unit is mounted in various places depending on the type of equipment tested. Here the box is mounted in the underfloor compartment of an Acela high speed trainset coach. The truck sensor is mounted on top of the truck frame as near above the center of the axle as possible. The carbody sensor is mounted near the centerline of the car over a truck and as close to floor level as possible. |
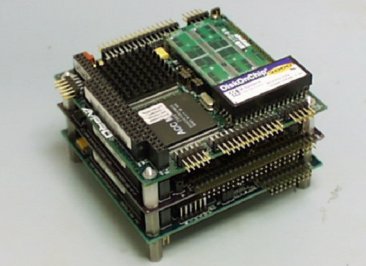
| The box houses a miniature computer shown, and all support hardware necessary, including cellular internet equipment, Analog to Digital converters, a GPS satellite receiver, and 110 volt power supply with battery backup. The unit uses QNX as an operating system because of it's real-time capabilities. |

| The system populates two databases as "hits" occur. One is located in one of Amtrak's Dataservers. The other is maintained by Ensco , the company that designed the system. From there the data can be viewed on any computer attached to the internet through a secure connection. |
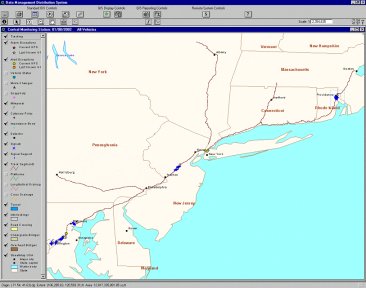
| The Ensco web interface allows inspection of the entire Northeast Corridor at a glance. Special "plugins" allow for complete manipulation of graphical based data. At any given time, all instrumented trains can be accounted for. The blue spots are "last position" reports of instrumentation. |


| The web view allows for great graphic manipulation down to placements of tracks and other structures. The database can also be queried for information on any defect or track structure with a single mouse click. The righthand picture shows a railroad interlocking in New England with a couple undergrade bridges. The tan dot between the bridges is a maintenance level "hit". The system is set up to provide "alerts" and "alarms". Alarms are considered defects and must be dealt with immediately. |
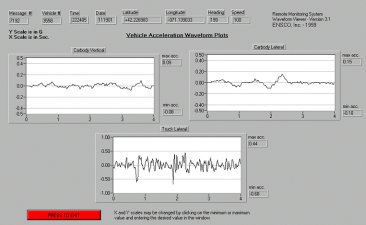
| When an alarm is received by the monitoring system, the raw data for a specified time is saved as well so analysts may review the waveform and verify that it indeed was from vehicle dynamics and not from external forces such as a "rock hit" jarring the sensor. This is easily evident to those used to seeing the signatures of specific defects. These waveforms are viewable through the web interface as well. |
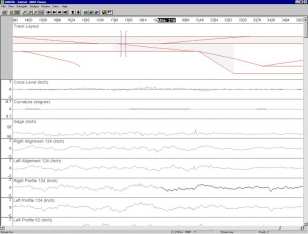
| Another way to access data from the ARMS units is in history within Amtrak's AMM system. This is an ongoing project gathering vast historical data and marrying it with total engineering asset management databasing capabilities. Each screen can be totally user defined to show electric traction hardware, communications and signalling circuitry, or track structures and assets in any combination as well as data gathered from the various test cars and wayside instrumentation sites. ARMS data can also be viewed and manipulated through AMM. A future page will be devoted to AMM exclusively and will be linked from here. |
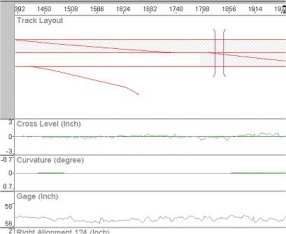
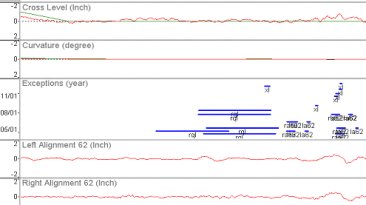
| AMM can show history fields for maintenance performed as well as defects found, and their level of severity for specific user defined periods. a number of geometry defect types are displayed here according to milepost and footages in conjunction with verious geometry channels. |
|