 |
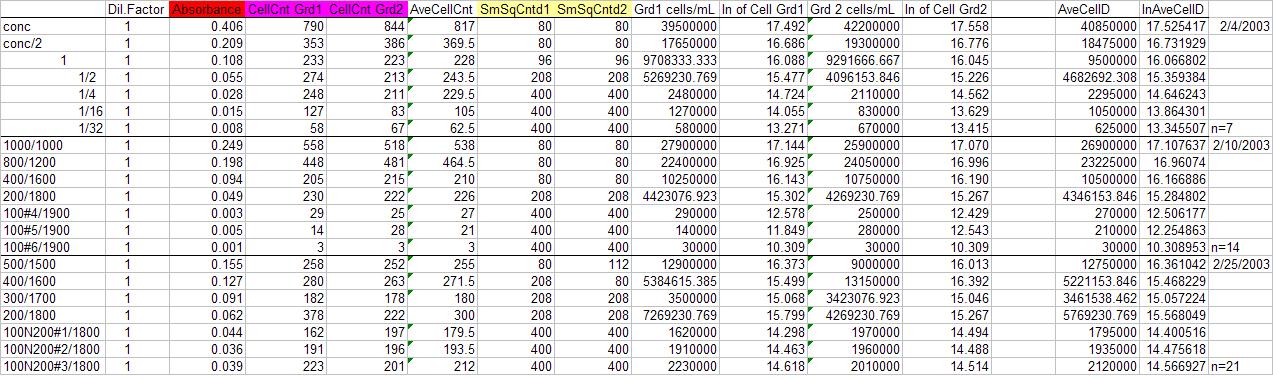
| What you are seeing below is the raw data from three various cell counts. The first column are notes to remind me which one that particular count is. The next column is there for the cell density equation. The third column is the Absorbance, taken with a spectrophotometer at 750nm. The cell counds are the actual random counts from the grid on the counting slide. The average count is just for simplication to keep track of the behavior of the numbers. The small squares counted are the number of small grids, see the pic below the raw data. The Cell density equation is the next figure. The natural log is taken of the cell density, in hopes to better simplify what is happening in the numbers. Then the average once again to simplify the numbers :) Quick fly through the spread sheet :) The graphs are just beautiful! So yes. This is what I do at work :) Click on something to actually be able to read it, had to save space.... |
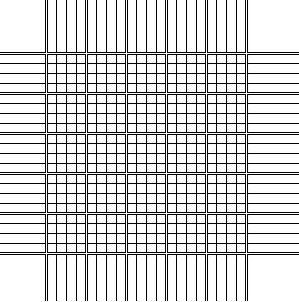
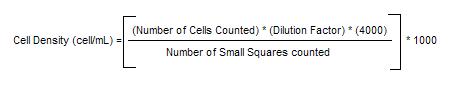
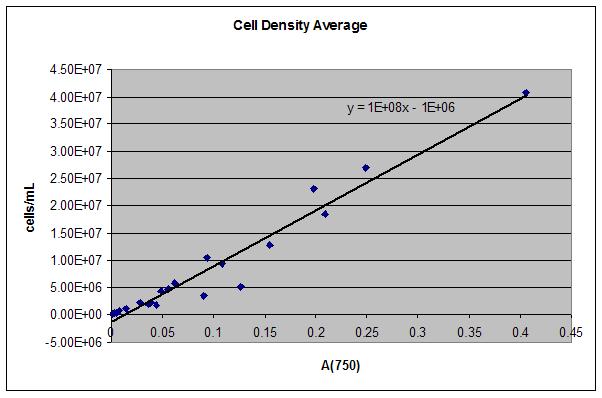
| This is pretty much what I see the entire time I'm counting. Just add some small green dots, and you've got it. Now the small squares are refering to those squares formed by the intersection of the two sets of lines. There are 400 in the entire center grid, so say if I counted 5 of the double lined squares, that would be 80 small squares. kinda gives you an idea. This is etched into the glass on a slide, and to sort of give you the idea of the size... The entire grid (all 5 by 5 of it) is 1mm squared. So each little grid of 4 is .2mm, and the algae are smaller than that.... Yea, I usually have quite the headache afterwards :) After counting, I run it all through this equation: |
 |
 |
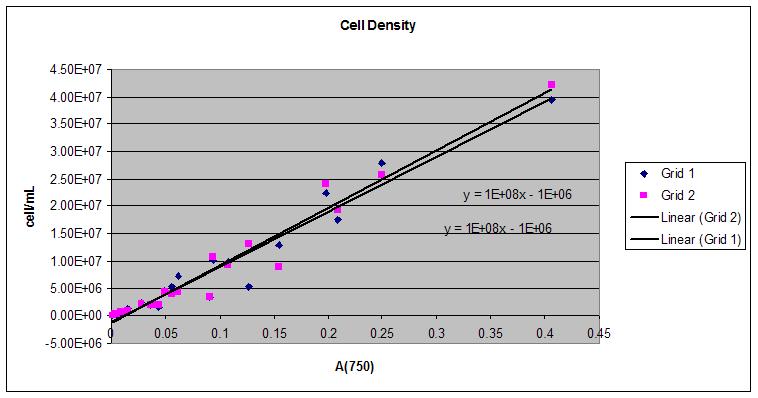
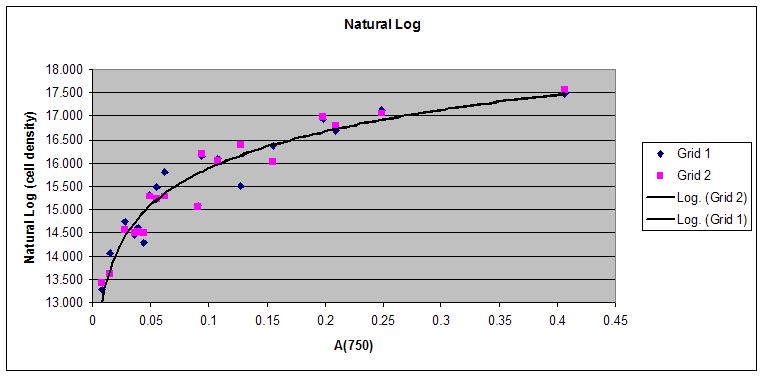
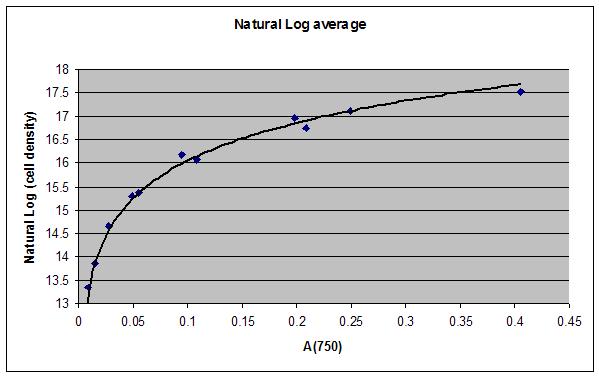
| And then through simple data display, and manipulation, I get these beautiful graphs! click on them to see a larger size. |
 |
 |
 |
 |
| I still have many more counts to go. As you can see, I've only done 21 so far for this strain of Nannochloris and I really need to have atleast 5 times that many. I also have 7 other strains where I will need that many counts. Yikes... Should stock up on the tylenol now I guess :) |