INTRODUCTION
Our entire planet is prone to motion while some of its solid parts seem to be still. Ground surface fluctuates slowly, glaciers flow down the mountains gradually and tectonic plates creep gently. But suddenly rupture of a fault and tremor or the eruption of a volcano occurs in some area causing devastation, destruction, harsh damage, and life loss. To better conceive such catastrophes, scientists have developed a method to measure bending and stretching of earth crust without any need to use instruments, sophisticated systems and travel to the site. This method is SAR interferometry.
Presently
studying and monitoring natural disasters emerges as a vital concern for
sustainable development, welfare and safety of community. Over recent decades,
availability of new remote sensing tools provides the possibility to monitor,
manage and control of natural resources and environment among of which the
disasters are of great importance. Nowadays disaster mitigation and risk
management programs are meaningless without the application of remote sensing
and satellite telecommunications. First attempts to this mean was carried out
applying optical data collected by the medium and high resolution imaging
systems. Optical data proved to have some privileges and limitations. But
emerging radar imaging systems revealed that this new type of data mostly do
not have the limitations of the latter. In the course of its development radar
technology indicated interesting and unprecedented possibilities and
potentials, one of which is Synthetic Aperture Radar (SAR) interferometry.
BACKGROUND AND CONCEPTS
The
first and second European Remote Sensing (ERS) satellites are the earliest
orbiting platforms which data have been applied for SAR interferometry.
Operated by the European Space Agency (ESA), ERS-1 launched in 1991. ERS-2 has
followed its older mate since 1994. Radarsat-1 that is equipped with imaging
radar also launched in 1994. Although ERS-1 and 2, and Radarsat-1 are going to be
retired the forthcoming satellites of ESA’s ENVISAT and Canada’s Radarsat-2
will substitute the earlier ones.
Whereas
the successes of satellite radar interferometry are quite recent, the first
endeavours go to decades earlier. The required data in this technique are
collected by SAR system --an instrument that operates by transmitting microwave
radiation to ground surface and recording back-scattered signal reflections
from points on the Earth surface. The two sources of coherent radiation consist
of two separate passes of satellite over a common area of the Earth surface.
ERS-1 and 2 scene coverage is an area of 100 sq. km. Using two radar scenes of
a common area of the Earth surface collected by the satellites in two different
times an interferogram of the scene can be generated through complex
computerized processes from phase data of radar imagery. It consists of the
fringes cycling from yellow to purple to turquoise and back to yellow. Each
cycle represents a change in the ground height in platform’s direction that
depends to satellite geometry. They also show phase difference between the
corresponding reflected signals for each common ground point that acquired at
two different satellite passes. The fringes are generated due to slightly
different imaging angles, which exists anyway since the repeated satellite
orbits and the sensor pointing are not perfectly coinciding.
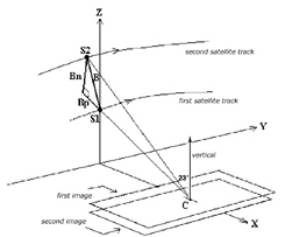
Figure 1: Satellite orbit is very important for successful application
of SAR interferometry. In general a normal baseline larger than 400m is usually
not suitable for interferometry. In addition, baselines smaller than 40m may
not be suitable for DEM generation but this data are very good for differential interferometry (for ease of imagination the graph is draw
exaggeratedly).
Interferometric
data is usually used to generate digital elevation models (DEM's), deformation
maps, and temporal change maps. Even thick cloud cover does not obscure such
images, because water droplets and ice crystals cannot impede microwave
signals. Furthermore, radar antennas onboard the space platforms can take
images equally well during the day or night, because the system provides its
own light source.
COMPARISON OF SAR AND OPTICAL TECHNIQUES
The
distinction between SAR imaging and the optical systems are more profound than
the ability of SAR to operate in conditions that would cause optical
instruments to fail. There are basic differences in the physical principles
dominating the two approaches. Optical sensors record the intensity of
radiation beamed from the sun and reflected from the ground targets. Thus, the
intensity of the detected light characterizes each element of the resulting
image or pixel. SAR antenna in contrast illuminates its target with coherent
radiation. Since the crests and troughs of the emitted electromagnetic wave
follow a regular sinusoidal pattern, SAR can measure both the intensity and the
exact point in the oscillation (phase) of returned waves.
SAR Interferometry has some similarities to stereo-optical imaging in that two images of the common area, viewed from different angles, are appropriately combined to extract the topographic information. The main difference between interferometry and stereo imaging is the way to obtain topography from stereo-optical images. Distance information is inherent in SAR data that enables the automatic generation of topography through interferometry. In other words DEMs can be generated by SAR interferometry with greater automation than optical techniques. On the other hand, using differential SAR interferometry surface deformations can be measured accurately. In addition the ability of SAR to penetrate clouds and provide day and night operation proves that SAR interferometry has definite advantages over conventional mapping techniques.
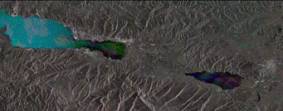
figure 2: Temporal composite
image generated from the SAR images of 13 August 1999 (red), 16 September 1999
(green) and 17 September 1999 (blue). Cyan and green colors across the line
joining Izmit in northeastern shore of Sea of Marmara to Sapanca in south of the
Lake Sapanca shows the change across this line along which the most tremendous
displacement has been reported. Adapazari in northeast of the Lake Sapanca, and
Izmit in northeast and Golcuk in south of Izmit Bay are distinguishable.
SAR
INTERFEROMETRY PRINCIPLES
In practice two SAR images are required to produce an interferometric data set from which height and other information is extracted. To understand SAR interferometry it should be conceived that SAR measures both distance and intensity information. Distance information is encoded in phase. Technically, the phase difference corresponding to the two passes over common locations, allow measurement of the incidence angle of the incoming radiation. Distance combined with both incidence angle and location of SAR platform on each of the two passes gives a three-dimensional location of points on the Earth surface.
Phase measuring is of great benefit since radar operates at extremely high frequencies that correspond to microwaves. In the case of ERS and Radarsat satellites for instance, the applied frequency of the system is 5.375GHz. As a result to complete one oscillation the signal travels only 5.58cm at the speed of light. If the distance from the radar antenna to the target on the ground correspond to a very large but whole number of wavelengths, the round-trip will exactly twice. Thus when the wave returns to the satellite, it will have just completed its final cycle with unchanged phase from its original condition at the time it left. But if the distance to the ground exceeds by only 5 millimeter, the wave will have to cover an additional 1cm in round-trip distance that constitutes 18 percent of a wavelength. Consequently the phase of the reflected wave will be off by 18 percent of a cycle when it reaches the satellite. This is the amount that receiver can easily record. Therefor, the measurement of phase provides a way to gauge the distance to a target with centimeter, or even millimeter precision. Although the phase itself appears randomly every time, the phase differences between corresponding pixels in the two radar images produce a relatively direct interference pattern.
In the interferograms acquired from ERS data each color cycle corresponds to a ground displacement of 28mm or half a wavelength in the satellite’s viewing or slant range direction. Counting the number of fringes the deformation can be estimated. In principle, if two sequential satellite images are taken from exactly the same position, phase difference for any pair of corresponding pixels should not exist. But if the scene on the ground changes a bit in the time interval of two radar scans, the phases of some pixels in the second image will shift.
IZMIT
DISASTER AND AN EMPIRICAL PROJECT
On 17 August 1999 a sever quake measuring 7.8 Richter struck Western Turkey leaving very high rate of life losses and injuries in addition to homelessness and damages. The quake's epicenter was between Izmit and Bursa, 90km east of Istanbul on the Eastern shore of the Sea of Marmara. Nearby cities including Golcuk, Derince, Darica and Adapazari were severely devastated. Since then there have been a series of tremors in the region.
Reportedly the Izmit quake originated at a depth of 10-16km along almost vertical ruptures. Four different fault segments became active during the two consecutive shocks the first of which lasted 12 seconds and affected the western part including Golcuk, Izmit-Sapanca and Arifiye-Akyazi. After 18 minutes another shock with duration of 7 seconds originated along the Golyaka rupture to the east-northeast of Sapanca. The surface displacement reached a maximum of 5m in Arifiye while the average displacement along the active fault system was 2 to 4m.
Izmit disaster has been monitored by the different remote sensing satellites. Not only the medium and high-resolution optical data, but also SAR data of the disaster are available thanks to the different remote sensing satellites orbiting the Earth and monitoring it.
Aiming
to find the pattern of the plate motions in the concerned area through
interferometric images, a small team of specialists and scientists in the
Iranian Remote Sensing Center (IRSC) implemented a one-year termed research
project. The required data including SAR and Landsat imagery as well as some
needed software secured by the European Space Research Institute (ESRIN)
affiliated to ESA. SPOT of the Centre National des Etude Spatial (CNES) and ESA
agreed to pool their space-based resources and provide timely pertinent
information on parts of the Earth damaged by natural or man-made disasters,
announced on 22 July at the United Nations UNISPACE III Conference at Vienna.
Based on this, SAR and optical imagery as well as field data were secured and
input to the project.
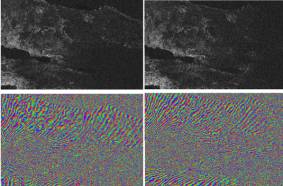
figure 3: Coherence images
(top row) and corresponding phase images (bottom row) generated from the SAR
images of 12 August 1999 and 16 September 1999 (left), and the images of 13
August 1999 and 17 September 1999 (right). The difference related to the time
interval of one day can be distinguished in the upper half. The westward
displacement in upper side of the line joining Izmit to Sapanca and eastward
displacement in lower side can be seen easily.
The
study area was the North Anatolian Fault Zone (NAFZ) that is the most active
fault in Turkey. Most of the biggest earthquakes have occurred in this zone. It
is believed that the Sea of Marmara region is a depression that due to two
fault systems running in parallel are stretching slowly. The tectonic activity
in the area is explained by movements of the Eurasian, Arabic and African
plates that activates different portions of the Anatolian fault system.
The
team used 17 scenes of SAR imagery acquired from the study area, 10 scenes
before and 7 scenes after the quake. The data were mostly the Single Look Complex
Image (SLCI) product while two Precision Image (PRI) Products and two raw data
were available. There were also available two Landsat TM scenes before and
after tremor. SCLI is a single-look complex data in slant range with no speckle
reduction by multi-look processing. Phase continuity is preserved in these
images, and they are particularly suitable for interferometric applications.
PRI images on the other hand are speckle-reduced, ground range and system
corrected imagery. They are not geocoded and terrain distortion (foreshortening
and layover) has not been removed for them.
To
implement the research program, in addition to the noted data a variety of
image analysis and GIS tools including SAR Toolbox-6.1, Earth View
Interferometric SAR-4.4, ER-Mapper-6.0 and Photoshop-5.5 were applied. Two
linked PC computers, each with 10.2Gb of memory space —the memory space for one
of the computers upgraded to 40Gb due to need for further memory space in the
last month of the project-- were used to carry out the study.
DATA
INVESTIGATION
To
approach the goal and detecting changes, it was required to investigate the
appropriate SLCI and PRI image pairs to identify the coherent images. The
available data examined and studied to distinguish if there was the image pairs
suitable for generating interferograms. To this mean the image pairs were
classified in three gropes. The first group comprised of the image pairs, one
showing the scene before and the other after the quake. The second group
consisted of image pairs both before the quake and the third group the image
pairs of after quake. Availability of the interferograms associated to each
three groups reveals the interesting points and indications that can help to
understand and find out the factors and parameters involved in the occurrence
of Izmit quake.
Since
at the early stage the SAR Toolbox was the only applicable software, it used to
determine the baseline of each image pair. Different image pairs tried to be
co-registered due to the fact that co-registration of the image pairs is
prerequisite for generating relevant interferograms, coherence images and DEMs.
39 possible pairs among the available SAR data was identified among of which 22
pairs successfully co-registered with the baselines varying from almost 10
meters to more than 1km. One of the best pairs for example, is the combination
of two images of 13 August 1999 (3 days before the quake) and 17 September 1999
(a month after the quake) with the normal and parallel components of baseline
11.401m and 53.558m respectively. This is a good case for generating a precise
DEM. The team succeeded to generate the corresponding interferogram. Another
pair is the images of 24 December 1998 (nearly 8 months before the quake) and
25 August 1999 (8 days after the quake). The baseline components corresponding
to this pair are 40.850m and 118.674m for normal and parallel components that
is suitable for interferogram generating.
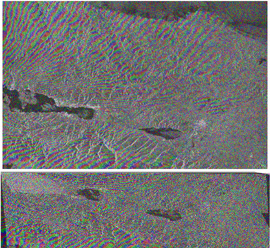
figure 4: Top: interferogram
obtained by mapping the phase image generated from the 13 August 1999 and 17
September 1999 ERS-SAR imagery in slant range mode on the master amplitude
image. Bottom: interferogram obtained
by mapping the phase image generated from the 12 August 1999 and 16 September
1999 ERS-SAR imagery in geocoded mode on the amplitude image.
The data applied to generate SAR differential interferograms show ground surface deformation in an area extending from Istanbul to the east of Lake Sapanca. The density of the fringes is proportional to the degree of change and consequently the rate of damage caused by the earthquake. Results derived from phase interferograms show the consistency of the outputs with the theoretical deformation model, which is derived from geophysical data. According to the geophysical data interpretation the rupture occurred along an east-west fault that caused a predominant horizontal movement of the ground surface. In the case of Izmit quake 36 fringes can be counted in the northern area of Izmit Bay in Kocaeli Province and 24 fringes in the northern area. This means that in the northern area there is 100.8cm displacement and 67.2cm displacement in southern area in the satellite’s viewing direction. The horizontal component of these displacements can be computed simply given the viewing incidence angle of ERS satellites is a fixed amount of 23 degrees. The direction of the horizontal displacements in two sides of the rupture is apparent.
Comparison of the TM data of region before and after the quake supports the acquired information from SAR interferometry for precise validation. However, this required to be combined with parameters such as topographic, land-cover and land-use maps, for correct estimates. Investigating and detecting the eventual changes on the region using the image processing systems provides the data for incorporation to a GIS that shows the potent places.
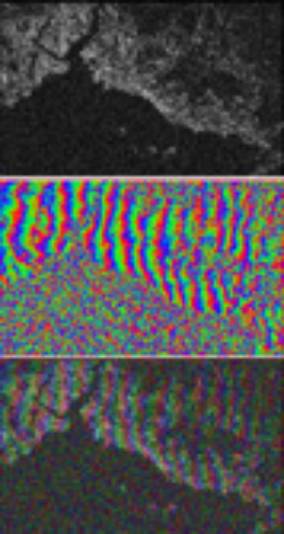
figure 5: Top: Coherence image generated using the SAR images of 24 December 1998 (ERS-2) and 25 August 1999 (ERS-1) shows the changes in the Istanbul area in two sides of Bosporus caused by the Izmit quake. Middle: corresponding phase image of the top image, and Bottom: the image obtained through mapping above phase image on coherence image.
Change detection of the area devastated
by the quake using two Landsat TM imagery of the area before and after the
quake reveals interesting differences. One of these changes can be attributed
to the water transgression in a vast area 0.605sq.km. in the northern coast of
Izmit Bay next to Derince. While the TM image before the quake goes to 27 March
1999, the second image shows the Izmit area a day after quake.
INFORMATION
ANALYSIS
Using SAR interferometry the displacement originated by earthquakes can be qualified. To define the spatial displacement vector generally three measurements is needed. Consequently three interferograms from different viewing angles are required. Practically SAR data from ERS ascending and descending passes would provide two of the three interferograms. Both historical data and tectonic analysis of the area may retrieve the third observation. However, in the case of Izmit quake since it was almost horizontal movement that occurred in east-west direction parallel to satellite’s observation direction, one observation is sufficient. The displacement in the northern area is derived to be 258cm whereas it is 167cm in the southern area.
Alternatively, satellite orbit has a key role in successful application of SAR interferometry. Better results for differential interferometry highly depends on the smaller separation between two observations that means a smaller normal baseline. Generally a normal baseline larger than 400m is usually not suitable for interferometry due to decorrelation or sampling the slopes. On the other hand the baselines smaller than 40m may not be suitable for DEM generation since slopes will be undersampled. But this data will be very good for differential interferometry where height information is to be removed. Small baselines are optimal to preserve the coherence while in this case the influence of the ground topography in the interferogram becomes negligible. These statements were proved in the Izmit case study. The altitude color-coded and shaded digital elevation maps generated from ERS image pairs showing the morphological and tectonic features in the area, the most significant outputs from which are the risk maps.
However, It has been appeared that short-term variations in the atmosphere and ionosphere can sometimes alter the fringe pattern. Changes in the earth surface properties can also induce the shift of interference fringes, even though the ground does not move actually. Such effects can complicate the interpretation of radar interferograms. But on the other hand these secondary influences represent features of the earth that are also of interest.
PROMISING
RESULTS
The
results of such a study help to establish an
estimation model. Although the results are still need to be tested,
considerable interest is seen in the results of the project. They can be used
for sustainable development of region and risk management as well. Recommending
the instructions based on the results of the project to the respective
authorities, they can take convenient and informed actions that may prevent the
damages or reduce the effects and losses. The users of these results would be
governmental and non-governmental organizations involved in the application of
lands and natural resources for the issues such as planning, resource and
environmental management, risk management as well as the relevant research and
investigation programs.
There is a wide range of SAR interferometry applications that can be grouped into four areas including precision calibration, elevation mapping, land deformation, and super-sensitive change detection. An increasing number of applications have become feasible, and more are being investigated. Among the most exciting new applications of SAR interferometry is the two-dimensional mapping of large-scale surface deformation with very high sensitivity. These deformation maps are used to detect and monitor Earth disasters including land deformation due to earthquakes, crustal movements, land slides, volcanic activity, mining and water extraction activities. Another interesting area of research is the use of phase coherence for classification and change detection.
Would SAR interferometry be able to detect the indication changes needed to predict earthquakes and volcanic activities? None can be sure on this yet and presently it is an unrealistic matter but the hopes grow day by day. In scientific research each new tool reveals unprecedented issues that uncover crucial facts and deepens our perception of fundamental principles. Undoubtedly SAR interferometry does the same for the study of our solid but ever changing planet.
ACKNOWLEDGMENT
The author extends his great thanks to ESRIN and ESA for providing the the needed data and software for the project as well as IRSC for providing the required hardware and continued supports.