Report
to ESA/ESRIN
on the research project:
PLATE MOTION ESTIMATES THROUGH ERS
INTERFEROMETRIC SAR IMAGERY CONCERNING THE IZMIT QUAKE OF AUGUST 17, 1999
Parviz Tarikhi
Mohammed Morabi
November 2000
PLATE MOTION ESTIMATES THROUGH ERS
INTERFEROMETRIC SAR IMAGERY CONCERNING THE IZMIT QUAKE OF AUGUST 17, 1999
Parviz Tarikhi
Mohammed Morabi
Iranian
Remote Sensing Center (IRSC)
No.
22, 14th Street, Saadat-Abad
Tehran
19979, Iran
Tel:
+98 21 2063207
Fax:
+98 21 2064474
E-mail:
[email protected]
INTRODUCTION
The
entire Earth planet is prone to motion while some of its solid parts seem to be
still. Ground surface fluctuates slowly, glaciers flow down the mountains
gradually and tectonic plates creep gently. But suddenly rupture of a fault and
tremor or the eruption of a volcano occurs in some area causing devastation,
destruction, harsh damage, and life loss. To better conceive the dimensions and
behavior of such catastrophes, scientists have developed a method to estimate
bending and stretching of earth crust without any need to use sophisticated
systems and instruments as well as laborious field work. This method is called
SAR interferometry.
Presently
studying and monitoring natural disasters emerges as a vital concern for
sustainable development, welfare and safety of community. Over recent decades,
availability of new remote sensing tools provides the possibility to monitor,
manage and control of natural resources and environment among of which the
disasters are of great importance. Nowadays disaster mitigation and risk
management programs are meaningless without the application of remote sensing
and satellite telecommunications. First attempts to this mean was carried out
applying optical data collected by the medium and high resolution imaging
systems. Optical data proved to have some privileges and limitations. But
emerging radar imaging systems revealed that this new type of data mostly do
not have the limitations of the latter. In the course of its development radar
technology indicated interesting and unprecedented possibilities and
potentials, one of which is Synthetic Aperture Radar (SAR) interferometry.
BACKGROUND
AND CONCEPTS
The
first and second European Remote Sensing (ERS) satellites are the earliest
orbiting platforms which their data have been applied for SAR interferometry.
Operated by the European Space Agency (ESA), ERS-1 launched in 1991. ERS-2 has
followed its older mate since 1994. Canadian Radarsat-1 that is equipped with
imaging radar also was launched in 1994 and the first Japanese Earth Resource
Satellite (JERS-1) was orbited two years earlier in 1992. Although ERS-1, 2,
and Radarsat-1 and JERS-1 are going to be retired the forthcoming satellites of
ESA’s ENVISAT and Canada’s Radarsat-2 will substitute the earlier ones.
While
the successes of satellite radar interferometry are quite recent, the first
endeavors go back to decades earlier. The required data in this technique are
collected by SAR system --an instrument that operates by transmitting microwave
radiation to ground surface and recording back-scattered signal reflections
from points on the Earth surface. The two sources of coherent radiation consist
of two separate passes of satellite over a common area of the Earth surface.
ERS-1 and 2 scene coverage is an area of 100sq.km. Using two radar scenes of a
common area of the Earth surface collected by the satellites in two different
times an interferogram of the scene can be generated through complex
computerized processes from phase data of radar imagery. It consists of the
fringes cycling from yellow to purple to turquoise and back to yellow. Each
cycle represents a change in the ground height in the direction of platform
that depends on satellite geometry. They also show phase difference between the
corresponding reflected signals for each common ground point that acquired at
two different satellite-passes. The fringes are generated due to slightly
different imaging angles, which exists anyway since the repeated satellite
orbits and the sensor pointing does not perfectly coinciding.
Interferometric
data is usually used to generate digital elevation models (DEM's), deformation
maps, and temporal change maps. Even thick cloud cover does not obscure such
images, because water droplets and ice crystals can not impede microwave
signals. Furthermore radar antennas onboard the space platforms can take images
equally well during the day or night, because the system provides its own light
source.
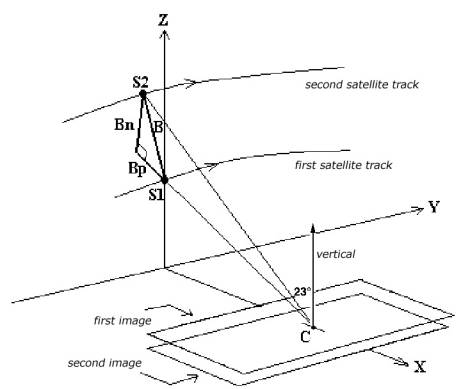
Image 1: Satellite
orbit is very important for successful application of SAR interferometry. In
general a normal baseline larger than 400m is usually not suitable for
interferometry. Also baselines smaller than 40m may not be suitable for DEM
generation but this data are very good for differential interferometry.
COMPARISON OF SAR AND OPTICAL
TECHNIQUES
The
distinction between SAR imaging and the optical systems are more profound due
to the ability of SAR to operate in conditions that would cause optical
instruments to fail. There are basic differences in the physical principles
dominating the two approaches. Optical sensors record the radiation intensity
beamed from the sun and reflected from the ground targets. Thus the intensity
of the detected light characterizes each element of the resulting image or pixel.
SAR antenna in contrast illuminates its target with coherent radiation the
radiation in which there is definite phase relationships between different
points in a cross section of the beam. Since the crests and troughs of the
emitted electromagnetic wave follow a regular sinusoidal pattern, SAR can
measure both the intensity and the exact point in the oscillation (phase) of
returned waves.
SAR Interferometry has some
similarities to stereo-optical imaging in that two images of a common area,
viewed from different angles, are appropriately combined to extract the
topographic information. The main difference between interferometry and stereo
imaging is the way to obtain topography from stereo-optical images. Distance
information is inherent in SAR data that enables the automatic generation of
topography through interferometry. In other words DEMs can be generated by SAR
interferometry with greater automation than optical techniques. On the other
hand, using differential SAR interferometry surface deformations can be
measured accurately. In addition the ability of SAR to penetrate clouds and
provide day and night operation proves that SAR interferometry has definite
advantages over conventional mapping techniques.
SAR
INTERFEROMETRY PRINCIPLES
In
practice two SAR images of two different passes from common area are required
to produce an interferometric data set from which height and other information
can be extracted. To understand SAR interferometry it should be conceived that
SAR measures both distance and intensity information. Distance information is
encoded in phase.
Technically,
the phase difference corresponding to the two passes over common locations,
allow measurement of the incidence angle of the incoming radiation. Distance
combined with both incidence angle and location of SAR platform on each of the
two passes gives a three-dimensional location of points on the Earth surface.
Phase
measuring is of great benefit since radar operates at extremely high
frequencies that correspond to microwaves. In the case of ERS and Radarsat
satellites for instance, the applied frequency of the system is 5.375GHz. As a
result to complete one oscillation the signal travels only 5.58cm at the speed
of light. If the distance from the radar antenna to the target on the ground
correspond to a very large but whole number of wavelengths, the round-trip will
be exactly twice. Thus when the wave returns to the satellite, it will have
just completed its final cycle with unchanged phase from its original condition
at the time it left. But if the distance to the ground exceeds by only 5
millimeter, the wave will have to cover an additional 1cm in round-trip
distance that constitutes 18 percent of a wavelength. Consequently the phase of
the reflected wave will be off by 18 percent of a cycle when it reaches the
satellite. This is the amount that receiver can easily record. Therefor, the
measurement of phase provides a way to estimate the distance to a target with
centimeter, or even millimeter precision. Although the phase itself appears
randomly every time, the phase differences between corresponding pixels in the
two radar images produce a relatively direct interference pattern.
In the
interferograms acquired from ERS data each color cycle corresponds to a ground
displacement of 28mm or half a wavelength in the satellite’s viewing or slant
range direction. Simply counting the number of fringes the deformation can be
estimated. In principle, if two sequential satellite images are taken from
exactly the same position, phase difference for any pair of corresponding
pixels should not exist. But if the scene on the ground changes a bit in the
time interval of two radar scans, the phases of some pixels in the second image
will shift.
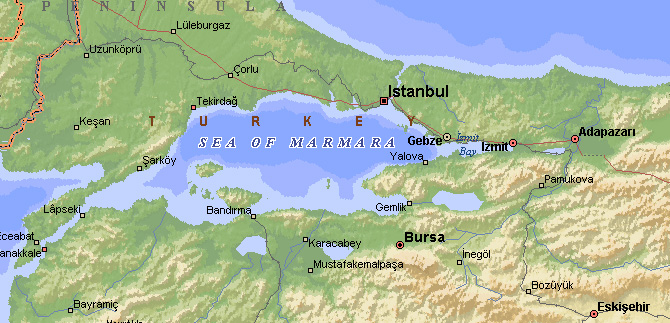
Image 2:
Map of western
Turkey showing the site of the Izmit quake
IZMIT
DISASTER AND AN EMPIRICAL PROJECT
On 17
August 1999 a sever quake measuring 7.8 Richter struck Western Turkey leaving
very high rate of life losses and injuries in addition to homelessness and
damages. The quake's epicenter was between Izmit and Bursa, 90km southeast of
Istanbul on the Eastern shore of the Sea of Marmara. Nearby cities including
Golcuk, Derince, Darica and Adapazari were severely devastated. Since then
there have been a series of tremors in the region.
Reportedly
the Izmit quake originated at a depth of 10-16km along almost vertical
ruptures. Four different fault segments became active during the two
consecutive shocks the first of which lasted 12 seconds and affected the
western part including Golcuk, Izmit-Sapanca and Arifiye-Akyazi. After 18
minutes another shock with duration of 7 seconds originated along the Golyaka
rupture to the east-northeast of Sapanca. The surface displacement reached a
maximum of 5m in Arifiye while the average displacement along the active fault
system was 2 to 4m.

Image 3:
The Izmit 17
August quake, scaling 7.8 Richter, leaves very high rate of life losses and
injuries in addition to homelessness and damages in Western Turkey
Izmit
disaster has been monitored by the different remote sensing satellites. Not
only the medium and high-resolution optical data, but also SAR data of the
disaster are available thanks to the different remote sensing satellites
orbiting the Earth and monitoring it.
Aiming
to find the pattern of the plate motions and estimation of displacements in the
concerned area through interferometric images, a small team of specialists and
scientists in the Iranian Remote Sensing Center (IRSC) implemented a one-year
termed research project. The required data including SAR and Landsat imagery as
well as some needed software secured by the European Space Research Institute
(ESRIN) affiliated to ESA. SPOT of the Centre National des Etude Spatial (CNES)
and ESA agreed to pool their space-based resources and provide timely pertinent
information on parts of the Earth damaged by natural or man-made disasters,
announced on 22 July at the United Nations UNISPACE III Conference at Vienna.
Based on this, SAR and optical imagery as well as field data were secured as
the input to the project.
The study
area was the North Anatolian Fault Zone (NAFZ) that is the most active fault
system in Turkey. Most of the great earthquakes have occurred in this zone. It
is believed that the Sea of Marmara region is a depression (graben) that due to
two fault systems running in parallel stretches slowly. Movements of the
Eurasian, Arabic and African plates that activate different portions of the
Anatolian fault system, explain the tectonic activity in the area.
The team
used 17 scenes of SAR imagery acquired from the study area, 10 scenes before
and 7 scenes after the quake. The data were mostly the Single Look Complex
Image (SLCI) product while two Precision Image (PRI) Products and two raw data
were available. There were also available two Landsat TM scenes before and
after tremor. SCLI is a single-look complex data in slant range with no speckle
reduction by multi-look processing. Phase continuity is preserved in these
images, and they are particularly suitable for interferometric applications.
PRI images on the other hand are speckle-reduced, ground range and system
corrected imagery. They are not geocoded and terrain distortion (foreshortening
and layover) has not been removed for them. In Appendix A (appendA directory)
the quick looks as well as header analysis data and other parameters for each
of the ERS-SAR images can be found.
Table 1: List of the ERS-SAR data input to
the project
|
Data name |
Date (mm/dd/yy) |
Platform |
Track |
Frame |
Orbit |
Product type |
|
B0r |
06/07/1995 |
ERS-1 |
336 |
2781 |
20364 |
RAW |
|
B9s |
06/08/1995 |
ERS-2 |
336 |
2781 |
00691 |
SLCI |
|
B8r |
10/15/1998 |
ERS-2 |
336 |
2781 |
18226 |
RAW |
|
B7s |
12/24/1998 |
ERS-2 |
336 |
2781 |
19228 |
SLCI |
|
B6s |
03/04/1999 |
ERS-2 |
336 |
2781 |
20230 |
SLCI |
|
B5s |
03/20/1999 |
ERS-2 |
064 |
2781 |
20459 |
SLCI |
|
B4p |
04/05/1999 |
ERS-2 |
293 |
2781+2 nodes |
20688 |
PRI |
|
B3s |
04/24/1999 |
ERS-2 |
064 |
2781 |
20960 |
SLCI |
|
B2s |
08/12/1999 |
ERS-1 |
157 |
819-4 nodes |
42229 |
SLCI |
|
B1s |
08/13/1999 |
ERS-2 |
157 |
819-4 nodes |
22556 |
SLCI |
|
|
08/17/1999 |
EARTHQUAKE
|
||||
|
A1p |
08/23/1999 |
ERS-2 |
293 |
2781+2 nodes |
22692 |
PRI |
|
A2s |
08/25/1999 |
ERS-1 |
336 |
2781 |
42408 |
SLCI |
|
A3s |
08/26/1999 |
ERS-2 |
336 |
2781 |
22735 |
SLCI |
|
A4s |
09/10/1999 |
ERS-1 |
064 |
2781 |
42637 |
SLCI |
|
A5s |
09/11/1999 |
ERS-1 |
064 |
2781 |
22964 |
SLCI |
|
A6s |
09/16/1999 |
ERS-1 |
157 |
819-4 nodes |
42730 |
SLCI |
|
A7s |
09/17/1999 |
ERS-2 |
157 |
819-4 nodes |
23057 |
SLCI |
Table 2: List
of the Landsat TM data input to the project
|
Data name |
Date (mm/dd/yy) |
Platform |
Sensor |
Details |
|
B |
03/27/1999 |
Landsat |
TM |
Path 179 Row 32 |
|
|
08/17/1999 |
EARTHQUAKE
|
||
|
A |
08/18/1999 |
Landsat |
TM |
|
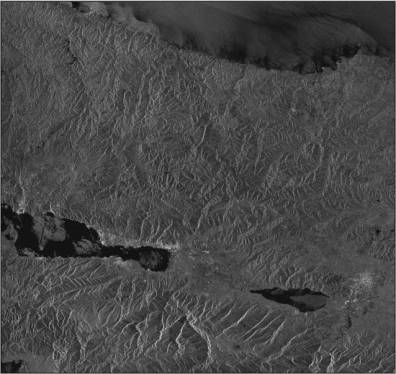
Image 4:
The full
resolution image of the Izmit area acquired by ERS-2 on 13 August 1999, four
days before quake.
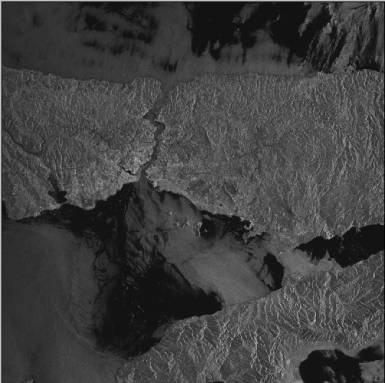
Image 5:
The full
resolution image of the Istanbul area acquired by ERS-2 on 4 March 1999, five
months and ten days before quake.
To implement the research program, in addition to the
noted data a variety of image analysis and GIS tools including SAR Toolbox-
6.1, Earth View Interferometric SAR- 4.4, ER-Mapper-5.5 and PhotoShop-5.5 were
employed. Two linked PC computers, each with 10.2Gb of memory space – the
memory space for one of the computers upgraded to 40Gb due to need for further memory
space in the last month of the project-- were used to do the processing. Two
full-resolution ERS-SAR images of the study area generated by SAR Toolbox are
given below. Image 4 shows the full resolution image of the Izmit region
acquired by ERS-2 on 13 August 1999 (four days before quake). Image 5 shows
also the full resolution image of the Istanbul area acquired by ERS-2 satellite
on 4 March 1999, five months and ten days before quake.
DATA
INVESTIGATION AND METHODOLOGY
To
approach the goal and detecting changes in the study area, it was required to
investigate the appropriate SLCI and PRI image pairs to identify the coherent
images. The available data were examined and studied to distinguish if there
was the image pairs suitable for generating interferograms. The image pairs
were classified in three groups. The first group comprised of the image pairs,
one showing the scene before and the other after the quake. The second group
consisted of image pairs both before the quake and the third group the image
pairs of after quake. Availability of the interferograms associated to each
three groups reveals the interesting points and indications that can help to
understand and find out the factors and parameters involved in the occurrence
of Izmit quake.
Since at
the early stage the SAR Toolbox was the only applicable software, it was used
to determine the baseline corresponding to each image pair. Different image
pairs tried to be co-registered due to the fact that co-registration of the
image pairs is a prerequisite for generating relevant interferograms, coherence
images and DEMs. 39 possible pairs among the available SAR data was identified
among of which 22 pairs successfully co-registered with the baselines varying
from almost 10 meters to more than 1km. In Appendix B (appendB) the information
on the appropriate pairs including the co-registration parameters, baseline and
residual details is given. The name for each directory refers to the
combination generated from two images that the first is master and the second
is slave image. For instance the directory with the name b2a6 have the files
related to the combination of the image b2 (from Table 1) as master and a6 as
the slave image. Table 3 shows the information on the status of co-registration
of ERS-SAR image pairs and their baseline concisely. The upper number in the
cells of the table refers to the normal component of the baseline whereas the
lower number indicates the parallel component of the baseline for the
corresponding pairs. For each pair we also tried to co-register the image pairs
when we changed the place of master and slave images respectively. The results
are a bit different from those of relevant former pairs. One interesting case
is the image pairs of 12 August 1999 and 16 September 1999 whose corresponding
baseline parameters are 121.640m and 67.725m for normal and parallel components
respectively. When we replace master image with slave image the values 70.912m
and 66.023m are obtained for normal and parallel components respectively.
PRODUCTS
The team
examined the available data using available softwares and miscellaneous
information. This led to generation of two types of products including optical
and SAR products. Optical products obtained using two Landsat TM scenes of the
common area struck by the Izmit quake. One of the images dates 27 March 1999
and the second 18 August 1999 (a day after the quake). ER Mapper software was
used to generate different combinations of two images to detect the changes.
For SAR
data using SAR Toolbox we tried to generate different composites applying the
available tools of the software, whereas Earth View InSAR enabled us to
generate interferograms and the related products. Below some of the products
can be seen. For each product the necessary details are given and discussed.
Optical
products
More
than 10 different products generated from the Landsat Thematic Mapper (TM)
images of 27 March and 18 August. Image 6 is a false color composite generated
by combining the 7, 5 and 1 bands of the Landsat TM image of 18 August 1999 a
day after the earthquake. Band 7 represents the middle infrared portion of TM
sensor onboard of Landsat. It ranges from 2.08 to 2.35 micron with the spatial
resolution of 30m. Band 5 is also the middle infrared TM band that ranges from 1.55
to 1.75 microns with the same spatial resolution of the band 7. Band 1 on the
other hand ranging from 0.45 to 0.52 micron refers to blue color. The image
shows the city of Izmit in northern shore of Izmit Bay. It seems that the
bright yellow spot on top left is due to the fire caused by the explosion of
the fuel tanks after quake. The dense black smoke coming up to the sky can be
readily identified in left. In the Image 7 the same phenomena can be seen as a
thermal anomaly. Band 6 of Landsat TM is the infrared thermal band ranging from
10.40 to 12.50 microns with the spatial resolution of 120m, and the flaming of
the fuel tanks can be easily distinguished as a bright spot in the middle of
the image.
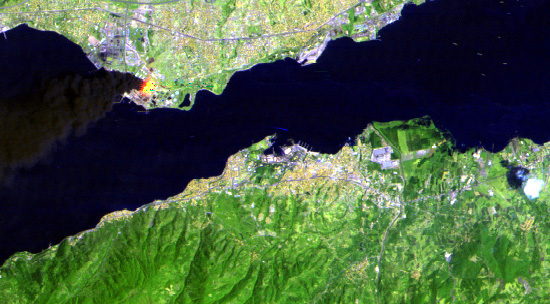
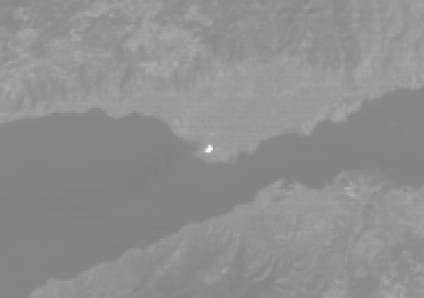
Image 6: The 7-5-1 false color composite image of 18
August 1999 a day after the quake of Izmit area that is lying on northern shore
of Izmit Bay. The bright yellow spot on top left is due to the fire caused by
the explosion of the fuel tanks after quake. The dense black smoke that comes
up can be readily identified in left.
Image 7:
Band 6 of the
image acquired by Landsat TM on 18 August 1999 from the Izmit area. Flaming of
the fuel tanks can be easily distinguished as a bright spot in the middle of
the image.
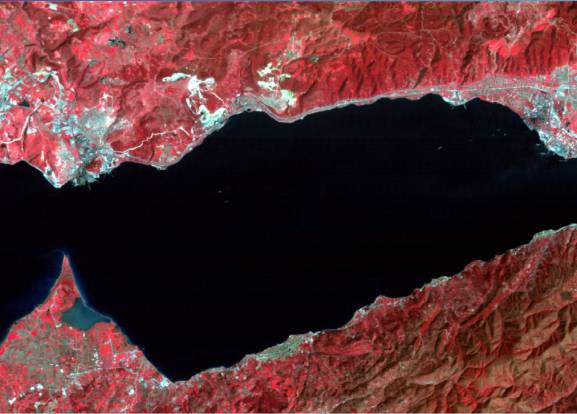
Image 8(a): This image shows the area on 27
March 1999. It is a false color composite of 4, 3, 2 TM bands.
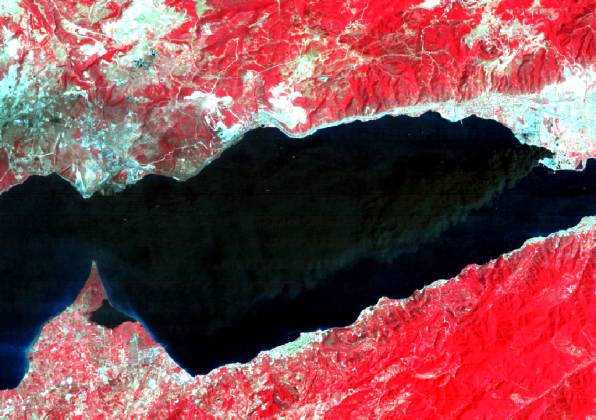
Image 8(b): This
image shows the area on 18 August 1999. It is a false color composite of 4, 3,
2 TM bands.
Image
8(a) taken on 27 March 1999, is a false color composite that obtained combining
bands 4, 3, and 2 of TM sensor. Band 4 is a near infrared band ranging from
0.76 to 0.90 micron, while band 3 or red band ranges from 0.63 to 0.69 micron
and band 2 or green band ranges from 0.52 to 0.60 micron. All three bands have
the spatial resolution of 30m. Image 8(b) that is taken on 18 august 1999 is
also a false color image generated by combining TM bands 4, 3, and 2.
Comparison of these two images reveals some differences around the triangle
shaped peninsula as well as the Izmit Bay. In the Image 8(a) sea water level is
lower than that of the image 8(b). Image 8(a) shows the area at the beginning
of spring when the input water from the rivers is not much causing poor
presence of the suspensions in the shore waters. In the Image 8(b) the water
level is high and the presence of the suspensions in the shore waters is also
increased. There is not a logical relation between the mentioned changes and
the earthquake. However, the changes in the brightness of the ground features
around the coastal zones of the Izmit Bay that are mainly the urban areas can
be an indication of the destruction caused by the quake.
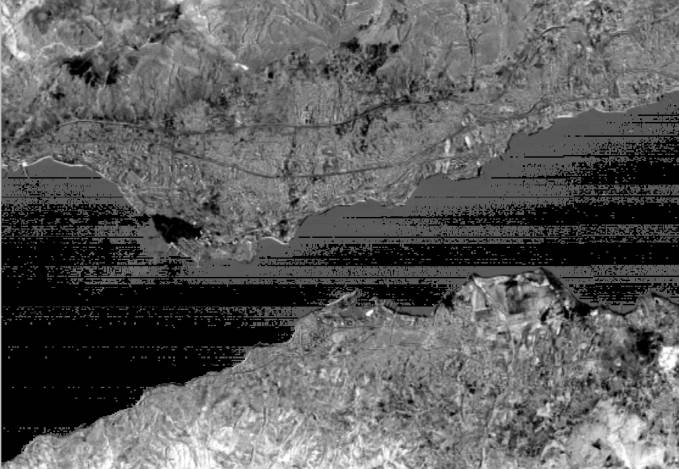
Image 9:
The band 3
intensity image of the images of 27 March and 18 August 1999 Landsat TM imagery
Image 9
is the band-3 intensity image of the images of 27 March and 18 August 1999
Landsat TM imagery. The evident changes can be distinguished in left and
northern shore of sea (the black triangular area that is due to the
transgression of sea water to the urban area. The same changes can be also
identified in the southern shores of the Izmit Bay at right. In the urban areas
at bottom right the degree of brightness is an indication of the change due to
the devastation caused by the quake.
Image 10
is the image obtained by assigning the 4, 3, and 2 bands of the image of 18
August 1999 to the intensity, hue and saturation components respectively. The
red spots and areas at the top and top right and bottom left shows the changes
caused by the thermal increase in those points which may be due to the fires
initiated after quake.
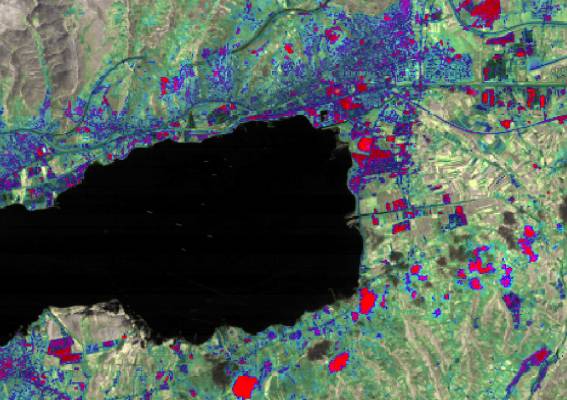
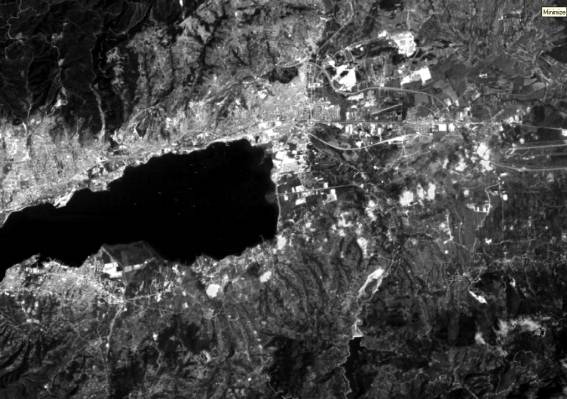
Image 10: The image obtained through assigning the 4,
3, and 2 bands of the image of 18 August 1999 to the intensity, hue and
saturation components respectively.
Image
11: This image
shows the second principal component obtained from the integration of the band
3 of both Landsat TM images of 27 March and 18 August 1999. The second
principal component image basically indicates the areas that have changed due
to the earthquake. The degree of brightness refers to the rate of the change.
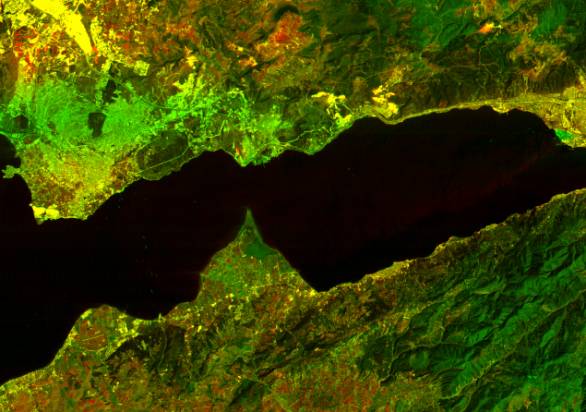
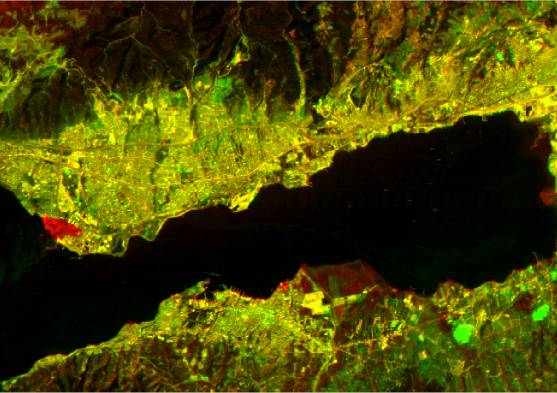
Image 12: Red/green difference image of the area
generated using the images of before and after the quake
Image
13: Red/green
difference image of the area generated using the images of before and after the
quake. In this image the place of the generating data sets have been exchanged.
Image 11
shows the second principal component obtained from the integration of the band
3 of both Landsat TM images of 27 March and 18 August 1999. The second
principal component image basically indicates the areas that have changed due
to the earthquake. The pixels with poor correlation in the different dates
appear in the second principal component image. This is exactly the case in the
image 11 where the bright areas around the Izmit Bay show the lowest correlation
and as a result the highest changes. The gray areas at top right and left in
north of the Izmit Bay also shows the changes. The degree of brightness refers
to the rate of the change.
Red/green
difference image generation is one of the common techniques for the enhancement
of the areas that have been changed. In this technique a data set of green
color (before the quake) and the second data set of the red color (after the
quake) both for band 3 is represented. The integrated output image shows the yellow
shadows indicating the same reflection in two dates before and after the
earthquake whereas the changed areas appear in green or red colors. Image 12
illustrates this process clearly. In these image that show the Izmit Bay and
its surrounding the red pixels in the urban areas can be related to the
distractions caused by the earthquake. The two considerable features in this
image is the transgression effect of the sea water to the urban areas that can
be distinguished in green color (top right) and the smoke from the burning site
that can be seen in green color. Image 13 is the same Image 12 with the
difference that the data sets have been exchanged. Consequently the
transgression effect of the seawater to the urban areas can be distinguished in
red color (middle left).
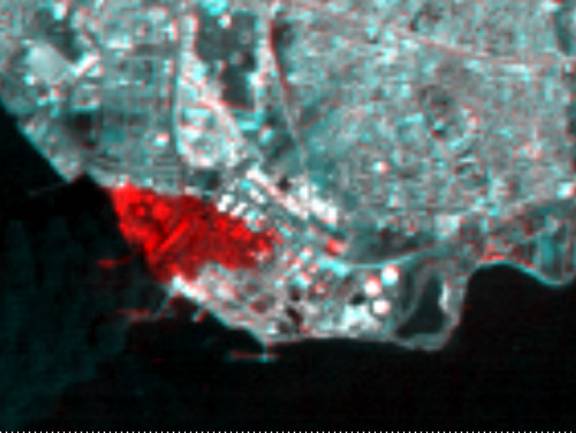
Image 14 is obtained from the data
sets of two dates one before the quake and the other after the quake. The red
color is assigned to the image of 27 March and the green and blue colors are
assigned to the image of 18 August. In this image the changed sites in the
urban area as well as sea attire transgression to the urban areas can be seen
in red.
Image
14: This Image is
obtained from the data sets of two dates one before the quake and the other
after the quake. In this image the changed sites in the urban area as well as
sea water transgression to the urban areas can be seen in red.
SAR
products
17 SAR
images the list of which is given in the Table 1 are applied. This imagery
comprised of two raw images before the quake, two PRI data before and after the
earthquake and 13 SLCI images -- 7 images before and 6 images after the quake.
For a long term during the implementation of project SAR Toolbox was the only
available software for manipulation and investigation of SAR data. It was only
in the few last months of the project the team equipped with the Earth View
InSAR software that enabled us to generate interferograms and the relevant
products. Below some of the SAR products can be seen. Non-interferometric SAR
product are given firstly and the interferometric SAR products can be seen
following the non-interferometric products.
I)
Non-interferometric SAR products
Image 15
is a temporal composite obtained from three images of the common area in
different dates. This type of images is commonly used for change detection. Red
color is assigned to the image of 13 August 1999 whereas the green and blue
colors are assigned to the images of 16 and 17 September 1999 respectively.
Cyan and green colors across the line joining Izmit in northeastern coast of
Marmara Sea to Sapanca in south of the Lake Sapanca shows the subtle change
across this line along which the most tremendous displacement has been
reported. Adapazari in northeast of the Lake Sapanca, and Izmit in northeast
and Golcuk in south of Izmit Bay are distinguishable.
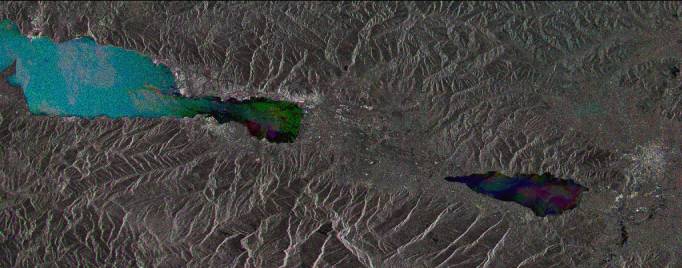
Image
15: Temporal
composite image generated from the SAR images of 13 August 1999 (red), 16
September
1999 (green) and 17 September 1999 (blue).
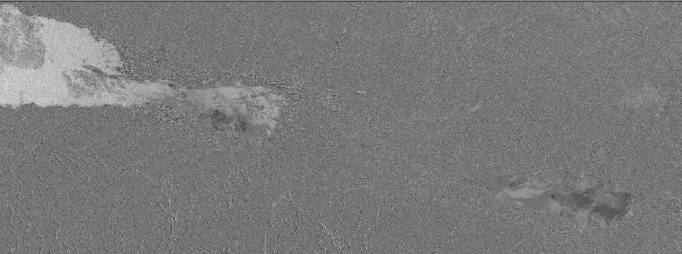
Image
16 is the first principal component image generated from the images of 13
August 1999 and 16 September 1999.
Image 17 is the second principal component image of the images of 13 August
and 16 September 1999. The first principal
component image shows the unchanged corresponding pixels in the two images while the
second principal component image reveals the corresponding pixels that have
changed during time. Images 16 and 17 confirm this clearly. The changes in the
areas around the Izmit bay and the Lake
Sapanca in the second principal component image is considerable.
Image 18
is the coherence image of the images of 13 August 1999 and 16 September 1999.
There is a low correlation between two images and it is evident from the
coherence image.
Image 19
obtained from the images of 13 August (4 days before the quake), 16 September (one
month after the quake) 1999 and the second principal component of these two
images. We have given red color to the first image and green and blue to the
second image and the second principal component images respectively. Blue and
yellow colors in the urban areas struck by the quake are the indication of
surface disturbances. Image 20 is also obtained from the images of 13 August,
16 September 1999 and the second principal component of these two images. But
in this case red color is given to the principal component image and green and
blue colors are given to the images of 13 August, 16 September 1999
respectively. Red and cyan colors in the urban areas damaged by the quake
indicate the changes.
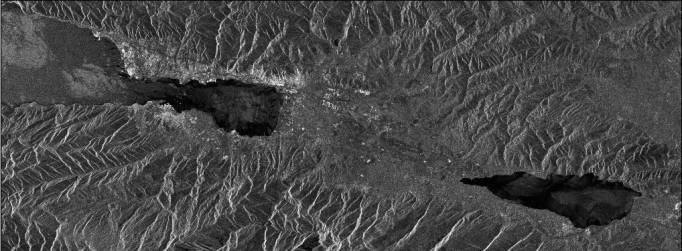
Image 16: The first
principal component image generated from the images of 13 August and 16
September 1999.
Image
17: The second
principal component image generated from the images of 13 August and 16
September 1999.
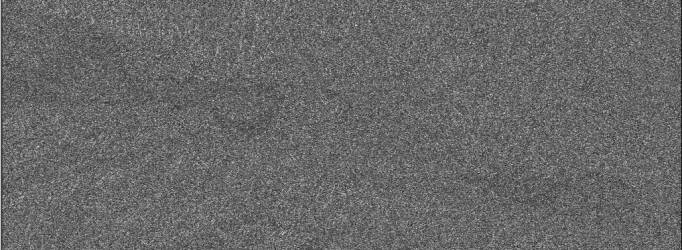
Image 18: The coherence
image of the images of 13 August and 16 September 1999.
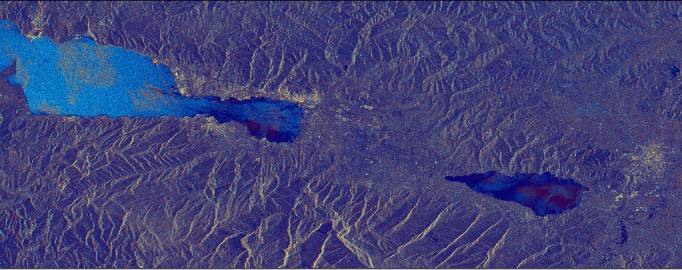
Image 19: This image is
obtained from the images of 13 August, 16 September 1999 and the second
principal component of these two images.
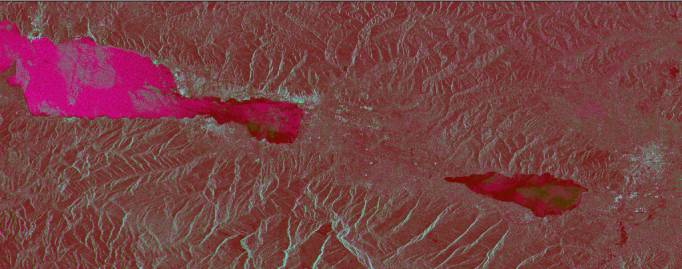
Image
20: This image is
obtained from the images of 13 August, 16 September 1999 and the second
principal component of these two images. But in this case red color is given to
the principal component image and green and blue colors are given to the images
of 13 August, 16 September
1999
respectively.
Multiplying
the images of 13 August and 16 September generates image 21. Only the
corresponding pixels with different brightness values give a different pixel
value in comparison to the corresponding unchanged pixels in two images.
Image 22 is generated from the coherence image (red),
division image (green) and the first principal component image (blue) obtained
from the images of 13 August and 16 September 1999, whereas the Image 23 is
generated from coherence image (red), the first principal component image
(green) and the second principal component image (blue) of the images of 13
August and 16 September. In the Image 23 blue and cyan colors indicates the
changes. In the Image 22 on the other hand green and magenta colors is the
indication of change.
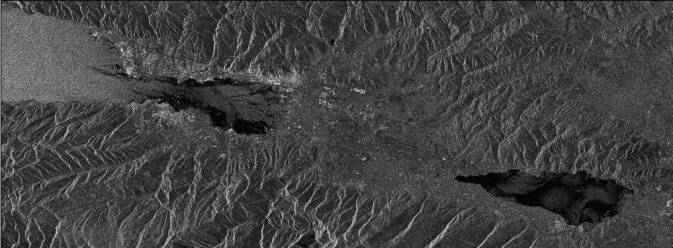
Image
21: This image has been generated multiplying the images of
13 August and 16 September.
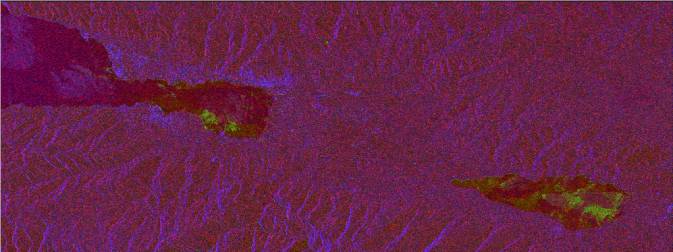
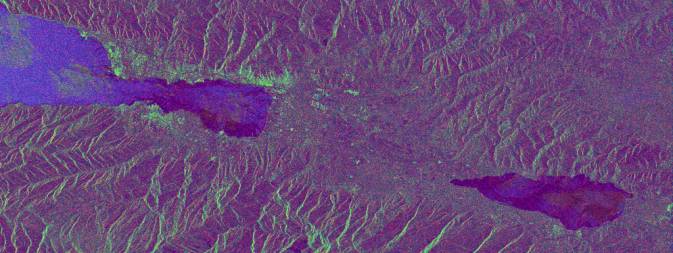
Image 22: This image is generated from the coherence image (red), ratio image
(green) and the first principal component image (blue) obtained from the images of 13 August and 16 September 1999.
Image 23: This image is
generated from coherence image (red), the first principal component image
(green) and the second principal component image (blue) obtained from the
images of 13 August and 16 September.
II)
Interferometric SAR products
Above we inspected some optical and non-interferometric
SAR products. Although most of these products can reveal the changes caused by
the earthquake qualitatively, the rate and trend of deformation are still
obscure. A very precise quantitative analysis of displacements is made possible
through interpretation of interferograms produced for this purpose.
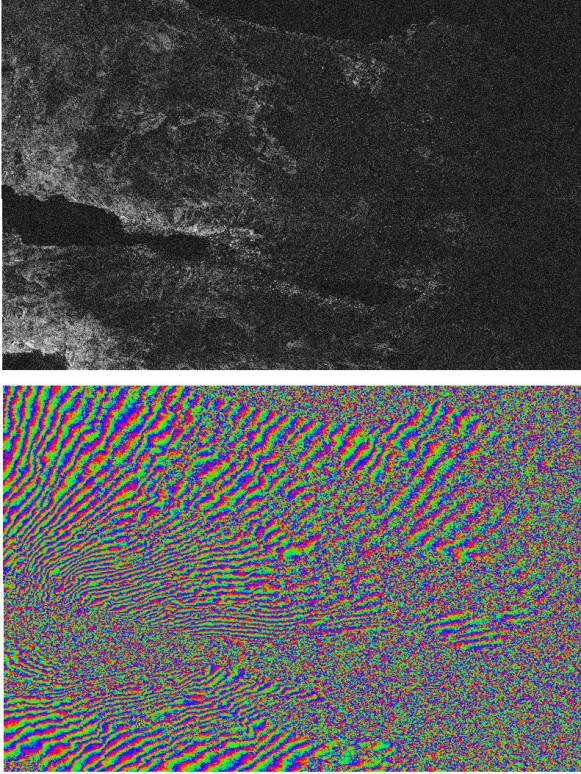
Image 24: Top image is
the coherence image generated from the SLCI ERS-SAR images of 13 August 1999
and 17 September 1999. The bottom image is the phase image generated from the
same image pairs.
Image 24 consists of two images. The top image is the
coherence image generated in slant range mode from the SLCI ERS-SAR images of
13 August 1999 and 17 September 1999. The slant range projection mode matches
the enhanced interferogram pixel by pixel. The bottom image is the enhanced
interferogram generated from the same image pairs. Both the images are
collected by ERS-2. The poor correlation can be distinguished in the area
between the Lake Sapanca and the Izmit Bay. There is also poor correlation in
the urban area around the Izmit Bay. The high density of the fringes in the
mentioned areas is the indication of the highest replacement that can be the
reason for poor correlation in the coherence image. In the Image 25 the phase
image of the Image 24 is mapped on the intensity image of the SAR image of 13
August that is the master image of the SLCI pair. SAR images of 13 August 1999
shows the area 3 days before the quake and the image of 17 September 1999 shows
the same area a month after the quake. The normal and parallel components of
baseline for this image pair are 11.401m and 53.558m respectively. This is good
case for generating a precise interferogram as well as DEM and the team
succeeded to generate them.
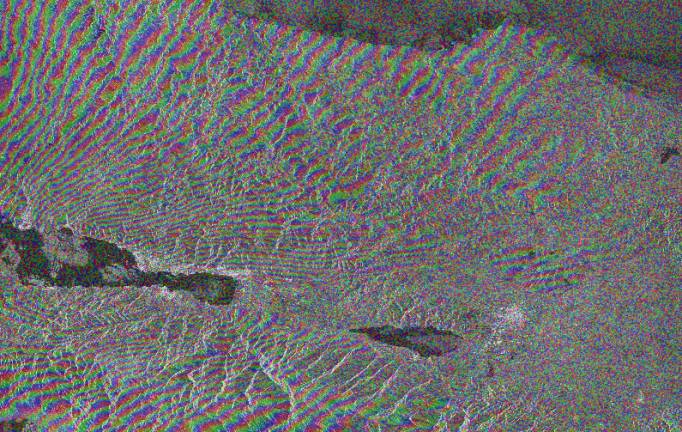
Image
25: This image is
generated by mapping the phase image of the Image 24 on the intensity image of
the SAR image of 13 August that is the master image of the SLCI pair.
Image 26 top is the coherence image generated from the
SLCI ERS-SAR images of 17 September and 13 August 1999. The difference with the
corresponding image of 24 is that in the image 26 we have displaced the master
and slave images and generated a new coherence, phase images and interferogram.
We have done this for all of the possible pairs and in Table 3 in Appendix B
(appendB) the relevant baselines can be found. It can be seen easily that there
is some difference between the baselines of a pair with the one generated when
we changed the place of master and slave images. This is a point to be
investigated in depth and find the proof for this difference. It will also be
of concern to find the difference between the corresponding products precisely.
The bottom image is the enhanced interferogram generated from the same image
pairs. In the Image 27 the phase image of the Image 26 is mapped on the
coherence image. Normal and parallel components of baseline for this image pair
are 13.971m and 53.767m respectively.
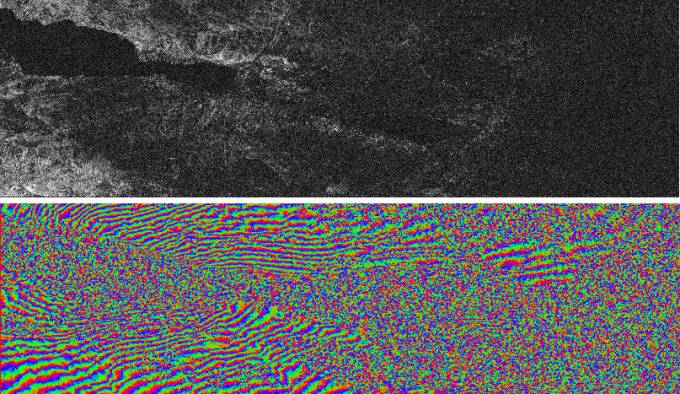
Image
26: Top image is
the coherence image generated from the SLCI ERS-SAR images of 17 September 1999
and 13 August 1999. The bottom image is the phase image generated from the same
image pairs.
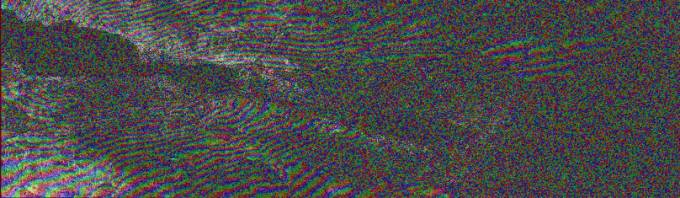
Image 27: This
image is generated by mapping the phase image of the Image 26 on the coherence
image.
Image 28
consists of two images including the coherence image on top and phase image in
bottom. These images are generated in geocoded mode from the SLCI ERS-SAR
images of 12 August 1999 and 16 September 1999. In geocoded projection mode the
image is terrain corrected and re-sampled to a standard map projection that in
this case is WGS84. Terrain corrected projection mode refers to a projection by
which the height, coherence or any other data of the SAR image product is
corrected for SAR image distortions such as layover and foreshortening. Both
images are collected by ERS-1. The poor correlation can be distinguished in the
area between the Lake Sapanca and the Izmit Bay. There is also poor correlation
in the urban areas around the Izmit Bay. High density of the fringes in the
mentioned areas indicates the highest displacement that can be the reason for
the poor correlation in the coherence image. In the Image 29 the phase image of
the Image 28 is mapped on the intensity image of the SAR image of 12 August
that is the master image of the SLCI pair. SAR images of 12 August 1999 shows the
area 4 days before the quake and the image of 16 September 1999 shows the same
area a month after the quake. Normal and parallel components of baseline for
this image pair are 121.640m and 67.725m respectively.
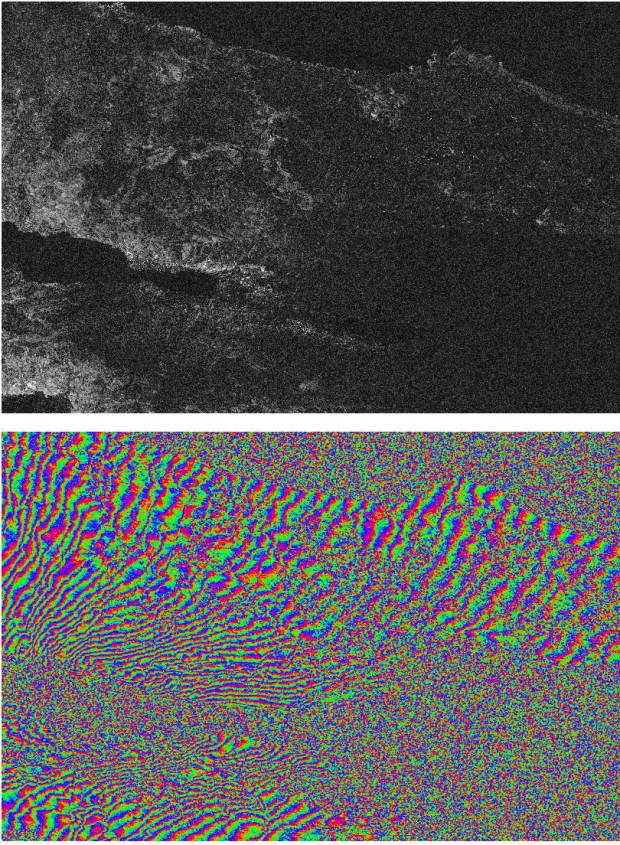
Image 28: Top image is
the coherence image generated from the SLCI ERS-SAR images of 12 August 1999
and 16 September 1999. The bottom image is the phase image generated from the
same image pairs.
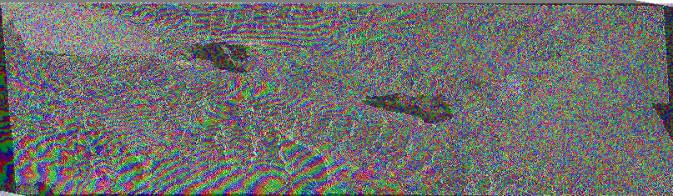
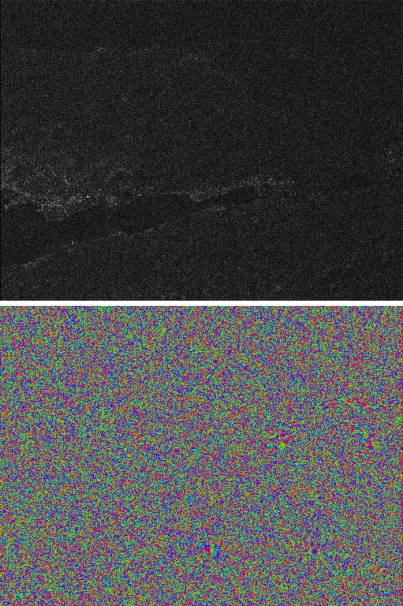
Image 29: This image is generated by mapping
the phase image of the Image 28 on the coherence image.
Image 30: Top image is
the coherence image generated from the SLCI ERS-SAR images of 24 April 1999 and
10 September 1999. The bottom image is the phase image generated from the same
image pair.
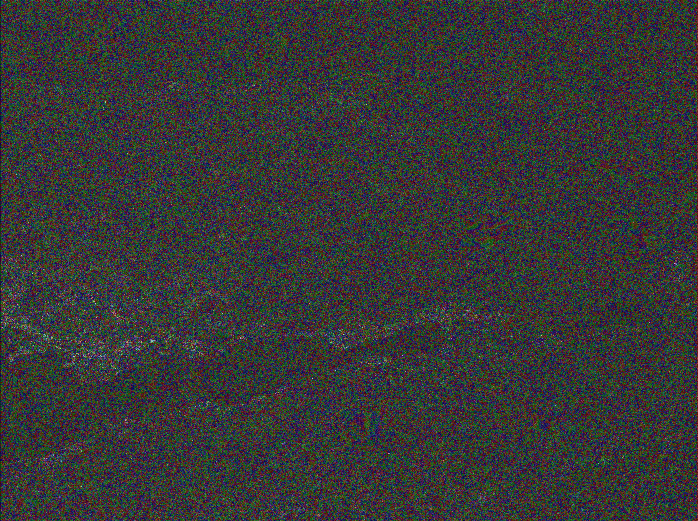
Image 31: This image is
generated by mapping the phase image of the Image 30 on the coherence image.
Image 30
consists of two images including the coherence image on top and phase image in
bottom.
These
images are generated from the SLCI ERS-SAR images of 24 April 1999 and 10
September 1999. First image is collected by ERS-2 while the second image is
acquired by ERS-1. Normal and parallel components of baseline for this image
pair are 387.704m and 189.965m respectively. The high normal or perpendicular
baseline causes an unfavorable coherence and phase image. In the Image 31 the
phase image of the Image 30 is mapped on the coherence image. SAR image of 24
April 1999 shows the area nearly 4 months before the quake and the image of 10
September 1999 shows the same area 24 days after the quake.
Image 32
consists of three images including the coherence image on top and phase image
in the middle and the corresponding interferogram in the bottom. These images
are generated from the SLCI ERS-SAR images of 24 December 1998 and 25 August
1999. First image is acquired by ERS-2 while the second image is collected by
ERS-1. Normal and parallel components of baseline for this image pair are
40.850m and 118.674m respectively. There is a good correlation between the two
premier SLCI images and this can be seen from the coherence as well as the
phase image clearly. SAR image of 24 December 1998 shows the area nearly 8
months before the quake and the image of 25 August 1999 shows the same area
only 9 days after the quake. The horizontal surface displacement due to the
earthquake is the evident characteristic of the Image 32 that is reflected by
fringes.
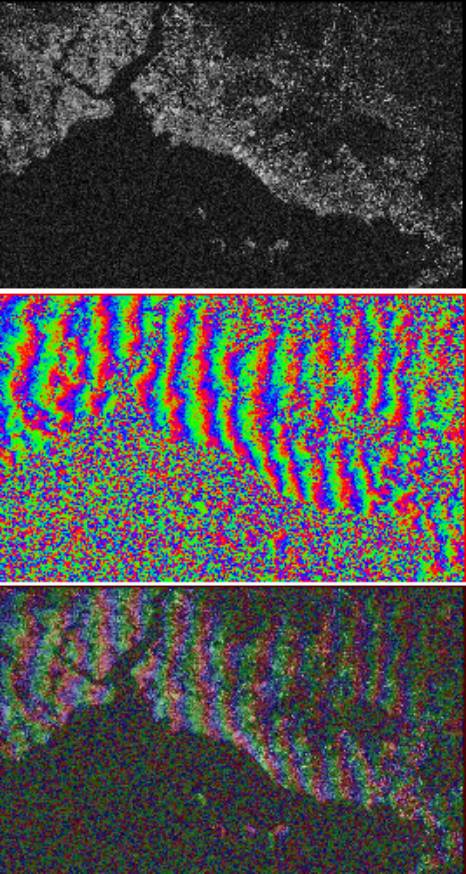
Image 32: Top image is
the coherence image generated from the SLCI ERS-SAR images of 24 December 1998
and 25 August 1999. The middle image is the phase image generated from the same
image pair. Mapping the phase image on the coherence image generates the bottom
image.
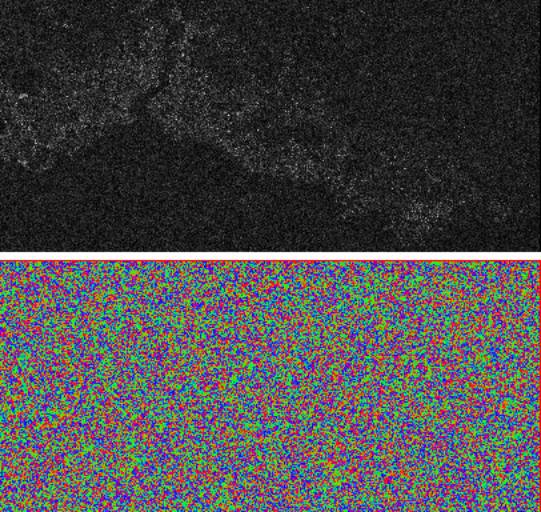
Image 33: Top image is
the coherence image generated from the SLCI ERS-SAR images of 24 December 1998
and 26 August 1999.
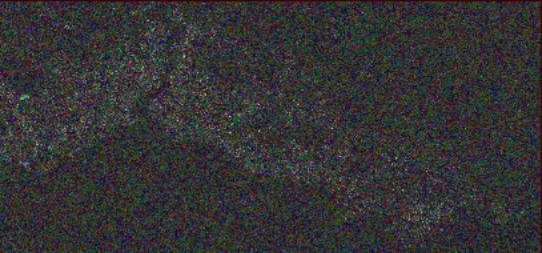
Image 34: This image is
the phase image of Image 33 mapped on coherence image.
Image 33
consists of two images including the coherence image on top and phase image in
bottom. These images are generated from the SLCI ERS-SAR images of 24 December
1998 and 26 August 1999. Both images are collected by ERS-2. Normal and
parallel components of baseline for this image pair are 410.853m and 21.891m
respectively. The high normal baseline causes a disqualified coherence and
phase image. In the Image 34 the phase image of the Image 33 is mapped on the
coherence image.
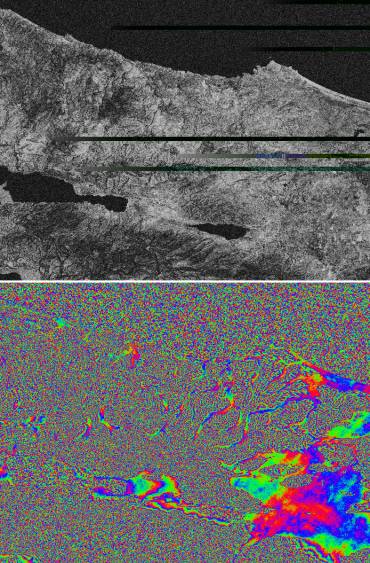
Image 35
consists of two images including the coherence image on top and phase image in
bottom. These images are generated by geocoded projection mode from the SLCI
ERS-SAR tandem images of 12 and 13 August 1999. The image of 12 August is
collected by ERS-1 while the other image is acquired by ERS-2. Normal and
parallel components of baseline for this image pair are 224.190m and 91.097m
respectively. The correlation in the coherence image except for the areas
around the Izmit Bay and east of the Lake Sapanca is considerable. The phase
image shows this apparently. This may
be interpreted as the sign of early surface disturbances started prior to the
earthquake main shocks. In the Image 36 the phase image of the Image 35 is mapped
on the intensity image of the image of August 12. Image 37 shows the height
image or the DEM of the area.
Image 35: Top image is
the coherence image generated from the SLCI ERS-SAR tandem images of 12 and 13
August 1999.
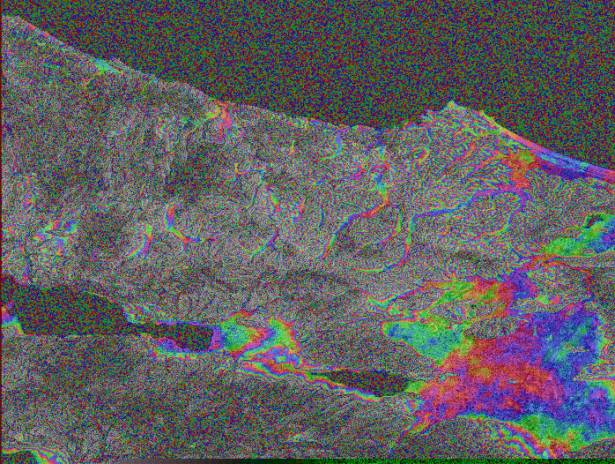
Image 36: This image is generated by
mapping the phase image of the Image 35 on the intensity image.
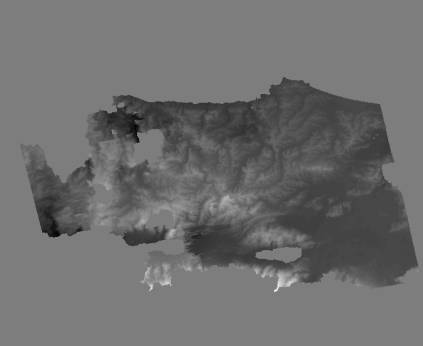
Image 37: The height
image of the tandem images of 12 and 13 August 1999.
Image 38 consists of two images including the coherence
image on top and phase image in bottom. These images are generated by geocoded
projection mode from the SLCI ERS-SAR tandem images of 10 and 11 September
1999. Both the images are collected by ERS-1. Normal and parallel components of
baseline for this image pair are 182.313m and 73.239m respectively. The
decorrelation in the coherence can be distinguished in the areas around the
Izmit Bay and east of the Lake Sapanca. The phase image shows this apparently.
This is a point for further investigation that whether this decorrelation is
due to the shocks occurred during the later days. In the Image 39 the phase
image of the Image 38 is mapped on the intensity image of the image of
September 10. Image 40 shows the geocoded interferogram and image 41 shows the
height image of the area.
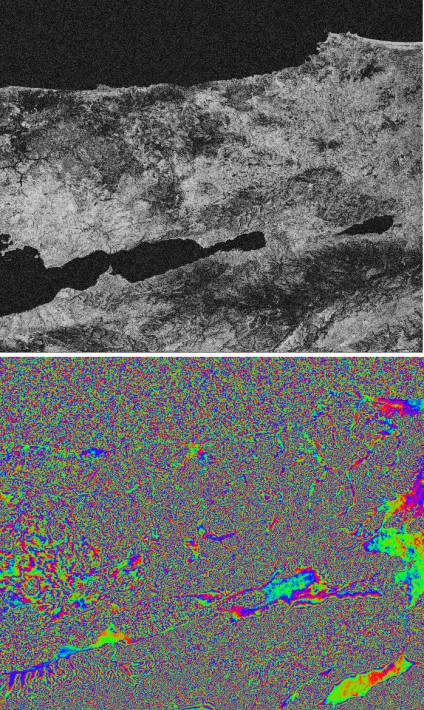
Image 38: Top image is
the coherence image generated from the SLCI ERS-SAR tandem images of 10 and 11
September 1999.
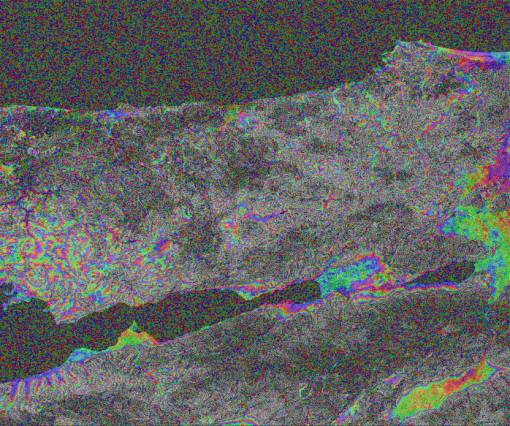
Image 39: This image is
generated by mapping the phase image of the Image 38 on the intensity image.
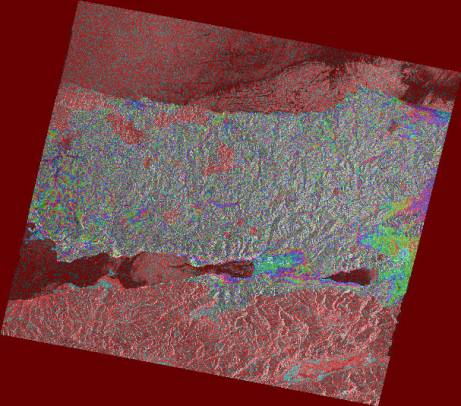
Image 40: This image is
the geocoded interferogram of the Image 38.
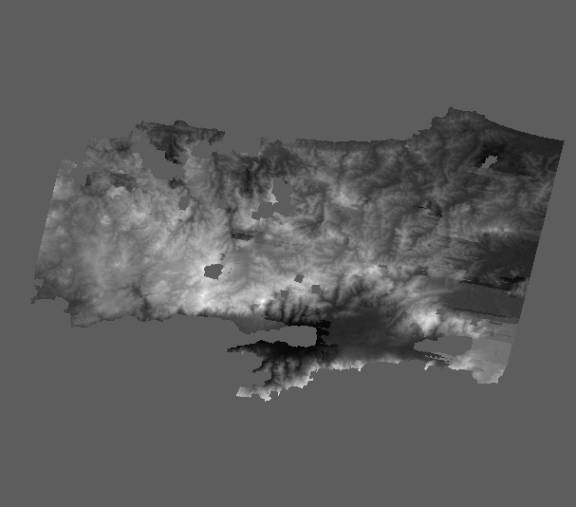
Image 41: The height
image generated from the tandem images of 10 and 11 September 1999.
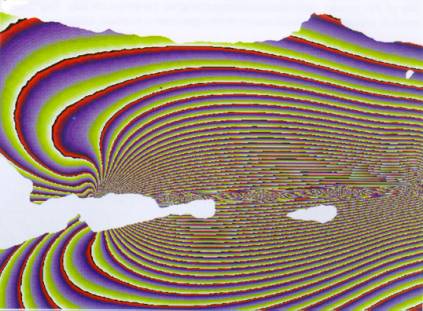
Image
42: theoretical
deformation model for the area struck by the quake, which is derived from
geophysical data (source ESA).
INFORMATION
ANALYSIS
The data
applied to generate SAR differential interferograms show ground surface
deformation in an area extending from Istanbul to the east of Lake Sapanca. The
density of the fringes is proportional to the degree of change and consequently
the rate of damage caused by the earthquake. Results derived from phase
interferograms show the consistency of the outputs with the theoretical
deformation model, which is derived from geophysical data (Image 42). According
to the geophysical data interpretation the rupture occurred along an east-west
trending strike-slip fault that caused a predominant horizontal displacement of
the ground surface. In the case of Izmit quake 36 fringes can be counted in the
northern area of Izmit Bay in Kocaeli Province and 24 fringes in the northern
area. This means that along the northern area there is 100.8cm displacement and
67.2cm displacement in southern area in the satellite s viewing direction. The
horizontal component of these displacements can be computed simply given the viewing
incidence angle of ERS satellites that is a fixed amount of 23 degrees. The
direction of the horizontal displacements in two sides of the rupture is
apparent.
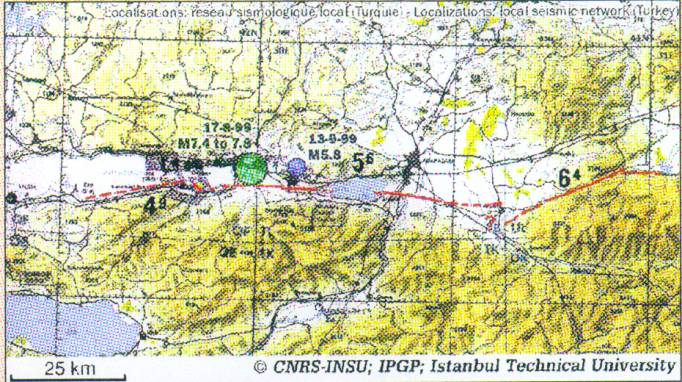
Image 43: Fault map of the study area.
Comparison of the TM data of region
before and after the quake supports the acquired information from SAR
interferometry for precise validation. However, this requires to be combined
with parameters such as topographic, land-cover and land-use maps, for correct
estimates. Investigating and detecting the eventual changes on the region using
the image processing systems provides the data for incorporation to a GIS that
shows the potent places.
Change detection of the area devastated by the quake using two Landsat
TM imagery of the area before and after the quake reveals interesting
differences. One of these changes can be attributed to the water transgression
in a vast area 0.605sq.km in the northern coast of Izmit Bay next to Derince.
While the TM image before the quake goes to 27 March 1999, the second image
shows the Izmit area a day after quake.
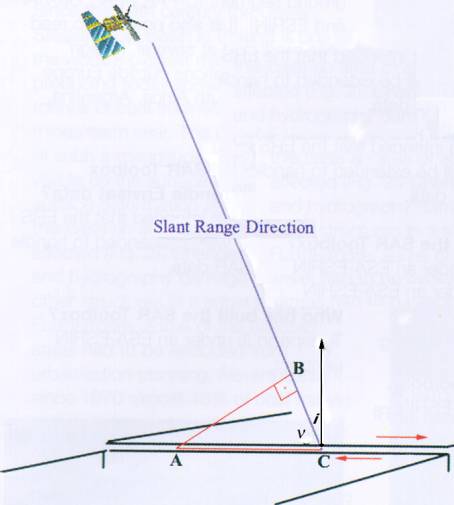
Image
43: In the case of
Izmit quake since it was almost horizontal movement that occurred in east-west
direction parallel to satellite’s observation, one observation is sufficient to
define the spatial displacement vector. The geometry is seen above. From the
image calculating cos v gives the surface displacement, where v=67 deg. and BC
is the displacement in satellite’s direction.
Using
SAR interferometry the displacement originated by earthquakes can be qualified.
To define the spatial displacement vector generally three measurements are
needed. Consequently three interferograms from different viewing angles are
required. Practically SAR data from ERS ascending and descending passes would
provide two of the three interferograms. Both historical data and tectonic
analysis of the area may retrieve the third observation. However, in the case
of Izmit quake since it was almost horizontal movement that occurred in
east-west direction parallel to satellite’s observation direction, one
observation is sufficient. The displacement in the northern area is derived to
be 258cm whereas it is 167cm in the southern area.
Alternatively,
satellite orbit has a key role in successful application of SAR interferometry.
Better results for differential interferometry highly depends on the smaller
separation between two observations that means a smaller normal baseline.
Generally a normal baseline larger than 400m is usually not suitable for
interferometry due to decorrelation or sampling the slopes. On the other hand
the baselines smaller than 40m may not be suitable for DEM generation since
slopes will be undersampled. But this data will be very good for differential
interferometry where height information is to be removed. Small baselines are
optimal to preserve the coherence while in this case the influence of the
ground topography in the interferogram becomes negligible. These statements
were proved in the Izmit case study. The altitude color-coded and shaded
digital elevation maps generated from ERS image pairs show the morphological
and tectonic features in the area.
However,
It has been appeared that short-term variations in the atmosphere and
ionosphere can sometimes alter the fringe pattern. Changes in the earth surface
properties can also induce the shift of interference fringes, even though the
ground does not move actually. Such effects can complicate the interpretation
of radar interferograms. But on the other hand these secondary influences
represent features of the earth that are also of interest.
PROMISING
RESULTS
The
results of such a study help to establish an estimation model. Although the
results are still need to be tested and proved by sufficient ground truth data,
considerable interest is seen in the results of the project. They can be used
for sustainable development of region and risk management as well. Recommending
the instructions based on the results of the project to the respective
authorities, they can take convenient and informed actions that may prevent the
damages or reduce the effects and losses. The users of these results would be
governmental and non-governmental organizations involved in the application of
lands and natural resources for the issues such as land use planning, resource
and environmental management, risk management as well as the relevant research
and investigation programs.
There is a wide range of SAR interferometry
applications that can be grouped into four areas including precision
calibration, elevation mapping, land deformation, and super-sensitive change detection. An increasing
number of applications have become feasible, and more are being investigated. Among the most exciting new
applications of SAR interferometry is the two-dimensional mapping of
large-scale surface deformation with very high precision. These deformation
maps are used to detect and monitor Earth disasters including land deformation
due to earthquakes, crustal movements, land slides, volcanic activity, mining
and water extraction activities. Another interesting area of research is the
use of phase coherence for classification and change detection.
Would
SAR interferometry be able to detect the early indications needed to predict
earthquakes and volcanic activities? None can be sure on this yet and presently
it is an unrealistic matter but the hopes grow day by day. In scientific
research each new tool reveals unprecedented issues that disclose crucial facts
and deepens our perception of fundamental principles. Undoubtedly SAR
interferometry does the same for the study of our solid but ever changing
planet.
SUGGESTIONS
AND EXPLANATIONS
·
Since
most of the analysis in this research has been based on the earth space data,
to validate and completion of the analysis and the final results a field check
by the investigators is needed.
·
Due
to inaccessibility of the information and records of the quakes in the region
(especially from early 1998 to 17 August 1999) the discussions and analysis
about some of the derived results from interferograms and the relevant products
is tentative. This can be improved by a field check.
·
The
geological and structural information on the region was not sufficiently
accessible and as a result for consistency of the outputs with the region’s
tectonic when it was needed, the investigators have been acted conservatively
and generally to avoid the errors.
·
Although
the investigators are convinced that the results of this research to achieve a
prediction model is not sufficient, they believe that implementing the studies
such as the present study based on continuos satellite monitoring and
comparison of the different interferograms and integration of the results with
other related tectonic, seismologic and geophysical data of any quake prone
area in the world would make this possible.
·
Due
to the systematic and unforeseen problems and limitations during the term of
the implementation of the project the investigators didn’t succeed to
sufficiently and profoundly work out some cases and matters. Consequently they
believe that further work and study should be carried out in this concern to
find more supporting evidences for the project. In this regard they appreciate
and welcome any further assistance and support from the relevant and interested
people and organizations.
ACKNOWLEDGEMENT
The investigators give their kindest thanks to ESRIN and ESA for
providing them with the needed data and software for the project as well as
IRSC for providing the required hardware, software and continued supports.
Investigators
biography

Parviz Tarikhi, born in 1960, is a
researcher specializing in space science and technology based in Iran. He
received the B.Sc. degree in Atomic Physics from Tehran University in 1991, and
M.Sc. degree in physics from the Knightsbridge University, UK in April 1999.
Presently he is a distance learning scholar for a Ph.D. degree in physics with
Knightsbridge University, UK.
Working in the Iranian
Remote Sensing Center since 1992, he has been involved in the research and
development issues and projects of the applications of space science and
technology.
His present research
interests include holography for 3-D modeling of the land features and SAR
interferometry for estimating the surface displacements and change detection.

Mohammed Morabi, born in 1956, is a Remote
Sensing technology application specialist in the Geology, Marine and Water
Resources Division in the Iranian Remote Sensing Center. He received a B.Sc. degree in Geology
from Tabriz University in 1987, and M.Sc. degree in Geology from Idaho State
University, USA in 1981.
His present research
interests include sea surface temperature, ocean color study, water pollution
as well as geological dynamic studies through space radar interferometry.