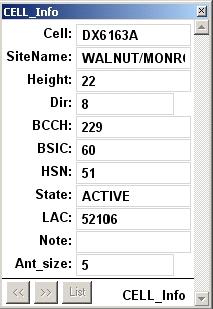
CELL ("sector") on the map, having Latitude, Longitude, Azimuth, and Antenna
Bandwidth of your "real" cell.
- Finding a Cell (current window is centered around the cell that you chose),
- Setting size of all cells in current Map window to a specified value (no more "dwarfs" on your map),
- Colouring cells in window having a specified BCCH, BSIC, HSN or LAC value,
- Colouring selected ("serving") cell and neighboring cells according to a file containing all cell relations
(with detection of eventual co-BCCH in serving and neighboring cells),
- Presentation of BCCH, BSIC, HSN or LAC values directly on the map,
- Easy moving and rotation of selected cell (try that in other RF planning/Optimization programs :)
- Creating new cells and deleting selected cell,
- Easy manual updating of BCCH, BSIC, HSN, LAC, STATE data (cell by cell).
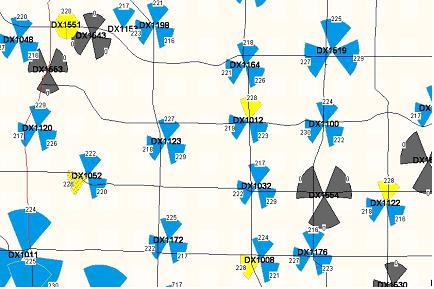
(Active cells are coloured Blue, halted and planned cells are coloured Grey, according to STATE info field)
- Automatic updating of BCCH, BSIC, HSN, LAC, STATE values from OSS output text files,
for all cells. (This is currently available for Ericsson's OSS, customization for other
manufacturers is available upon request).
- Automatic updating of all Neighbor Relations from an OSS output text file (Ericsson only),
- Generation of CELL graphical objects using data from text file (Lat, Lon, Azimuth, Ant. BW) ,
- Presentation of statistical indicators (numerically and graphically), on the map.
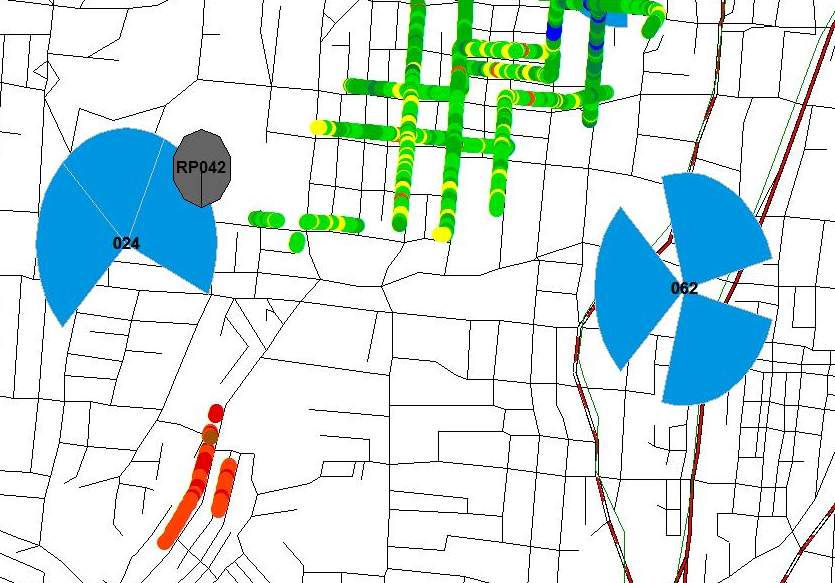
- Custom presentation of drive-test results: having a specific BCCH frequency, pair BCCH/BSIC
(scanning) or belonging to a specified cell (calls). For calls, the folowing can be shown:
Received signal strength, Received BCCH signal strength, RX Quality, MS Power Control value,
C to A ratio (upper or lower), Handovers, Dropped Calls.
Custom presentation of drive-test results is very usefull when troubleshooting cells,
detecting an interferer, checking the serving area of a cell, detecting coverage holes,
searching for a clean frequency, etc.
One can observe an unexpected serving area with low signal strength (red samples).