La nostra misura (prova 3)
Al fine di migliorare il fit dei dati sperimentali si è proposta e realizzata una piccola modifica al generatore e sfasatore di impulsi ad onda quadra (ROTATOR). Attualmente dunque, il ROTATOR può funzionare sia con il vecchio oscillatore interno sia con un oscillatore esterno programmabile: le due posizioni (int/ext) sono selezionabili dal pannello frontale mediante un deviatore a levetta. Si è inoltre istallato un piccolo circuito di protezione (a diodi) tra l'oscillatore esterno e l'ingresso al circuito sfasatore del ROTATOR, in modo da proteggere gli integrati da eventuali tensioni negative che possono provenire dal generatore esterno. Per effettuare la misura di elettrorotazione si imporrà al generatore esterno di inviare, in ingresso al circuito sfasatore del ROTATOR ,(che altro non è che un divisore di frequenza di segnali) un segnale ad onda quadra di 12 V di ampiezza picco-picco, simmetrico, non rispetto a 0 V ma a 6 V (ciò è stato fatto per evitare che tensioni negative raggiungano gli integrati danneggiandoli). Tale segnale transitando nel circuito sfasatore (4 flip-flop di tipo D) subirà uno splitting : si produrranno 4 segnali sfasati tra loro di 1/4 di periodo che, tramite dei buffer pilota integrati (TTL) e dei condensatori di blocco per la continua, verranno forniti ai 4 elettrodi della cella generando il campo rotante (su ogni elettrodo vi sarà un segnale ad onda quadra che avrà una frequenza 4 volte più piccola di quella selezionata dalla manopola dell'oscillatore esterno). Si capisce subito l'utilità di avere a disposizione per l'esperienza un generatore di impulsi esterno: con questa soluzione infatti, non si avranno solo a disposizione le 12 frequenze poc'anzi indicate (vedi ultima tabella) in corrispondenza delle 12 posizioni fisse del selettore del ROTATOR (di cui solo 6 efficaci ai fini della misura di E.R.) , ma tutta una serie (continuo) di frequenze da 0 Hz fino alla massima frequenza applicabile agli elettrodi (che è 1/4 della massima frequenza generabile dall'oscillatore esterno per via dello sfasamento). Nella fattispecie siamo andati ad incrementare le misure in frequenza (e quindi il numero di punti sul grafico) nella zona dove si ha il primo picco di dispersione in modo da poter stimare con un minore errore la frequenza fc1 e da qui la capacità e la permittività di membrana .
|
FREQUENZA (HZ) |
ERRORE SU FREQUENZA (HZ) |
MISURA 1 (S) |
MISURA 1 (HZ) |
MISURA 2 (S) |
MISURA 2 (HZ) |
|
1950 |
50 |
22.73 |
-0.044 |
14.49 |
-0.069 |
|
3900 |
100 |
9.9 |
-0.101 |
10.64 |
-0.094 |
|
5500 |
150 |
7.19 |
-0.139 |
8 |
-0.125 |
|
7810 |
120 |
5.81 |
-0.172 |
5.18 |
-0.193 |
|
10000 |
200 |
4.26 |
-0.235 |
4.63 |
-0.216 |
|
12000 |
300 |
4.15 |
-0.241 |
3.82 |
-0.262 |
|
15600 |
240 |
3.42 |
-0.292 |
3.3 |
-0.303 |
|
20000 |
400 |
3.21 |
-0.312 |
3.22 |
-0.311 |
|
25000 |
300 |
3.17 |
-0.315 |
3.21 |
-0.312 |
|
31200 |
500 |
3.26 |
-0.307 |
3.62 |
-0.276 |
|
40000 |
800 |
3.38 |
-0.296 |
3.47 |
-0.288 |
|
50000 |
1300 |
4.08 |
-0.245 |
3.91 |
-0.256 |
|
62400 |
800 |
5.26 |
-0.19 |
5.05 |
-0.198 |
|
75000 |
1100 |
5.92 |
-0.169 |
5.71 |
-0.175 |
|
100000 |
2000 |
7.04 |
-0.142 |
6.13 |
-0.163 |
|
125000 |
3100 |
8.93 |
-0.112 |
7.69 |
-0.13 |
|
150000 |
2200 |
9.9 |
-0.101 |
8.77 |
-0.114 |
|
250000 |
3100 |
18.87 |
-0.053 |
12.2 |
-0.082 |
|
MISURA 3 (S) |
MISURA 3 (HZ) |
MISURA 4 (S) |
MISURA 4 (HZ) |
MISURA 5 (S) |
MISURA 5 (HZ) |
MISURA 6 (S) |
MISURA 6 (HZ) |
|
17.24 |
-0.058 |
23.81 |
-0.042 |
15.15 |
-0.066 |
15.62 |
-0.064 |
|
8.93 |
-0.112 |
9.71 |
-0.103 |
8.77 |
-0.114 |
13.89 |
-0.072 |
|
6.85 |
-0.146 |
6.67 |
-0.150 |
7.52 |
-0.133 |
7.30 |
-0.137 |
|
6.06 |
-0.165 |
5.05 |
-0.198 |
5.75 |
-0.174 |
5.21 |
-0.192 |
|
4.39 |
-0.228 |
4.67 |
-0.214 |
4.24 |
-0.236 |
4.57 |
-0.219 |
|
3.91 |
-0.256 |
4.12 |
-0.243 |
4.26 |
-0.235 |
3.79 |
-0.264 |
|
3.75 |
-0.267 |
3.32 |
-0.301 |
3.47 |
-0.288 |
3.39 |
-0.295 |
|
3.48 |
-0.287 |
3.18 |
-0.314 |
3.11 |
-0.322 |
3.27 |
-0.306 |
|
3.46 |
-0.289 |
3.21 |
-0.312 |
3.13 |
-0.319 |
3.16 |
-0.316 |
|
3.52 |
-0.284 |
3.34 |
-0.299 |
3.46 |
-0.289 |
3.28 |
-0.305 |
|
3.77 |
-0.265 |
3.37 |
-0.297 |
3.47 |
-0.288 |
3.44 |
-0.291 |
|
4.37 |
-0.229 |
4.27 |
-0.234 |
4.35 |
-0.230 |
4.15 |
-0.241 |
|
5.71 |
-0.175 |
4.98 |
-0.201 |
5.15 |
-0.194 |
5.32 |
-0.188 |
|
6.06 |
-0.165 |
5.46 |
-0.183 |
5.65 |
-0.177 |
5.49 |
-0.182 |
|
6.45 |
-0.155 |
6.99 |
-0.143 |
5.75 |
-0.174 |
6.17 |
-0.162 |
|
9.62 |
-0.104 |
8.62 |
-0.116 |
8.47 |
-0.118 |
7.63 |
-0.131 |
|
9.01 |
-0.111 |
9.62 |
-0.104 |
9.52 |
-0.105 |
11.76 |
-0.085 |
|
15.87 |
-0.063 |
17.54 |
-0.057 |
15.38 |
-0.065 |
13.51 |
-0.074 |
|
MISURA 7 (S) |
MISURA 7 (HZ) |
MISURA 8 (S) |
MISURA 8 (HZ) |
MISURA 9 (S) |
MISURA 9 (HZ) |
MISURA 10 (S) |
MISURA 10 (HZ) |
|
15.15 |
-0.066 |
17.54 |
-0.057 |
20.41 |
-0.049 |
16.39 |
-0.061 |
|
12.05 |
-0.083 |
10.53 |
-0.095 |
9.01 |
-0.111 |
11.76 |
-0.085 |
|
6.54 |
-0.153 |
7.46 |
-0.134 |
8.13 |
-0.123 |
7.04 |
-0.142 |
|
6.02 |
-0.166 |
5.92 |
-0.169 |
5.71 |
-0.175 |
5.46 |
-0.183 |
|
4.41 |
-0.227 |
4.59 |
-0.218 |
4.33 |
-0.231 |
4.27 |
-0.234 |
|
3.89 |
-0.257 |
4.02 |
-0.249 |
3.88 |
-0.258 |
3.72 |
-0.269 |
|
3.66 |
-0.273 |
3.27 |
-0.306 |
3.4 |
-0.294 |
3.58 |
-0.279 |
|
3.24 |
-0.309 |
3.34 |
-0.299 |
3.28 |
-0.305 |
3.17 |
-0.315 |
|
3.19 |
-0.313 |
3.1 |
-0.323 |
3.34 |
-0.299 |
3.17 |
-0.315 |
|
3.36 |
-0.298 |
3.47 |
-0.288 |
3.4 |
-0.294 |
3.22 |
-0.311 |
|
3.66 |
-0.273 |
3.5 |
-0.286 |
3.4 |
-0.294 |
3.72 |
-0.269 |
|
4.22 |
-0.237 |
4.02 |
-0.249 |
4.33 |
-0.231 |
4.27 |
-0.234 |
|
5.21 |
-0.192 |
5.59 |
-0.179 |
4.83 |
-0.207 |
4.95 |
-0.202 |
|
6.29 |
-0.159 |
6.1 |
-0.164 |
5.85 |
-0.171 |
5.65 |
-0.177 |
|
6.41 |
-0.156 |
6.71 |
-0.149 |
6.37 |
-0.157 |
6.13 |
-0.163 |
|
8.2 |
-0.122 |
8.26 |
-0.121 |
8.77 |
-0.114 |
7.58 |
-0.132 |
|
11.36 |
-0.088 |
8.7 |
-0.115 |
8.93 |
-0.112 |
11.9 |
-0.084 |
|
12.99 |
-0.077 |
12.66 |
-0.079 |
12.35 |
-0.081 |
20.41 |
-0.049 |
|
FREQUENZA (HZ) |
ERRORE SU FREQUENZA (HZ) |
MEDIA FREQ. ROTAZ. (HZ) |
DEV. STANDARD (HZ) |
|
1950 |
100 |
-0.058 |
0.010 |
|
3900 |
200 |
-0.097 |
0.014 |
|
5500 |
280 |
-0.138 |
0.010 |
|
7810 |
400 |
-0.179 |
0.012 |
|
10000 |
500 |
-0.226 |
0.008 |
|
12000 |
600 |
-0.253 |
0.011 |
|
15600 |
800 |
-0.290 |
0.013 |
|
20000 |
1000 |
-0.308 |
0.010 |
|
25000 |
1250 |
-0.311 |
0.010 |
|
31200 |
1600 |
-0.295 |
0.011 |
|
40000 |
2000 |
-0.285 |
0.012 |
|
50000 |
2500 |
-0.239 |
0.009 |
|
62400 |
3100 |
-0.193 |
0.010 |
|
75000 |
3750 |
-0.172 |
0.008 |
|
100000 |
5000 |
-0.156 |
0.010 |
|
125000 |
6200 |
-0.120 |
0.009 |
|
150000 |
7500 |
-0.102 |
0.012 |
|
250000 |
12400 |
-0.068 |
0.012 |
Riepiloghiamo in una tabella i risultati ottenuti nelle tre prove
|
PROVA 1 |
PROVA 2 |
PROVA 3 |
|
|
fc1 (Hz) |
10584±251 |
12928±586 |
23778±374 |
|
R1 (Hz) |
-0.360±0.005 |
-0.244±0.006 |
-0.312±0.003 |
|
C (mF/m2) |
8.3±0.4 |
6.8±0.5 |
3.7±0.2 |
|
100*DC/C= =(Dse/se +Dr/r+Dfc1/fc1)*100 |
0.4% + 2.3% + 2.4% = 5.1% |
0.4% + 2.3% + 4.5% = 7.2% |
0.4% + 2.3% + +1.6% = 4.3% |
|
e' |
4.6±0.2 |
3.8±0.3 |
2.1±0.1 |
Tutte e tre le prove risultano compatibili con i dati di letteratura.
COSA SI PUO' ANCORA MIGLIORARE…
Pur avendo già raggiunto un buon risultato è possibile sicuramente migliorare ancora l'apparato di E.R. . Il nostro suggerimento si indirizza su una duplice strada:
verso gli elettrodi della cella: infatti i 4 buffer integrati non ce la fanno a pilotare tali segnali così veloci. Un suggerimento potrebbe essere rappresentato dalla sostituzione dei buffer integrati MAX4427 con veloci interruttori a FET(field effect transistor).
contenute (anche in spessore) di quelli attuali al fine di garantire l'uniformità del campo in
un'ampia regione di spazio. Si potrebbero ad es. scavare dei microsolchi su vetrini in modo poi
da depositarvici delle microcolate di conduttori particolarmente malleabili (es oro, platino ecc.).
Andrebbe poi valutata la sezione del microsolco, le conducibilità dei materiali ecc. affinchè il
tutto dia un buon compromesso ed una buona affidabilità dell'apparato (a tale proposito si
vedano le soluzioni, indicate qui di seguito dai ricercatori dell'università di Glasgow e di
Bangor).
COSA FANNO GLI ALTRI…
Di seguito vengono riportati alcuni articoli riguardanti l'applicazione dell'elettrorotazione in campo biologico (comportamento degli eritrociti umani, comportamento di cellule infette da virus HSV1(herpes virus 1) ecc.), in campo biochimico (tecnica degli anticorpi in associazione all'elettrorotazione ERA), in campo della prevenzione ambientale (controllo delle acque potabili nei confronti di agenti patogeni quali il Cryptosporidium);
iniziamo presentando alcune tecniche di realizzazione di nanocelle di misura in dotazione all'università di Glasgow.
BIOSENSORS FOR CELL SIGNALLING
J.M. Cooper
Over the last 10 years, research and development in bioelectronics has led to new techniques for using materials normally associated with the electronics industry in order to study biological phenomena. Perhaps the most striking example has been the development of biosensors. In order to fabricate these small diagnostic devices, it is necessary to modify a transducer surface (e.g. an electrode or a waveguide) with a biological molecule (e.g. an enzyme or an antibody) such that any degree of molecular recognition between the biological molecule and a sensed species will be communicated as a signal.
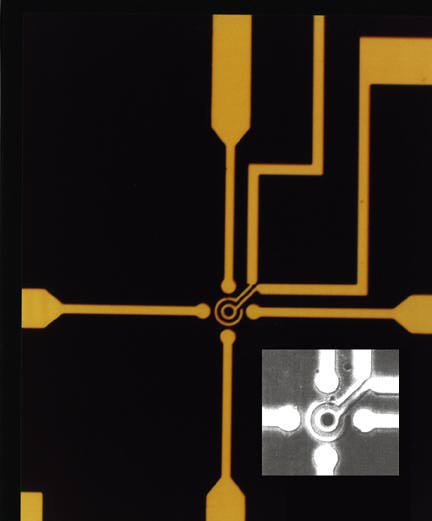
Arrays of sensors: 200 nm gold rimg electrodes on a silicon substrate.
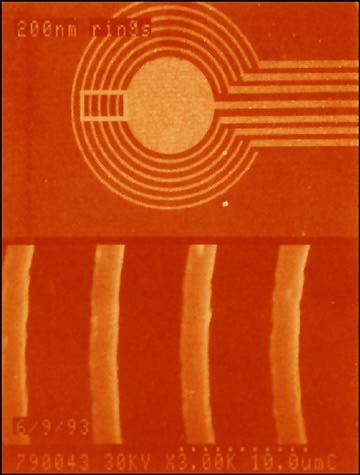
An example is shown in this figure which is a device made of 200 nm gold ring electrodes fabricated on a silicon substrate, indicating the potential use of nanotechnology for bioelectronics (see for example Cell Signalling). In the test pattern shown, the central gold circle acts as a model cell and can be used to electrochemically generate radicals.
Several projects are being pursued, including enzyme immobilisation in conducting polymers on ultra-microelectrodes, surface plasmon resonance sensing, microelectronic protein patterning, surface biocompatibility treatments, and the development of integrated electrochemical and optical immunosensors. Nanotechnology is particularly suited to this area since the dimensions of fabricated structures and of biological molecules are of the same order of magnitude; arrays of nanoelectrodes have been developed in the group and have been used to examine the molecular basis for electron transport processes between redox proteins and metal surfaces .
One example is the study of Electron transport processes between proteins and electrodes which has provided an elegant model for the modification of electrodes in order to investigate bio-electrochemical reactions at electrode surfaces. The process is therefore of fundamental interest in the design of a new generation of biosensors with faster response times.
The molecular organisation between enzymes and their substrates requires an understanding of their interactions in terms of charge-matching, spatial fitting and hydrogen bonding, and accounts for a mechanism by which electron transport between proteins can be observed at modified metals. In particular, self assembling charged monolayers at gold surfaces have been used at Glasgow to provide a template for proteins. Once "docked" in the correct molecular orientation, the molecules can be immobilised and studied using electroanalytical techniques to measure a variety of energetic and kinetic characteristics.
Research in this area has also investigated the use of conducting polymers which can be electrochemically deposited from solution onto electrodes. These polymers have diode-like characteristics in that they are conducting in their oxidised state and insulating in their reduced state. It has been found that biological molecules can be incorporated into these conducting polymers during the polymerisation process to provide a possible mechanism for localising proteins at a microelectrode. If the correct polymers are used, there is the possibility of creating a bioelectronic interface by providing molecular wires between the electrode and the biomolecular material.
Novel polymers are being synthesised within the Department of Chemistry, based upon polypyrrole and polythiophene which contain analogues of naturally occurring amino acids. These materials are capable of mimicking the enzyme's natural biological environment, and will ultimately lead to the development of 'solid state' bioelectronic interfaces. Faster biosensors will result, ultimately leading to the fabrication of a new generation of molecular sensors.
The combination of integrated silicon technology, semi-conductor fabrication processes and bio-electrochemistry has made it possible to develop highly specific, sensitive, and accurate micro-biosensors. Such sensors consist of biological material immobilised at a metal electrode and are capable of converting a biological signal into a quantitative response. Research is now in progress in the development of sub-µm sized electrodes that can be positioned in close proximity to individual cells in order to measure their responses to drugs and hormones.
A fundamental programme of research in Glasgow aims to investigate the role of the superoxide in cell biology. Superoxide has previously been shown to participate in a wide range of pathological processes such as arthritis and heart disease. It has also been demonstrated that cells produce this chemical naturally and that it has a benign role, possibly as a messenger. Until recently, it has not been possible to measure superoxide directly, and its biological effect has only been inferred by measuring (presumed) by-products of its activity. Research in collaboration with the University of Newcastle upon Tyne has resulted in the development of a specific biosensor which can attribute superoxide production to particular cellular systems.
Arrays of these sensors (see picture) (<1 µm) are being fabricated using electron beam lithography in the Department's Ultra-Small Structures Laboratories, and are being modified with biological material in order to measure highly specific signals that are produced by cells as part of the human antibody defence mechanism. By collaborating with a hospital clinical laboratory, the role of the immune system in rheumatoid arthritis is being addressed. The research is being carried out in parallel with projects involving dielectrophoresis (see later), in the hope that it will be possible to move individual cells within electric fields into an array of microbiosensors. This project is funded by the Medical Engineering and Sensors Committee of EPSRC, and illustrates the impact that biosensors have had on the research techniques available to the biomedical sciences.
A single latex bead with a diameter of 6 µm trapped using dielectrophoresis within an array of ring electrodes. The bead is a good physical model for a cell for these preliminary experiments.
There are two complementary collaborations on cell signalling. Work with the Wellcome Institute of Surgery, University of Glasgow, is underway to measure glutamate within the cortex of the brain during traumatic injury and involves problems of biocompatibility when implanting a sensor during neurosurgery. It is hoped to use information obtained to test the efficacy of new drugs to limit brain damage in post traumatic injury. In addition, a joint programme with the Department of Cell Biology, University of Liverpool, and funded by the Wellcome Foundation, involves measuring markers for heart disease in cultured heart cells to monitor the affect of new drugs.
Electrorotation of Single Yeast Cells at Frequencies Between 100 Hz and 1.6 GHz
Ralph H[ouml]lzel
Institut f[uuml]r Biophysik der Freien Universit[auml]t Berlin, 14195 Berlin, Germany
ABSTRACT The determination of complete electrorotation spectra of living cells has been made possible by the development of a quadrature generator and an electrode assembly that span the frequency range between 100 Hz and 1.6 GHz. Multiple spectra of single cells of the yeast Saccharomyces cerevisiae have been measured at different medium conductivities ranging from 0.7 to 550 [mu]S cm-1. A spherical four-shell model was applied that simulated the experimental data well and disclosed the four-layer structure of the cell envelope attributed to the plasma membrane, the periplasmic space, and a thick inner and a thin outer wall region. Below 10 kHz an additional rotation effect was found, which changed its direction depending on the ionic strength of the medium. This is supposed to be connected with properties of the cell surface and its close vicinity. From the four-shell simulation the following physical properties of cell compartments could be derived: specific capacitance of plasma membrane (0.76 [mu]F cm-2), periplasmic space (0.5 [mu]F cm-2), and outer wall region (0.1 [mu]F cm-2). The conductivity of cytoplasm, plasma membrane, and inner wall region were found to vary with medium ionic strength from 9 to 12 mS cm-1, 5.8 nS cm-1 to [sim]50 nS cm-1, and 6 [mu]S cm-1 to 240 [mu]S cm-1, respectively.
Electrorotation of Colloidal Particles and Cells Depends on Surface Charge
Hannes Maier
Section Physiological Acoustics, Department of Otolaryngology, University of T[uuml]bingen, D-72076 T[uuml]bingen, Germany
ABSTRACT The importance of surface conductivity to the frequency-dependent polarizability and the rotation of particles in circular electric fields (electrorotation) is emphasized by various theoretical and experimental investigations. Although surface conductivity seems to be naturally related to the ionic double layer, there is rare experimental evidence of a direct relationship. To highlight the role of surface charges in electrorotation, an apparatus was developed with a symmetrical three-electrode arrangement for field frequencies between 25 Hz and 80 MHz. The three-dimensional electrostatic field distribution between the electrodes was evaluated numerically. With this device, rotating, gradient, and homogeneous electric fields of defined precision and homogeneity could be applied to slightly conducting suspensions. Surface properties of monodisperse latex particles ([empty] 9.67 [mu]m), carrying weak acid groups, were characterized by suspension conductometric titration. This procedure determined the amount of carboxyl groups and showed that strong acid groups were missing on the surface of these particles. To obtain the electrophoretic mobility, the spheres were separated by free-flow electrophoresis, and the [zeta]-potential was calculated from these data. Single-particle rotation experiments on fractions of specified electrophoretic mobility were carried out at frequencies between 25 Hz and 20 MHz. By analyzing the pH dependence of the rotation velocity, it could be shown that the rotation rate is determined by surface charges, both at the peak in rotation rate near the Maxwell-Wagner frequency (MWF) and at low frequencies. The inversion of the rotation direction at the MWF peak for vanishing surface charges was demonstrated. An analytical model for the double layer and dissociation on a charged surface was developed that is valid for low and high [zeta]-potentials. This model could provide convincing evidence of the linear dependence of the MWF rotation velocity on surface charge.
Dielectric Spectroscopy of Single Human Erythrocytes at Physiological Ionic Strength: Dispersion of the Cytoplasm
Jan Gimsa, Torsten M[uuml]ller, Thomas Schnelle, and G[uuml]nter Fuhr
Institute of Biology, Humboldt-University, Berlin, Germany
ABSTRACT Usually dielectrophoretic and electrorotation measurements are carried out at low ionic strength to reduce electrolysis and heat production. Such problems are minimized in microelectrode chambers. In a planar ultramicroelectrode chamber fabricated by semiconductor technology, we were able to measure the dielectric properties of human red blood cells in the frequency range from 2 kHz to 200 MHz up to physiological ion concentrations. At low ionic strength, red cells exhibit a typical electrorotation spectrum with an antifield rotation peak at low frequencies and a cofield rotation peak at higher ones. With increasing medium conductivity, both electrorotational peaks shift toward higher frequencies. The cofield peak becomes antifield for conductivities higher than 0.5 S/m. Because the polarizability of the external medium at these ionic strengths becomes similar to that of the cytoplasm, properties can be measured more sensitively. The critical dielectrophoretic frequencies were also determined. From our measurements, in the wide conductivity range from 2 mS/m to 1.5 S/m we propose a single-shell erythrocyte model. This pictures the cell as an oblate spheroid with a long semiaxis of 3.3 [mu]m and an axial ratio of 1:2. Its membrane exhibits a capacitance of 0.997 X 10⁻² F/m2 and a specific conductance of 480 S/m2. The cytoplasmic parameters, a conductivity of 0.4 S/m at a dielectric constant of 212, disperse around 15 MHz to become 0.535 S/m and 50, respectively. We attribute this cytoplasmic dispersion to hemoglobin and cytoplasmic ion properties. In electrorotation measurements at about 60 MHz, an unexpectedly low rotation speed was observed. Around 180 MHz, the speed increased dramatically. By analysis of the electric chamber circuit properties, we were able to show that these effects are not due to cell polarization but are instead caused by a dramatic increase in the chamber field strength around 180 MHz. Although the chamber exhibits a resonance around 180 MHz, the harmonic content of the square-topped driving signals generates distortions of electrorotational spectra at far lower frequencies. Possible technological applications of chamber resonances are mentioned.
Peter Eppmann , Jan Gimsa, Bernhard Prüger and Edwin Donath
Humboldt-University of Berlin, Institute of Biology, Experimental Biophysics, Invalidenstraße 42, 10115 Berlin, Germany
(Received 7 July 1995, revised 5 December 1995, accepted 21 December 1995)
PACS. 05.40.+j - Fluctuation phenomena, random processes and Brownian motion.
PACS. 82.70.-y - Disperse systems.
PACS. 87.80.+s - Biophysical instrumentation and techniques.
In recent years, electrorotation has developed in the field of biology as a technique for characterization of single cell dielectric properties. Applications to colloidal particles are scarce, although the method provides information on the electrical structure of the particle's interior. The method explores the frequency-dependent polarizability difference of the particles and the suspension medium by using rotating fields in the frequency range of 1 kHz to 200 MHz to induce individual particle rotation. To allow interpretation of the electrorotation spectra measured with light scattering techniques, the theoretical autocorrelation function of light scattered from rotating particles of cylindrical symmetry has been calculated. All particles were assumed to possess a single scattering site and the rotation axes were assumed to be parallel. An appropriate expression for the rotational diffusion around the longitudinal angle was also derived. Diffusion around the azimuthal angle could be neglected. The theoretical result consists of a well structured autocorrelation function. The theoretical limits of particle size and rotation speed that allow detection of electrorotation were explored. Experimental autocorrelation functions from electrorotation of human red blood cells could be explained theoretically when reasonable parameters for the cells' properties were assumed.
Beating the Bugs |
||||||
|
Genera Technologies has developed a fast and economic method of detecting parasites in water. Dawn Smith examines the benefits for water companies worldwide. |
|
|||||
|
Genera Technologies has pioneered a process especially designed to provide an inexpensive and rapid method for detecting two parasites, giardia and cryptosporidium. These occur in river water and can cause serious illness in humans if ingested. Cryptosporidium is particularly unpleasant. In 1994, the organism got into the drinking water in Milwaukee, USA, infecting 400,000 people. There were 120 fatalities associated with the outbreak. It was that incident that prompted Dr Adrian Parton, managing director of Genera, to develop a cheap and efficient process for detecting the organism. "Following the Milwaukee outbreak, the US Environmental Protection Agency made it mandatory for some of the larger US water companies to test for these parasites over an 18-month period, beginning in March 1996," says Dr Parton. "The problem for US water companies is that conventional technology for detecting the parasites is not very effective. It’s also extremely labour-intensive, time-consuming and expensive." |
||||||
|
|
|
|||||
Fast and Accurate TestingGenera, which specialises in technology for detecting micro-organisms, chemicals and pollutants in water, began adapting its existing technology last year to address the problem. The result is a three-stage testing process comprising sample collection, sample cleaning and detection, which provides fast and accurate results at a fraction of the cost of conventional methods. The sample collection stage uses a new filter technology patented by Genera, which is designed to capture particles in water and then release them again. Typically, 10 litres of river water or 1,000 litres of clean water is filtered, and then a sample of 250ml can be processed in approximately six minutes. "The conventional method would take around three hours," says Dr Parton. "Our filter method is very rapid, very efficient and quite simple. The apparatus used is small, and doesn’t require specific skill or laboratory equipment." The sample collected through the filter technology is then cleaned to prepare it for testing. "To detect parasites using our technology, you need to get rid of the debris in the water," says Dr Parton. "You have to get a clean sample from something that looks like mud. We use a novel, affinity-based separation technique to do this, which specifically extracts the organisms to be tested from the mud soup." Economical ProcessAlthough technology already exists for sample clean-up, in the form of flowcytometry, the Genera technique is much less expensive, says Parton: "The equipment needed for flowcytometry can cost up to £200,000, which puts it beyond the reach of many water companies. Our system is orders of magnitude cheaper, and doesn’t require highly skilled operators. A junior lab technician or graduate could use the equipment, and it also has the potential to be automated." The final stage in Genera’s new detection process is also simple to use, and employs pioneering technology designed by Dr Parton in collaboration with Professor Ronald Pethig of University College North Wales. Their technique, known as electrorotation assay (ERA), is based on the principle that particles spin within electric fields in a very specific way, and this can be observed down a conventional microscope. "If you create a rotating electric field and place an object into that field it will spin in a particular way," explains Dr Parton. "If you then alter that object, by adding something to it, it will spin differently." The "object" used by Genera is a reagent which is specific to the organism being tested for – in this case, giardia or cryptosporidium. If the organism is present in the sample, it will attach itself to the particles of reagent and make them spin in a very distinct way, at a frequency which is a "blueprint" for that organism. Not only does ERA detect the presence of giardia and cryptosporidium: it can also tell the test operator whether the organism is alive or dead. "If the organism is alive its cyst wall is constantly exchanging ions with the surface," says Dr Parton. "When the organism is dead the cyst wall is no longer intact and does not have a defined surface charge. This changes the way it behaves in an electric field." Dead or AliveThe ERA technique is so sensitive it is possible to obtain a total count of the organisms present, and their viability, within a few minutes. Indeed, the Genera detection process takes only about three hours from start to finish, which presents a considerable time saving over conventional methods. "In the USA, the conventional test can take up to 20 hours," says Dr Parton. "If the sample is sent to a contract laboratory, it can take from five to 20 days to obtain a result." |
||||||
|
|
The Genera process allows the parasites to be seen clearly on a TV monitor |
|||||
|
The speed at which Genera’s test can be completed, along with the fact that it’s relatively inexpensive and simple to operate, will make the process highly marketable. In the USA, where the majority of water utility companies serve only a few thousand people, and can’t afford the technical expertise or expensive equipment required for conventional testing, Genera’s technology is likely to prove indispensable. US Testing GroundWith this in mind, Genera is planning to market its test initially in the USA, and has already signed a licence agreement with the American water instrumentation company Hach. Genera has also taken on a technology manager, David Dawson, an expert in cryptosporidium, who will be involved in preparing the product for the market. Although the most obvious market for Genera’s product is the USA, where it is likely to go on sale later this year or early next year, the technique will eventually be sold on a worldwide basis. In the meantime, Genera is developing other microbiological and chemical assays based on its novel technology, which has the potential to change the face of the testing procedure and benefit water companies throughout the world. For further information please contact Dr Adrian Parton at Genera on +44 (0)1223 421945 |
||||||
|
|
||||||
When a particle is placed in a non-uniform rotating a.c. electric field a dipole moment is induced and a torque applied, causing the particle to spin. The induced torque is dependant upon the applied voltage/frequency and the relative dielectric properties of the particle and its suspending medium. This phenomenon is known as ELECTROROTATION.
Electrorotation is exploited in combination with antibody technology to give the ELECTROROTATION ASSAY (ERA). In this a known particle is complexed with an analyte causing a change in the dielectric properties of the constituents. This dielectric shift can be detected as a change in the rotational characteristics in an ERA measurement cell. The selectivity of the assay can be controlled by the choice of binding agents used on the known particle. In short,
this assay enables the rapid and accurate detection of analytes in aqueous solution and is sensitive enough to detect analytes ranging from whole cells to molecular species.
The electrorotation assay is a technique which uses the phenomenon of electrorotation in combination with antibody technology to enable the rapid and accurate detection of analytes in aqueous solutions [1]. In the assay an analyte is bound to a known particle causing a change in the dielectric properties of the analyte-bead complex over the properties of just the bead. This change in the dielectric properties is subsequently detected using the electrorotation technique described above. Selectivity can be controlled by the choice of binding agents used on the known particle. This assay method can be used with different analytes ranging from whole cells to molecular species.
The graph above shows the electrorotational spectra of polystyrene beads after 3 different treatments. The first trace shows the response of an uncoated bead and can be described by three distinct regions. At low frequencies a slow rotation rate is observed which decreases with increasing electric field frequency. A region where the beads are almost stationary is then displayed from around 2kHz to 20kHz before the rotation rate increases to a large peak at approximately 600kHz. The shape of this spectrum is typical for most polystyrene particles and is used as a control for detecting changes in particle rotation as the Electrorotation Assay is performed. The remaining traces in figure 4 show the change in the rotation profile of beads as a result of applying a coating to the surface of the bead. In these cases the beads have been treated with different antibody/protein complexes. The effect of the coatings is to alter the dielectric properties of the bead-coating complex over the properties of the beads alone and these, in turn, are reflected in the rotation spectra of the treated beads. The beads after coating now exhibit rotational responses which have increased rotation rates at low frequencies and a change in the magnitude and frequency of the high frequency peak in rotation. By comparing the electrorotational spectra of complexed beads with uncoated beads it is possible to determine the presence of particular proteins within a mixed sample.
This work has been carried out in collaboration with Genera Technologies Ltd. Cambridge, UK
Cell-Virus Interaction
Rotating AC electric fields (electrorotation) are used to characterise the dielectric properties of individual cells and to monitor physiological changes in the properties of cells.
The speed of rotation of a cell varies with the applied frequency of the AC field and is in the region of a few revolutions per second. By modelling a cell as a series of concentric spheres (or shells) it is possible to obtain the dielectric parameters of the cell from the variation of the rotation rate with applied frequency.
Electrorotation is used to study the dielectric properties of individual Baby Hamster Kidney Fibroblasts (BHK(C-13)). These cells are being studied to probe the electrophysiology of viral infection using the Herpes Simplex Virus, type 1.
The variation in the electrical parameters of a cell has been compared with the known biophysical life-cycle of the virus, allowing for the first time a real time study of viral infection of a single cell.
Shown below is the rotation spectrum for a typical HSV infected fibroblast as a function of applied frequency.
A number of infected and non-infected cells have been studied and their average dielectric properties found to be different. This implies that it is theoretically possible to separate infected and non-infected BHK cells.
Based upon these differences, techniques for the separation of infected and non-infected cells BHK(C-13) cells are being developed.
-----------------------------------------------------------------------------------------------------------------------------------------------
Ringraziamenti
Ringraziamo il Prof. Bonincontro per la sua disponibilità , il tecnico Rocco del laboratorio di elettronica (senza il quale non avremmo potuto realizzare la nostra terza prova), il laureando Sergio Ferrari per i preziosi suggerimenti e naturalmente la Prof.ssa Congiu che ci ha consentito di portare avanti l'evoluzione dell'esperimento di E.R. con generatore esterno.
Speriamo che quanto finora scritto possa essere d'aiuto in futuro a chi sarà interessato a sviluppare l'argomento elettrorotazione e il relativo apparato di misura.