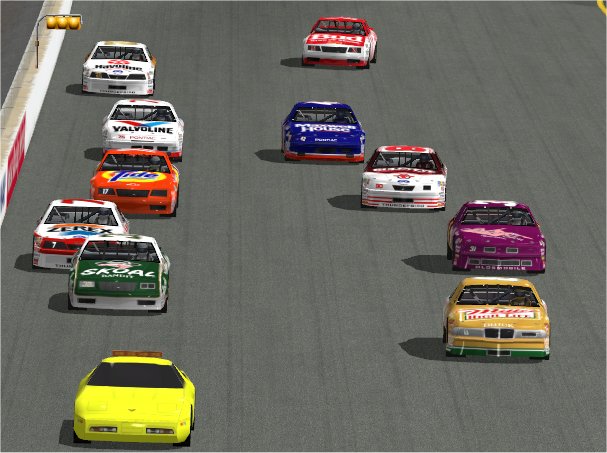
Remembering the racing legends of yesterday
who made NASCAR what it is today!
![]()
|
Remembering the racing legends of yesterday who made NASCAR what it is today!
|
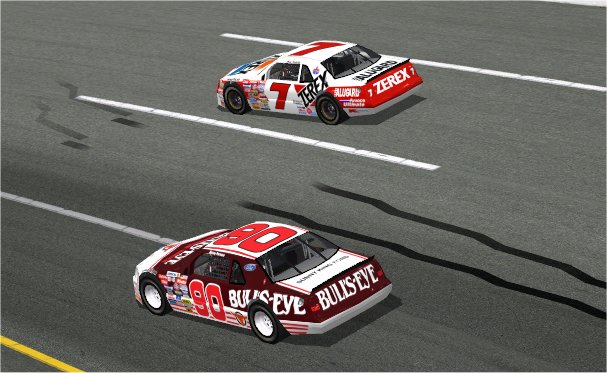
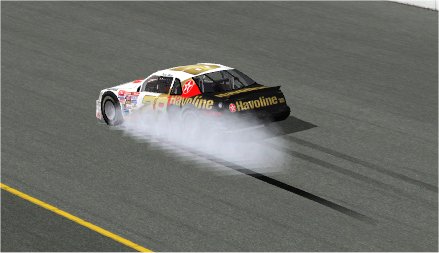
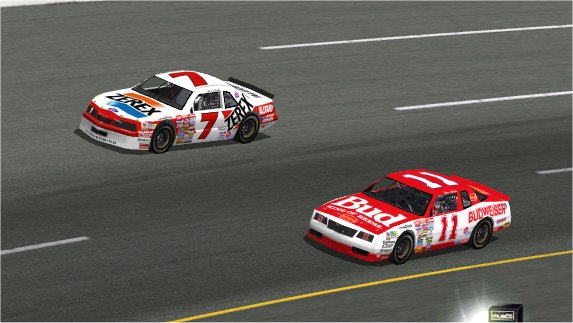
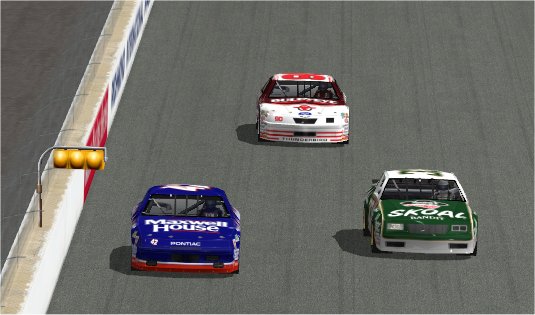
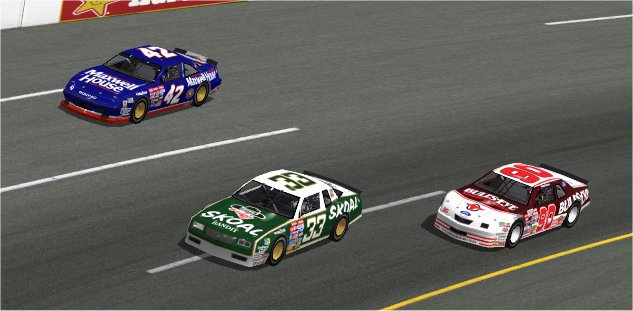
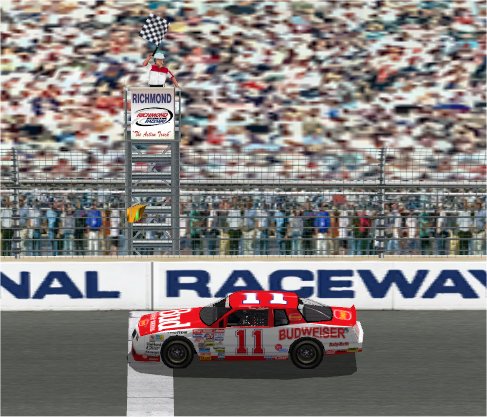
Final Race Results RACE RESULTS (After 100 laps) Pos No Driver Laps Race Time Diff Speed Problem Points 1 11 Dan Searle 100 42m12.081s 106.632 180 2 8 Dave Blaxland 100 42m31.717s 19.636s 105.811 175 3 28 Scott Mullin 100 42m35.021s 22.940s 105.674 170 4 7 Vince MacDonald 99 42m21.191s 1 lap(s) 105.187 160 5 75 Carman Schwartz 98 42m23.111s 2 lap(s) 104.046 155 6 42 J Agnew 97 42m29.292s 3 lap(s) 102.735 150 7 31 Peter Seymour 75 34m15.899s 25 lap(s) 98.497 Retired 146 8 33 Scott Scrimgeour 74 32m13.891s 26 lap(s) 103.315 Wheel 152 9 90 Geoff Bonner 53 23m13.837s 47 lap(s) 102.666 138 10 17 Don Burchill 11 6m55.602s 89 lap(s) 71.462 Retired 134 11 -1 Pace Car 0 DidNotStart 100 lap(s) 12 74 The Player 0 DidNotStart 100 lap(s) RACE FASTEST LAPS Pos Driver Time Speed Lap 1 Scott Mullin 22.861s 118.105 68 2 Scott Scrimgeour 22.915s 117.827 65 3 Dan Searle 22.933s 117.734 64 4 Dave Blaxland 23.064s 117.066 66 5 Vince MacDonald 23.079s 116.990 13 6 Geoff Bonner 23.083s 116.969 26 7 Peter Seymour 23.253s 116.114 17 8 Carman Schwartz 23.264s 116.059 78 9 J Agnew 23.475s 115.016 55 10 Don Burchill 23.655s 114.141 4 11 Pace Car No time 12 The Player No time LEADERS Driver Laps Dave Blaxland 1-4 Scott Scrimgeour 5-61 Scott Mullin 62-63 Scott Scrimgeour 64-69 Dan Searle 70-100 Number of lead changes: 4 Number of leaders: 4 MOST LAPS LED Driver Laps led Scott Scrimgeour 63 Dan Searle 31 Dave Blaxland 4 Scott Mullin 2 HIGHEST CLIMBER Driver Start Finish Change Dan Searle 12 1 11 Scott Mullin 10 3 7 Carman Schwartz 9 5 4 J Agnew 7 6 1 Pace Car 11 11 0 Vince MacDonald 4 4 0 Dave Blaxland 1 2 -1 Peter Seymour 3 7 -4 The Player 8 12 -4 Don Burchill 6 10 -4 Geoff Bonner 5 9 -4 Scott Scrimgeour 2 8 -6 PIT STOPS Driver Stops/Laps Dave Blaxland (3/100) Peter Seymour (3/75) Dan Searle (2/100) J Agnew (2/97) Carman Schwartz (2/98) Vince MacDonald (1/99) Scott Mullin (1/100) Scott Scrimgeour (1/74) BLACK FLAG LAPS Driver Laps/Total Peter Seymour (7/75) Scott Mullin (1/100) J Agnew (1/97) ON TRACK LAPS Driver Laps/Total Percent Dan Searle (96/100) 96.00 Scott Mullin (96/100) 96.00 Vince MacDonald (94/99) 94.95 Carman Schwartz (94/98) 95.92 Dave Blaxland (93/100) 93.00 J Agnew (85/97) 87.63 Scott Scrimgeour (70/74) 94.59 Peter Seymour (64/75) 85.33 Geoff Bonner (53/53) 100.00 Don Burchill (11/11) 100.00 RACE LAPTIME CONSISTENCY (first lap excluded) Driver Avg Deviation Std Deviation Avg Laptime Laps Dan Searle 3.586 7.323 25.317s 100 Vince MacDonald 3.651 7.437 25.697s 99 Carman Schwartz 3.697 7.325 25.961s 98 Dave Blaxland 3.757 7.745 25.555s 100 Scott Mullin 3.999 7.878 25.554s 100 J Agnew 4.161 8.193 26.300s 97 Scott Scrimgeour 4.982 8.645 26.186s 74 Geoff Bonner 5.397 9.223 26.358s 53 Peter Seymour 6.238 9.754 27.476s 75 Don Burchill 15.030 15.260 39.186s 11 |