Objectives:
- Students will collect weather data from their region on a daily basis.
- Students will prepare a weekly report to be posted on this website.
- Students will prepare a monthly report comparing their data with their partner's.
- Students will learn about different severe weather phenomena and be able to explain their dynamics.
- Students will announce their own daily weather forecast to their classmates.
- Students will make graphics to illustrate their observations.
In a brainstorming session, ask your students to list the different data that goes into weather forecasting. The following should be found:
- air temperature (highs and lows)
- humidex factor (in summer)
- windchill factor (in winter)
- relative humidity
- air pressure
- solar radiation (in hours/day)
- precipitations
- wind speed
- wind direction
- location of warm and cold fronts, etc.
Give a brief definition for students to write down.
Tell students that the first step of this project is to collect daily weather data from their region. You might want to provide them with the URL of the nearest weather station in your area.
Data should be collected in the morning (before school) and in the afternoon (after school).
The second step is to take all this data and turn it into graphics to show the evolution throughout the week.
Then, you send us your weekly graphics so we can post them on this website.
At the end of the month, students put all the graphics together to make a monthly graphic.
At this stage, students should compare their graphics with the monthly averages of your region and exchange results and comments with other partner schools using email.
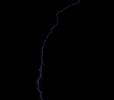
There should also be a monthly discussion on a severe weather phenomenon, favorable conditions for the appearence of these phenomena and if they are likely to happen in their region.
Now that students are more familiar with the factors that make our weather, they can make their own forecasts based upon collected data.
To do this, you might want to divide your class in teams of two students that will forecast your local weather for every day of the week. Then, another team does the next week and so on.
If a sever storm does strike in your area(we don't wish that, but...), you might also want to do a photo report and send it via snail mail to your partner school, just like we did in January 1998 when a huge icestorm crippled Quebec and northeastern USA under more than 80 mm of freezing rain.
The objectives of this project fit Science and Mathematic curricular better than ESL objectives. This is why my students can do this project on a voluntary basis for bonus points. I'm sure Science and Math teachers have better knowledge on how to evaluate this(these) project(s). So please Science and Math teachers, give me some feedback on this project, won't you? Thank you! :-) ... MGD...