A Decrease In Supply
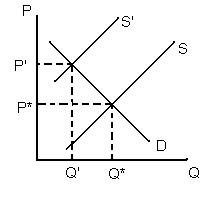
The graph shows the effects of a decrease in supply. The original equilibrium is at the intersection of the supply and demand curves, S and D. The initial price- quantity pair is designated as P* and Q*. The decrease in supply is shown by the movement of the supply curve from S to S'. The new intersection results in a new price- quantity pair designated as P' and Q'. Notice that a decrease in supply caused the price of the good to increase from P* to P' and the quantity produced to decrease from Q* to Q'. So a decrease in supply causes price to rise and quantity to fall.
A Decrease In Supply
![]()
![]()