Graph 4.6 Supply Decreases and Demand Increases
When supply and demand shift in opposite directions one will be increasing while the other is decreasing. There are two possibilities that arise from the shifting curves, one shifts more than the other or they both shift by the same amount. In either case the means of analysis is the same, although the results will differ. The graph shows the following for an increase in demand and a decrease in supply, a) demand shifts more than supply, b) supply and demand shift by the same amount and c) demand shifts less than supply.
Graph 4.6 Supply Decreases and Demand Increases
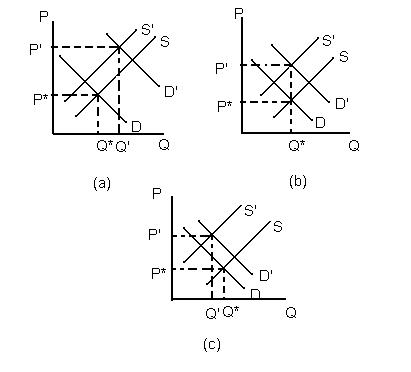
In all three diagrams, the initial supply and demand curves are designated S and D with equilibrium values of P* and Q*. The decrease in supply is shown by the movement of the supply curve from S to S'. The increase in demand is shown by the movement of the demand curve from D to D'. The new equilibrium's are designated by price P' and quantity Q'.
Looking at the results of the shifts, in part (a) the demand shifted more than the supply, both quantity and price increased. In part (b) both supply and demand moved by the same amount, the quantity did not change and the price increased. In part (c) supply moved more than demand, the quantity decreased and the price increased. Combining these three possibilities tells us that when demand increases and supply decreases the the price of the good increases but the change in quantity is dependent upon the relative movements of the supply and demand curves. So an decrease in supply and an increase in demand will increase price but we are uncertain what will happen to quantity. A decrease in demand and an increase in supply has similar results and is left as an exercise for the student.
![]()
![]()