First and foremost, in order to have cigarettes by any means, there is one main ingredient that is utterly essential.
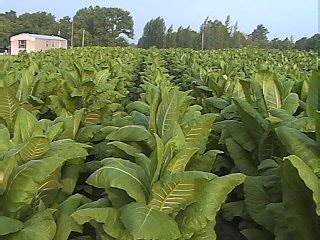
TOBACCO!
The quantity available and the price of tobacco, along with other resources, is what determines the supply of cigarettes. Also, comes the labor required to grow tobacco, process tobacco and lastly produce the cigarette. Growing tobacco is not as simple as it seems, there is the weather, of course. Weather makes a tremendous impact on the outcome of the crops. If there are droughts, the tobacco outcome will not be sufficient. Since weather can not be controlled, the outcome can not be controlled either. Therefore, the efficiency of tobacco is never certain. The price is a result of the quantity that is available to be supplied. Once the workers of the plant buy the tobacco, there is the processing, which is done at the plant. The processed tobacco is then made into cigarettes by machines. These machines do all the work during the production of cigarettes. All these resources, tobacco, workers and machinery, cost money. The amount of money spent on these resources helps determine the supply of cigarettes. Therefore, the more it costs to produce cigarettes, the smaller is the quantity supplied.
![]()
Taxes
Taxes on cigarettes plays a major part on the supply also. Excise taxes are an example of a tax that reduces supply. Cigarette excise tax varies by state, but New York, New Jersey, and Massachusetts have the highest. It varies from the lowest, which is 5 cents to $1.51. As the taxes go up on cigarettes, some people stop buying them because it is just too much money to waste on a habit. Therefore, since the demand falls because of taxes, the supply also falls. This result is not so bad though for health groups, which see the tax increase as an advantage to help reduce smoking. In recent years, several states have increased their cigarette tax, and as economic research predicts, they have reduced smoking, especially among youth, while increasing tax revenues. Below are two tables showing the cigarette excise taxes for each state.
Number of sellers
The greater the number of sellers in a market, the larger is the supply. As a result of so many Americans hooked on cigarettes, there is so much opportunity for cigarette companies to make a profit. This is an incentive for them, also. As the taxes keep on going up, companies secretly raise their own prices. This ends up in more money for the companies. Why not supply more cigarettes! In the chart below, you can see that as the years go by, more and more brands come out into the market.
U.S. Cigarette Brand Proliferation
*"Brand styles" refers to lights, ultra lights, 100mm, etc.
These figures count each manufacturer�s private-label brands as one brand style.
Productivity
As productivity increases, it lowers costs and increases supply. As technology improves though, productivity increases. An example of this is the machinery used to produce the cigarettes. When the machinery is updated, more cigarettes are produced than before, resulting in an increase in supply. An example of technological advances is Tuton-CTC, which is a state tobacco enterprise. They have installed new technology, which is expected to increase production from 9.1 billion cigarettes per year to 15 billion. This comes to show how the advancement of technology can change production to close to double.
© 2003 [email protected]
State
Per Pack
State
Per Pack
Alabama
16.5�
Missouri
17�
Alaska
$1.00
Montana
18�
Arizona
$1.18
Nebraska
64�
Arkansas
31.5�
Nevada
35�
California
87�
New Hampshire
52�
Colorado
20�
New Jersey
$1.50
Connecticut
$1.11
New Mexico
21�
Delaware
24�
New York
$1.50
District of Columbia
65�
North Carolina
5�
Florida
33.9�
North Dakota
44�
Georgia
12�
Ohio
55�
Hawaii
$1.20
Oklahoma
23�
Idaho
28�
Oregon
$1.28
Illinois
98�
Pennsylvania
$1.00
Indiana
55.5�
Rhode Island
$1.32
Iowa
36�
South Carolina
7�
Kansas
70�
South Dakota
33�
Kentucky
3�
Tennessee
20�
Louisiana
36�
Texas
41�
Maine
$1.00
Utah
69.5�
Maryland
$1.00
Vermont
93�
Massachusetts
$1.51
Virginia
2.5�
Michigan
$1.25
Washington
$1.425
Minnesota
48�
West Virginia
17�
Mississippi
18�
Wisconsin
77�
Wyoming
12�
Source: Management Science Associates
![]()

Year
Brand families
Individual Brand styles*
1950
21
21
1970
43
97
1980
52
85
1998
64
508
199
65
516
2000
61
503
1Q 2001
61
508
![]()