Exemplo de Superfícies - Funcőes de duas variáveis
set samples 21
set isosample 11
set xlabel "X axis" -3,-2
set ylabel "Y axis" 3,-2
set zlabel "Z axis" -5
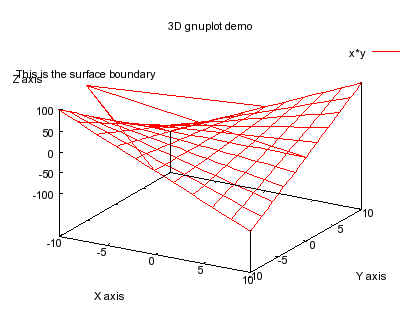
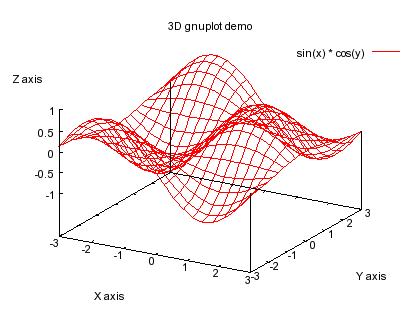
set title "3D gnuplot demo"
set label 1 "This is the surface boundary" at -10,-5,150 center
set arrow 1 from -10,-5,120 to -10,0,0 nohead
set arrow 2 from -10,-5,120 to 10,0,0 nohead
set arrow 3 from -10,-5,120 to 0,10,0 nohead
set arrow 4 from -10,-5,120 to 0,-10,0 nohead
set xrange [-10:10]
set yrange [-10:10]
splot x*y
unset arrow
unset label
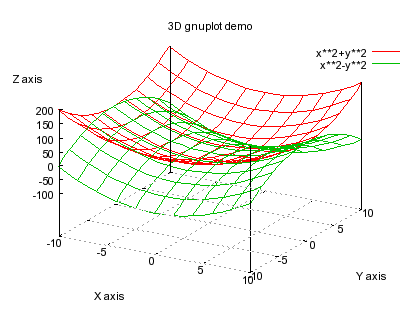
set grid
splot x**2+y**2, x**2-y**2
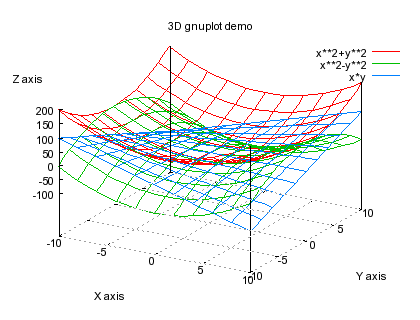
rep x*y
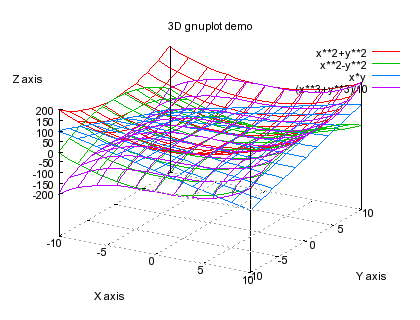
rep (x**3+y**3)/10
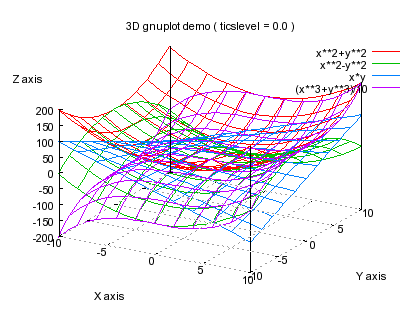
set ticslevel 0.0
set title "3D gnuplot demo ( ticslevel = 0.0 )"
rep
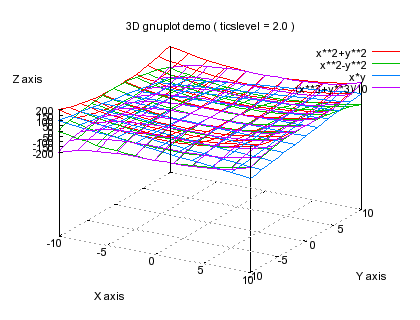
set ticslevel 2.0
set title "3D gnuplot demo ( ticslevel = 2.0 )"
rep
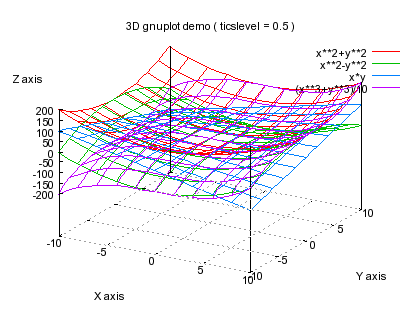
set ticslevel 0.5
set title "3D gnuplot demo ( ticslevel = 0.5 )"
rep
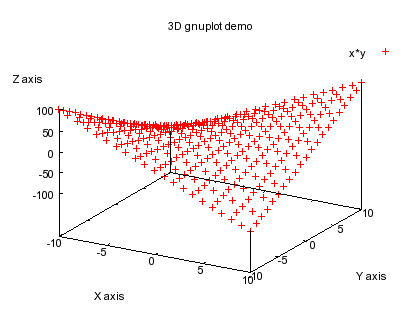
set title "3D gnuplot demo"
unset grid
splot x*y with points
unset xtics
unset ytics
set xrange [-1:1]
set yrange [-1:1]
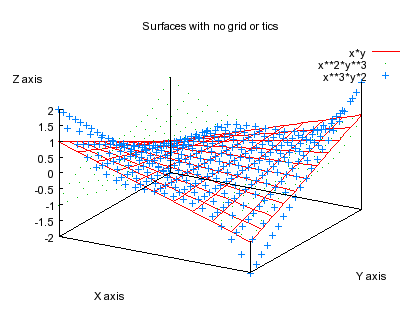
set title "Surfaces with no grid or tics"
splot x*y with lines, x**2*y**3 with dots, x**3*y*2 with points
set xtics ("low" -3, "mid" 0, "high" 3)
set ytics -2,0.5,2
set xrange [-3:3]
set yrange [-3:3]
set log z
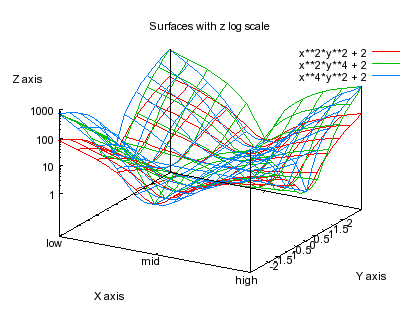
set title "Surfaces with z log scale"
splot x**2*y**2 + 2, x**2*y**4 + 2, x**4*y**2 + 2
unset log z
set xtics autofreq
set ytics autofreq
set xrange [-1:1]
set yrange [-1:1]
set samples 51
set isosample 21
set dummy u,v
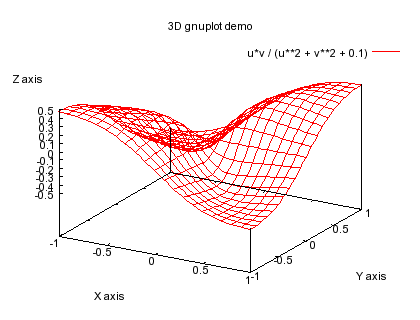
set title "3D gnuplot demo"
splot u*v / (u**2 + v**2 + 0.1)
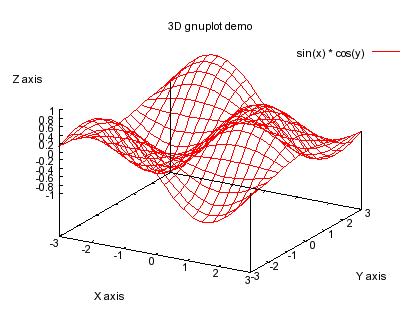
splot [x=-3:3] [y=-3:3] sin(x) * cos(y)
set zrange [-1.0:1.0]
replot
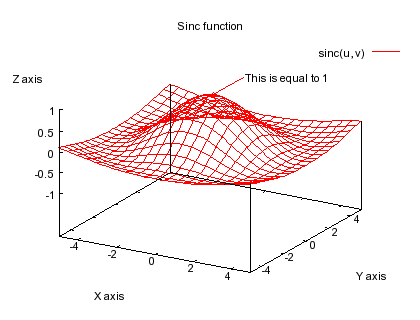
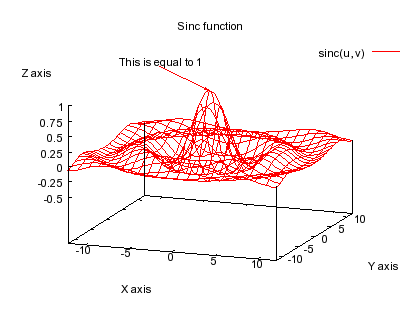
set title "Sinc function"
set zrange [-1:1]
set label 1 "This is equal to 1" at 0,3.2,1 left
set arrow 1 from 0,3,1 to 0,0,1
sinc(u,v) = sin(sqrt(u**2+v**2)) / sqrt(u**2+v**2)
splot [-5:5.01] [-5:5.01] sinc(u,v)
set view 70,20,1
set zrange [-0.5:1.0]
set ztics -1,0.25,1
set label 1 "This is equal to 1" at -5,-2,1.5 centre
set arrow 1 from -5,-2.1,1.4 to 0,0,1
splot [-12:12.01] [-12:12.01] sinc(u,v)
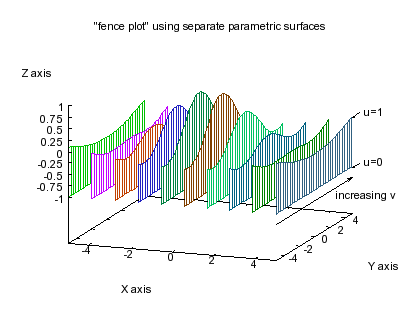
set title "\"fence plot\" using separate parametric surfaces"
set zrange [-1:1]
unset label
unset arrow
set xrange [-5:5]; set yrange [-5:5]
set arrow from 5,-5,-1.2 to 5,5,-1.2 lt -1
set label 1 "increasing v" at 6,0,-1
set arrow from 5,6,-1 to 5,5,-1 lt -1
set label 2 "u=0" at 5,6.5,-1
set arrow from 5,6,sinc(5,5) to 5,5,sinc(5,5) lt -1
set label 3 "u=1" at 5,6.5,sinc(5,5)
set parametric
set hidden3d
set isosamples 2,33
xx=-5; dx=(4.99-(-4.99))/9
x0=xx; xx=xx+dx
x1=xx; xx=xx+dx
x2=xx; xx=xx+dx
x3=xx; xx=xx+dx
x4=xx; xx=xx+dx
x5=xx; xx=xx+dx
x6=xx; xx=xx+dx
x7=xx; xx=xx+dx
x8=xx; xx=xx+dx
x9=xx; xx=xx+dx
splot [u=0:1][v=-4.99:4.99] \
	x0, v, (u<0.5) ? -1 : sinc(x0,v) notitle, \
	x1, v, (u<0.5) ? -1 : sinc(x1,v) notitle, \
	x2, v, (u<0.5) ? -1 : sinc(x2,v) notitle, \
	x3, v, (u<0.5) ? -1 : sinc(x3,v) notitle, \
	x4, v, (u<0.5) ? -1 : sinc(x4,v) notitle, \
	x5, v, (u<0.5) ? -1 : sinc(x5,v) notitle, \
	x6, v, (u<0.5) ? -1 : sinc(x6,v) notitle, \
	x7, v, (u<0.5) ? -1 : sinc(x7,v) notitle, \
	x8, v, (u<0.5) ? -1 : sinc(x8,v) notitle, \
	x9, v, (u<0.5) ? -1 : sinc(x9,v) notitle
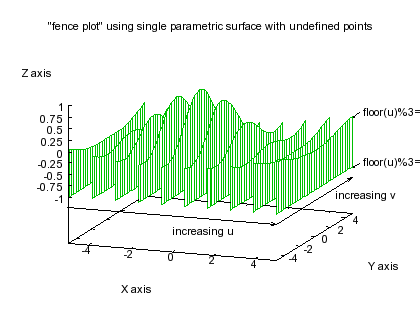
set title "\"fence plot\" using single parametric surface with undefined points"
set parametric
unset label
unset arrow
xmin=-4.99; xmax=5; n=10; dx=(xmax-xmin)/(n-1.)
set isosamples 3*n,33
zbase=-1
set arrow from 5,-5,-1.2 to 5,5,-1.2 lt -1
set label 1 "increasing v" at 6,0,-1
set arrow from -5,-5,-1.2 to 5,-5,-1.2 lt -1
set label 2 "increasing u" at 0,-5,-1.5
set arrow from 5,6,-1 to 5,5,-1 lt -1
set label 3 "floor(u)%3=0" at 5,6.5,-1
set arrow from 5,6,sinc(5,5) to 5,5,sinc(5,5) lt -1
set label 4 "floor(u)%3=1" at 5,6.5,sinc(5,5)
splot [u=.5:3*n-.5][v=-4.99:4.99] \
	 xmin+floor(u/3)*dx, v, ((floor(u)%3)==0) ? zbase : \
			 (((floor(u)%3)==1) ? sinc(xmin+u/3.*dx,v) : 1/0) notitle
unset hidden3d; unset parametric; set isosamples 20,20
set xrange [-1:1]; set yrange [-1:1]
set ztics autofreq
unset arrow
unset label
set log
set auto
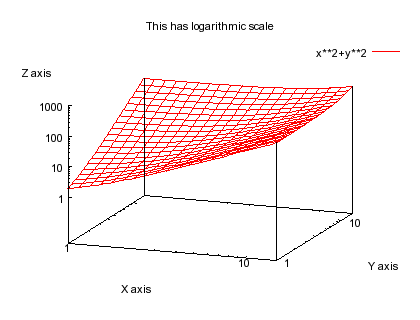
set title "This has logarithmic scale"
splot [x=1:15] [y=1:15] x**2+y**2
unset log
set xrange [0:15]
set yrange [0:15]
set auto
#set zrange [-0.6:0.7]
set ticslevel 0
set style data lines
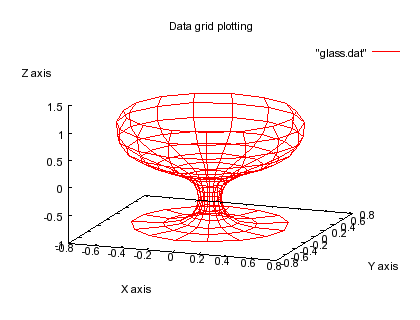
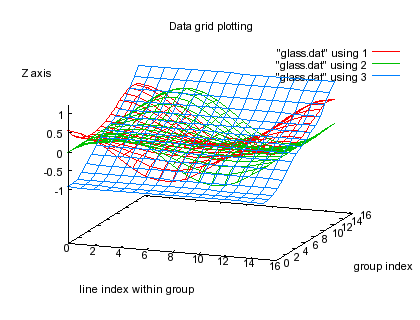
set title "Data grid plotting"
set parametric
splot "glass.dat"
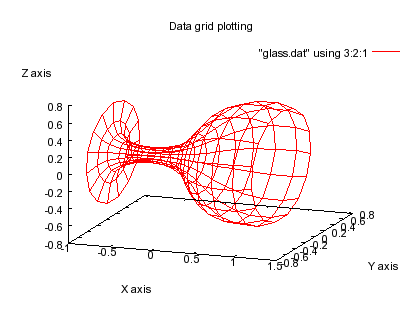
splot "glass.dat" using 3:2:1
set zrange [-1.2:1.2]
set ticslevel 0.5
unset parametric
set xlabel "line index within group"
set ylabel "group index"
splot "glass.dat" using 1, "glass.dat" using 2, "glass.dat" using 3
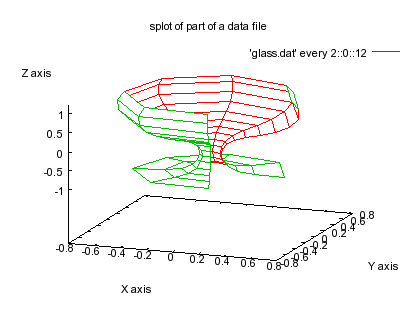
set title "splot of part of a data file"
set xlabel "X axis" -3,-2
set ylabel "Y axis" 3,-2
set hidden3d
splot 'glass.dat' every 2::0::12 with lines
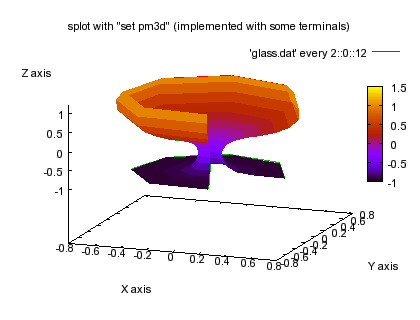
set title "splot with \"set pm3d\" (implemented with some terminals)"
set pm3d
set hidden3d
splot 'glass.dat' every 2::0::12 with lines
unset hidden3d
unset pm3d
set param
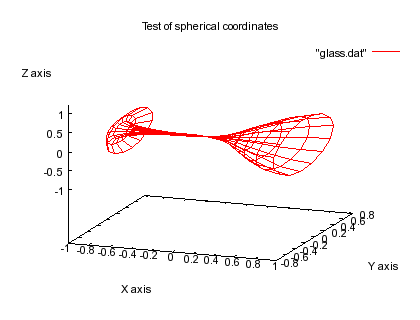
set title "Test of spherical coordinates"
set mapping spherical
splot "glass.dat"
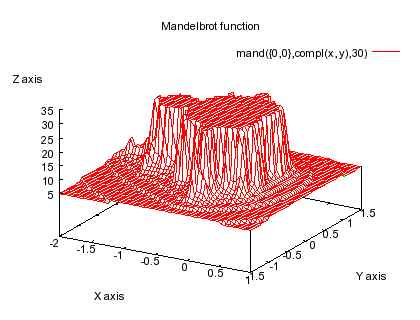
set title "Mandelbrot function"
unset parametric
set mapping cartesian
set view 60,30,1,1
set auto
set isosamples 60
set hidden3d
compl(a,b)=a*{1,0}+b*{0,1}
mand(z,a,n) = n<=0 || abs(z)>100 ? 1:mand(z*z+a,a,n-1)+1
splot [-2:1][-1.5:1.5] mand({0,0},compl(x,y),30)

reset