Coordenadas Paramétricas
set parametric
set dummy t
set autoscale
set samples 160
set title ""
set key box
set key below
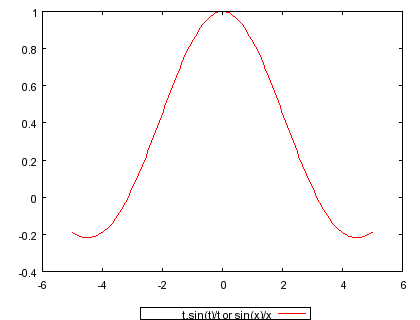
plot t,sin(t)/t title "t,sin(t)/t or sin(x)/x"
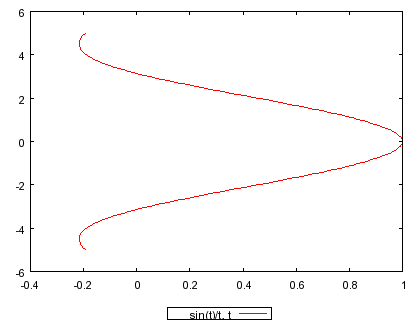
plot sin(t)/t,t
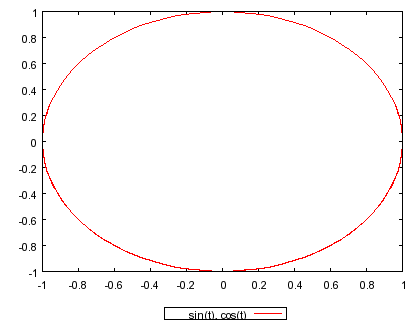
plot sin(t),cos(t)
set xrange [-3:3]
set yrange [-3:3]
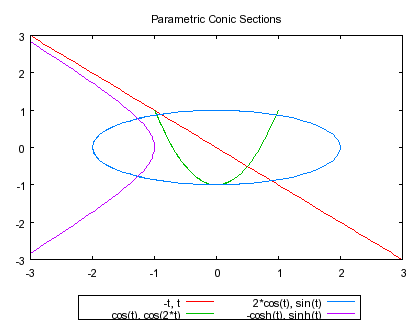
set title "Parametric Conic Sections"
plot -t,t,cos(t),cos(2*t),2*cos(t),sin(t),-cosh(t),sinh(t)
set title ""
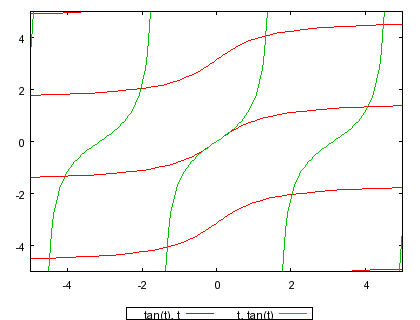
set xrange [-5:5]
set yrange [-5:5]
plot tan(t),t,t,tan(t)
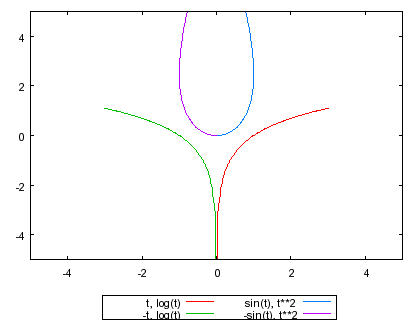
set trange [0.00001:3]
plot t,log(t),-t,log(t),sin(t),t**2,-sin(t),t**2
set autoscale x
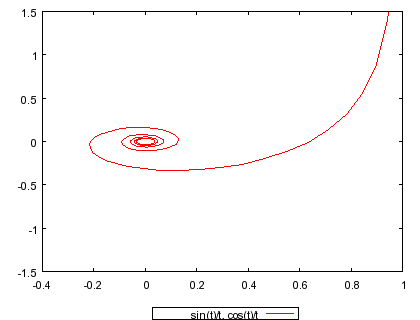
set yrange [-1.5:1.5]
set trange [0.0001:10*pi]
plot sin(t)/t,cos(t)/t

# undo what we've done above
reset